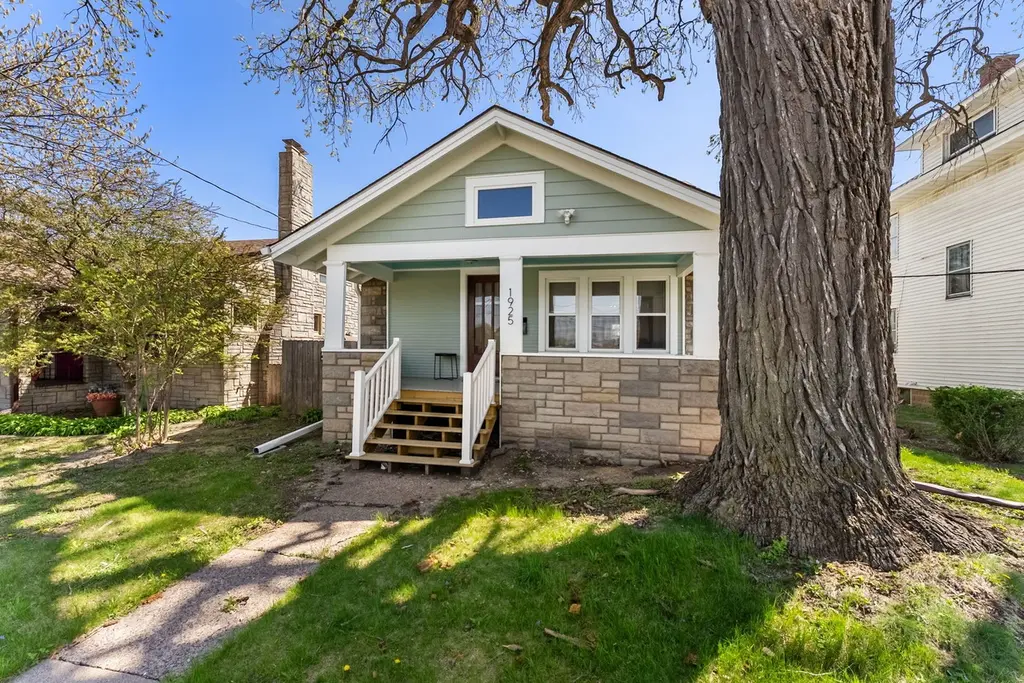
1925 Eastern Ave · Davenport, IA
Flood risk 1/10 · Minimal
- FEMA flood zone
- X (unshaded)
- Chance of flooding over 30 yrs
- 0.0%
- Est. flood insurance / yr
- $473 – $860
Fire risk 1/10 · Minimal
- Est. fire insurance / yr
- $902 – $1,676
Heat risk 3/10 · Minor
- Hot days now (above 103°F)
- 7 days/yr
- Hot days in 30 yrs
- 16 days/yr
Wind risk 2/10 · Minimal
- Chance of severe wind over 30 yrs
- —
Air-quality risk 3/10 · Minor
- Unhealthy air days now
- 2 days/yr
- Unhealthy air days in 30 yrs
- 3 days/yr
Risk factors via First Street. Map © Google.
Why this score? — see what drove the D+ grade
The composite is a weighted blend of 9 inputs, each scored 0–100. Each bar is that input's sub-score; the figure is the points it added to the 100-point composite (weight × sub-score).
- ARV discount +15.0/15.0
- Cash flow +11.9/30.0
- Livability +4.0/5.0
- Schools +3.9/10.0
- Rent growth +3.6/5.0
- DSCR +3.5/10.0
- 1% rule +3.1/10.0
- Condition / age +2.5/5.0
- Appreciation +0.0/10.0
$149,900
🖨 Deal sheet 📄 Offer letter ✓ Due diligence
Listing remarks MLS
No parking on Eastern Avenue. Park in rear. Access is in alley off E Locust Street. Turn into alley immediately before the Mercy One Genesis sign. Estate sale. Sold strictly AS IS. Good investment flip opportunity. Two bedrooms on main floor and potential 3rd bedroom in upper level. No heat or cool in upper level. Bath remodeled - walk-in shower, half bath in basement. Newer furnace & CAC. Enclosed front porch. Hardwood floors under carpet. Some replacement windows. Fenced yard. Washer/Dryer and stove remain but not warranted. Roof 2016
Key facts
- Cozy family room
- Move in ready
- Fully fenced yard
Tags
Neighborhood map
What this means for you Summary
Snapshot
- This is a 2-bed/2.0-bath single-family listed at $150k.
Deal economics
- At list price, monthly cash flow is $-38 ($-455/yr) — negative.
- To cash-flow at today's rent, offer at most $143k (4.5% below list).
- To meet the 1% rule (rent ≥ 1% of price), the offer needs to be $122k (18.8% below list).
- Recommended offer: $122k (18.8% below list) — sets the bar for 1% rule.
- Cap rate 6.0% vs local median 4.4% in Davenport — top-decile yield for the area; either an underpriced asset or a hidden risk that comps aren't pricing in. Stress-test before assuming the spread holds.
Location & tenants
- Location reads 79/100 on livability (#126 in IA, #2,312 nationally) — a middle-class / working-renter tenant base. Strengths: cost of living A+, housing A+, health & safety A+; Watch: employment C-, crime F.
- Davenport Community School District (urban): math 43% / reading 50% proficiency, ranked #288 of 289 in IA (top 100%) — families likely to look elsewhere, expect single-tenant / working-renter base with shorter leases.
- Market conditions: Rents rising fast (+4.6%/yr); 160 active listings in the ZIP; 35 comparable units currently listed for rent nearby; rentals lingering (median 44d on market — plan ~5-8 weeks vacancy on turnover, expect pricing pressure); 60% of comp listings sitting > 30 days — soft ceiling on asking rent; 805 units permitted in Scott County in 2024 (479 in 5+ unit buildings).
Forward outlook
- Local home prices are declining (-3.0%/yr); year-one equity from $1k of loan paydown is wiped out by about $4k of value loss. Plan a longer hold.
- Scott County population projected at +19% by 2050 — long-run rental-demand tailwind backs the buy-and-hold thesis.
Negotiation context
- Only 6 days on market — expect competitive offers; lowballing is unlikely to land.
- 3 sale attempts with the ask held roughly flat each time — persistent listings suggest the price (not the market) is what's stuck; bring a comps-based counter.
- Current owner paid $75k; list at $150k implies a 100% gain — meaningful room to come down on a strong offer.
Risks & watch-outs
- Watch-outs: built in 1914 — expect roof / HVAC / electrical / plumbing capex.
Questions for the listing agent
- What do current leases actually rent for vs. the listed asking? Can we see a recent rent roll and the last 12 months of T-12 income?
- Built in 1914 — when were the roof, HVAC, electrical panel, plumbing, and water heater last replaced?
- Is there a deadline driving the sale (1031 exchange, divorce, estate, relocation)? That informs how much negotiation room exists.
- Crime grade is F in this area — have there been break-ins, vandalism, or insurance claims at this property in the last 3 years? What carrier currently insures it and at what premium?
- The area grade is low — what's the realistic commute time and amenity access for the typical tenant pool here? Any planned neighborhood developments (good or bad) we should know about?
- What's the average days-on-market for RENTAL listings here right now (not sales)? A rising rental-DOM trend means longer vacancies and softer asking-rent achievability than the comps imply.
- What's the recent tenant-quality profile in this submarket — average credit score on applications, eviction rate, late-payment / NSF rate, and stable-employment percentage? A property-management company in the area should have these aggregated.
- How much new for-sale + rental construction is in the pipeline within 1–3 miles? Heavy new supply typically softens prices + rents 12–24 months out; constrained supply supports both.
Investment metrics
- 1% rule
- 0.81% ✗
- Cap rate
- 5.99%
- Cash-on-cash
- -1.08%
- DSCR
- 0.95
- GRM
- 10.3
CMA / ARV
- ARV (on-the-fly)
- $195,434
- Comps found
- 12
Show comp detail 12 sales within ~0.75 mi
| Address | Dist | Beds/Ba | Sqft | Sold | Price | $/sf | Match |
|---|---|---|---|---|---|---|---|
| 1102 Kirkwood Blvd | 0.48mi | 3/2.0 (+1) | 1,428 (+2%) | 0mo | $129,000 | $90 | 69 |
| 1709 Christie St | 0.35mi | 3/1.0 (+1) | 1,431 (+2%) | 7mo | $142,000 | $99 | 66 |
| 1 Parkwood Dr | 0.60mi | 2/2.5 | 1,448 (+3%) | 0mo | $181,000 | $125 | 65 |
| 2030 Esplanade Ave | 0.26mi | 3/2.0 (+1) | 1,263 (-10%) | 6mo | $175,000 | $139 | 61 |
| 1429 Jersey Ridge Rd | 0.59mi | 2/1.0 | 1,399 (-0%) | 11mo | $270,000 | $193 | 58 |
| 1220 College Ave | 0.52mi | 3/1.0 (+1) | 1,530 (+9%) | 0mo | $110,000 | $72 | 52 |
| 2321 Fulton Ave | 0.67mi | 3/1.5 (+1) | 1,488 (+6%) | 0mo | $312,000 | $210 | 52 |
| 2214 Grand Ave | 0.75mi | 3/1.5 (+1) | 1,338 (-5%) | 1mo | $136,000 | $102 | 49 |
| 2612 Carey Ave | 0.68mi | 2/2.0 | 1,306 (-7%) | 10mo | $176,000 | $135 | 48 |
| 2458 E Central Park Ave | 0.71mi | 3/2.0 (+1) | 1,308 (-7%) | 7mo | $215,000 | $164 | 45 |
| 2402 Middle Rd | 0.59mi | 3/2.0 (+1) | 1,576 (+12%) | 12mo | $230,000 | $146 | 37 |
| 2632 Elm St | 0.72mi | 3/1.5 (+1) | 1,248 (-11%) | 12mo | $243,500 | $195 | 30 |
Match score weights: distance 35% · size 25% · config 20% · recency 20%. Top-matched comps best support the ARV.
Projected returns pro-forma
-3.0% appreciation · 4.57% rent growth · sell at horizon
- IRR
- -16.4%
- Equity multiple
- 0.41×
- Total profit
- $-24,755
- Equity at exit
- $22,351
- IRR
- -5.7%
- Equity multiple
- 0.61×
- Total profit
- $-16,405
- Equity at exit
- $12,961
Cash invested: $41,972 (down + closing). Projections, not guarantees.
Landlord ↔ Tenant lean methodology
- Overall (STATE)
- 83 Strongly Landlord-Friendly
- State Iowa
- 83 Strongly Landlord-Friendly · R+6
- County
- — inherits STATE
- City
- — inherits STATE
ZIP-level market 52803
- Home prices YoY
- -34.5%
- Rents YoY
- 4.6%
- Active inventory
- 160
- Price-to-rent
- 10.3×
Monthly cashflow live
- Estimated rent
- $1,217 high interval (Pro) →
- Mortgage (P&I)
- −$786
- Tax from tax record
- −$151 /mo · $1,814/yr
- Insurance
- −$62
- HOA
- −$0
- Vacancy / Maint / Mgmt
- −$256
- Net cashflow
- $-38
Break-even live
UW: 25.0% down · 7.5% · 30yr · 1.5% tax · 5.0% vac · 8.0% maint · 8.0% mgmt
Financing live
Cash to close
- Down payment
- $37,475
- Closing costs
- $4,497
- Reserves months
- —
- Total cash needed
- —
Loan-product check · same deal, 3 products live
Conventional
25% down · 7.5% · 30yr
- Down + closing
- —
- Monthly P&I
- —
- Monthly cashflow
- —
- DSCR
- —
- Eligible?
- —
Personal DTI + credit; lowest rate.
DSCR
20% down · 8.5% · 30yr
- Down + closing
- —
- Monthly P&I
- —
- Monthly cashflow
- —
- DSCR
- —
- Eligible?
- —
No personal income docs; deal must DSCR.
Hard money
10% down · 12.0% · 12mo
- Down + closing
- —
- Monthly P&I
- —
- Monthly cashflow
- —
- DSCR
- —
- Eligible?
- —
Short-term bridge; refi at stabilization.
Rent comps 35 comps
| Address | Beds | Baths | Sqft | Rent | $/sqft | DOM | Units | Dist |
|---|---|---|---|---|---|---|---|---|
| 2220 E Lombard St Davenport, IA | 3.0 | 2.0 | 1500 | $1,620 | $1.08 | 43d | 1 | 0.41mi |
| 1017 E 13th St Unit 1017 Davenport, IA | 2.0 | 1.0 | 1335 | $950 | $0.71 | 21d | 1 | 0.64mi |
| 1301 Arlington Ave Unit 1305 Davenport, IA | 2.0 | 1.0 | 900 | $895 | $0.99 | 13d | 1 | 0.71mi |
| 1421 Grand Ave Unit 1 Davenport, IA | 2.0 | 1.0 | 1015 | $850 | $0.84 | 43d | 1 | 0.77mi |
| 1724 Farnam St Unit upper Davenport, IA | 1.0 | 1.0 | 985 | $725 | $0.74 | 21d | 1 | 0.84mi |
| 2209 Farnam St Unit 2211 Davenport, IA | 3.0 | 1.0 | 1138 | $1,050 | $0.92 | 21d | 1 | 0.86mi |
| 2224 Iowa St Davenport, IA | 2.0 | 1.0 | 1214 | $895 | $0.74 | 43d | 1 | 1.03mi |
| 2224 Iowa St Unit 2224 Davenport, IA | 2.0 | 1.0 | 1214 | $925 | $0.76 | 43d | 1 | 1.03mi |
| 317 Kirkwood Blvd Davenport, IA | 2.0 | 1.0 | 1300 | $950 | $0.73 | 43d | 1 | 1.03mi |
| 1812 Pershing Ave Unit 1 Davenport, IA | 3.0 | 1.0 | 1000 | $1,200 | $1.20 | 21d | 1 | 1.06mi |
| 201 E Locust St Unit Sw Davenport, IA | 2.0 | 1.0 | 1000 | $875 | $0.88 | 43d | 1 | 1.11mi |
| 736 Federal St Davenport, IA | 1.0–3.0 | 1.0–2.0 | 1186 | $1,559 | $1.31 | 21d | 1 | 1.14mi |
| 3403 Jersey Ridge Rd Davenport, IA | 3.0 | 1.0–1.5 | 750 | $958 | $1.28 | 13d | 14 | 1.22mi |
| 320 E 29th St Davenport, IA | 2.0 | 2.5 | 1450 | $1,750 | $1.21 | 43d | 1 | 1.22mi |
| 119 E 13th St Davenport, IA | 3.0 | 1.0 | 1728 | $1,495 | $0.87 | 43d | 1 | 1.23mi |
| 1421 N Main St #2 Davenport, IA | 3.0 | 1.0 | 1350 | $1,095 | $0.81 | 43d | 1 | 1.30mi |
| 2925 Dubuque St Unit 5N Davenport, IA | 2.0 | 2.0 | 895 | $825 | $0.92 | 13d | 1 | 1.30mi |
| 321 E 7th St Davenport, IA | 1.0–2.0 | 1.0 | 825 | $1,050 | $1.27 | 13d | 4 | 1.34mi |
| 3705 College Ave Davenport, IA | 2.0 | 1.0 | 800 | $1,095 | $1.37 | 13d | 7 | 1.37mi |
| 427 Iowa St Unit 1-C308 Davenport, IA | 2.0 | 1.5 | 950 | $1,354 | $1.43 | 43d | 1 | 1.39mi |
| 511 Pershing Ave Unit 202W Davenport, IA | 2.0 | 1.0 | 1201 | $1,601 | $1.33 | 43d | 1 | 1.42mi |
| 511 Pershing Ave Unit 301E Davenport, IA | 3.0 | 2.0 | 1429 | $2,126 | $1.49 | 43d | 1 | 1.42mi |
| 511 Pershing Ave Unit 407W Davenport, IA | 2.0 | 2.0 | 1175 | $1,568 | $1.33 | 43d | 1 | 1.42mi |
| 511 Pershing Ave Unit 102W Davenport, IA | 2.0 | 1.0 | 1173 | $1,506 | $1.28 | 43d | 1 | 1.42mi |
| 511 Pershing Ave Unit 402W Davenport, IA | 2.0 | 2.0 | 1106 | $1,478 | $1.34 | 43d | 1 | 1.42mi |
| 511 Pershing Ave Unit 106E Davenport, IA | 3.0 | 2.0 | 1349 | $1,996 | $1.48 | 43d | 1 | 1.42mi |
| 511 Pershing Ave Apt 602W Davenport, IA | 2.0 | 2.0 | 948 | $1,367 | $1.44 | 43d | 1 | 1.42mi |
| 511 Pershing Ave Unit 101W Davenport, IA | 2.0 | 1.0 | 1280 | $1,704 | $1.33 | 43d | 1 | 1.42mi |
| 511 Pershing Ave Unit 105E Davenport, IA | 2.0 | 2.0 | 1100 | $1,635 | $1.49 | 43d | 1 | 1.42mi |
| 511 Pershing Ave Unit 609W Davenport, IA | 2.0 | 1.0 | 912 | $1,317 | $1.44 | 43d | 1 | 1.42mi |
| 1615 1/2 N Ripley St Davenport, IA | 2.0 | 1.0 | 900 | $825 | $0.92 | 43d | 1 | 1.42mi |
| 1519 N Ripley St Davenport, IA | 2.0 | 1.0 | 1144 | $1,100 | $0.96 | 13d | 1 | 1.43mi |
| 427 Pershing Ave Davenport, IA | 3.0 | 2.0 | 1438 | $2,288 | $1.59 | 13d | 3 | 1.44mi |
| 2809 N Main St Davenport, IA | 3.0 | 1.5 | 1000 | $1,350 | $1.35 | 21d | 1 | 1.44mi |
| 1505 E 39th St Unit 2A Davenport, IA | 2.0 | 1.0 | 970 | $820 | $0.85 | 21d | 1 | 1.45mi |
Listing history 8 events
-
2026-04-29status Pending
-
2026-04-23$149,900 Active
-
2025-07-30soldstatus $75,000
-
2025-07-18soldstatus $75,000 561-char remark
Show marketing remark (561 chars)
No parking on Eastern Avenue. Park in rear. Access is in alley off E Locust Street. Turn into alley immediately before the Mercy One Genesis sign. Estate sale. Sold strictly AS IS. Good investment flip opportunity. Two bedrooms on main floor and potential 3rd bedroom in upper level. No heat or cool in upper level. Bath remodeled - walk-in shower, half bath in basement. Newer furnace & CAC. Enclosed front porch. Hardwood floors under carpet. Some replacement windows. Fenced yard. Washer/Dryer and stove remain but not warranted. Roof 2016
-
2025-07-18soldstatus $75,000 Closed 561-char remark
Show marketing remark (561 chars)
No parking on Eastern Avenue. Park in rear. Access is in alley off E Locust Street. Turn into alley immediately before the Mercy One Genesis sign. Estate sale. Sold strictly AS IS. Good investment flip opportunity. Two bedrooms on main floor and potential 3rd bedroom in upper level. No heat or cool in upper level. Bath remodeled - walk-in shower, half bath in basement. Newer furnace & CAC. Enclosed front porch. Hardwood floors under carpet. Some replacement windows. Fenced yard. Washer/Dryer and stove remain but not warranted. Roof 2016
-
2025-06-27status Pending 561-char remark
Show marketing remark (561 chars)
No parking on Eastern Avenue. Park in rear. Access is in alley off E Locust Street. Turn into alley immediately before the Mercy One Genesis sign. Estate sale. Sold strictly AS IS. Good investment flip opportunity. Two bedrooms on main floor and potential 3rd bedroom in upper level. No heat or cool in upper level. Bath remodeled - walk-in shower, half bath in basement. Newer furnace & CAC. Enclosed front porch. Hardwood floors under carpet. Some replacement windows. Fenced yard. Washer/Dryer and stove remain but not warranted. Roof 2016
-
2025-05-08$110,000 561-char remark
Show marketing remark (561 chars)
No parking on Eastern Avenue. Park in rear. Access is in alley off E Locust Street. Turn into alley immediately before the Mercy One Genesis sign. Estate sale. Sold strictly AS IS. Good investment flip opportunity. Two bedrooms on main floor and potential 3rd bedroom in upper level. No heat or cool in upper level. Bath remodeled - walk-in shower, half bath in basement. Newer furnace & CAC. Enclosed front porch. Hardwood floors under carpet. Some replacement windows. Fenced yard. Washer/Dryer and stove remain but not warranted. Roof 2016
-
2025-05-08$110,000 Active 561-char remark
Show marketing remark (561 chars)
No parking on Eastern Avenue. Park in rear. Access is in alley off E Locust Street. Turn into alley immediately before the Mercy One Genesis sign. Estate sale. Sold strictly AS IS. Good investment flip opportunity. Two bedrooms on main floor and potential 3rd bedroom in upper level. No heat or cool in upper level. Bath remodeled - walk-in shower, half bath in basement. Newer furnace & CAC. Enclosed front porch. Hardwood floors under carpet. Some replacement windows. Fenced yard. Washer/Dryer and stove remain but not warranted. Roof 2016
ⓘ Source: listings_history table (triggers on properties + properties_extension) + one-shot
backfill from property_details.listing_events for pre-trigger history.
Tax reassessment forecast IA · Partial reset (capped growth)
- Current annual tax
- $1,814 · $151/mo
- Projected year-2 tax
- $2,084 · $174/mo
- Expected delta
- +$270/yr (+$22/mo · 14.9%)
ⓘ Screening estimate from a state-policy table — verify with the county assessor before closing.
Climate risk First Street
- Flood 1/10 Low FEMA zone X (unshaded) · 0% chance over 30 yrs
- Wildfire 1/10 Low
- Heat 3/10 Moderate 7 d/yr ≥103°F today · 16 d/yr by 30 yrs out
- Wind 2/10 Low
- Air quality 3/10 Moderate 2 unhealthy d/yr today · 3 by 30 yrs out
Nearby sold comps map
Loading sold comps map…
Walkable amenities ~0.75 mi
Loading nearby amenities…
Taxation est. · year 1
- Rental income
- $14,610
- − Mortgage interest
- −$8,397
- − Property taxes
- −$1,814
- − Insurance
- −$750
- − Repairs & maintenance
- −$1,169
- − Management
- −$1,169
- − Depreciation
- −$4,361
- Taxable loss
- −$3,049
- Est. tax savings @ 24.0%
- +$732
- After-tax cash flow
- $277/yr
For passive investors: Depreciation is non-cash, so a rental often shows a tax loss while cash-flowing — sheltering income. Rental losses are passive: they offset passive income freely, and up to $25,000/yr can offset ordinary (W-2) income if you actively participate and your MAGI is under $100k (phasing out to $0 by $150k); unused losses carry forward. On sale, claimed depreciation is recaptured at up to 25%, and gains may owe capital-gains tax (a 1031 exchange can defer both). Figures are a year-1 estimate at your 24.0% rate — not tax advice; consult a CPA.
Schools (NCES district)
- District
- Davenport Community School District
- NCES district ID
- 1908580
- Math proficiency
- 43% ▼ -11.00%
- Reading proficiency
- 50% ▼ -3.00%
- Median HH income
- $46,157
- Composite
- 39.49/100
- National rank
- #3951
- State rank
- #288 of 289 in IA
Livability — Davenport
- Score
- 79/100
- State rank
- #126
- US rank
- #2312
Category grades
Schools grade is shown separately in the Schools card above.
Census & demographics
- Census place
- Davenport, IA
- County
- Scott County · 144,583 people
- City population
- 103,319
- Metro
- Davenport-Moline-Rock Island, IA-IL
- Population (ZIP)
- 22,742
- Household income
- $64,543
- Rent vs Own
- Severe rent burden
- 630.0
Population outlook (Scott County) Hauer SSP2
- Today (2025)
- 188,878 people
- By 2030
- 196,648 · +4.1%
- By 2040
- 210,860 · +11.6%
- By 2050
- 224,359 · +18.8%
- By 2075
- 258,884 · +37.1%
- By 2100
- 286,447 · +51.7%
Race, ethnicity, and origin ACS 2023
- Neighborhood character
- Predominantly White (69%)
- Race & ethnicity
- White 69% Black 14% Two or more races 10% Hispanic / Latino 9%
- Hispanic origin (detail)
- Mexican 7%
- Common ancestry
- Romanian 2% Portuguese 2% Iranian 2%
- Foreign-born
- 5% · Canada, United Kingdom, South Korea
- Languages at home
- 93% English-only · Spanish 4% French/Haitian/Cajun 1%
Political lean MEDSL · Scott
- 2024 margin
- Toss-up / Even · D 47.3% · R 51.2% · Other 1.4%
- 2008→2024 swing
- -18.4pp toward R · 2008: 14.6pp · 2024: -3.9pp
- All cycles
- 2024: R+3.9 2020: D+3.5 2016: D+1.4 2012: D+13.8 2008: D+14.6
Not yet ingested
- Civics
- —
Market trends
- HPI YoY
- ▼ -96.00%
- Current HPI
- 182.0976
- Rent YoY
- ▲ 4.57%
- Metro
- Davenport-Moline-Rock Island, IA-IL
- State GDP YoY
- ▲ 2.48%
- F500 in state
- 4
Industry mix (Fortune 500 HQ in IA)
| Industry | F500 HQs | Revenue |
|---|---|---|
| Financial Services | 1 | $16B |
|
||
| Retail / Convenience | 1 | $15B |
|
||
Price history
+36.3% since first listed8 events — show timeline
- 2026-04-29 Pending — MRED as Distributed by MLS Grid
- 2026-04-23 Listed $149,900 MRED as Distributed by MLS Grid
- 2025-07-30 Sold (Public Records) $75,000 Public Records
- 2025-07-18 Sold (MLS) $75,000 RMLSA as Distributed by MLS Grid
- 2025-07-18 Sold (MLS) $75,000 MRED as Distributed by MLS Grid
- 2025-06-27 Pending — RMLSA as Distributed by MLS Grid
- 2025-05-08 Listed $110,000 RMLSA as Distributed by MLS Grid
- 2025-05-08 Listed $110,000 MRED as Distributed by MLS Grid
Property tax history
+1.3%/yrLatest (2025): $1,814 · +2.7% YoY. Source: county tax records.
Cash-flow waterfall
monthlySold comps — $/sqft
last 12 mo · ≤1 miLoading sold comps…