 Multi-family
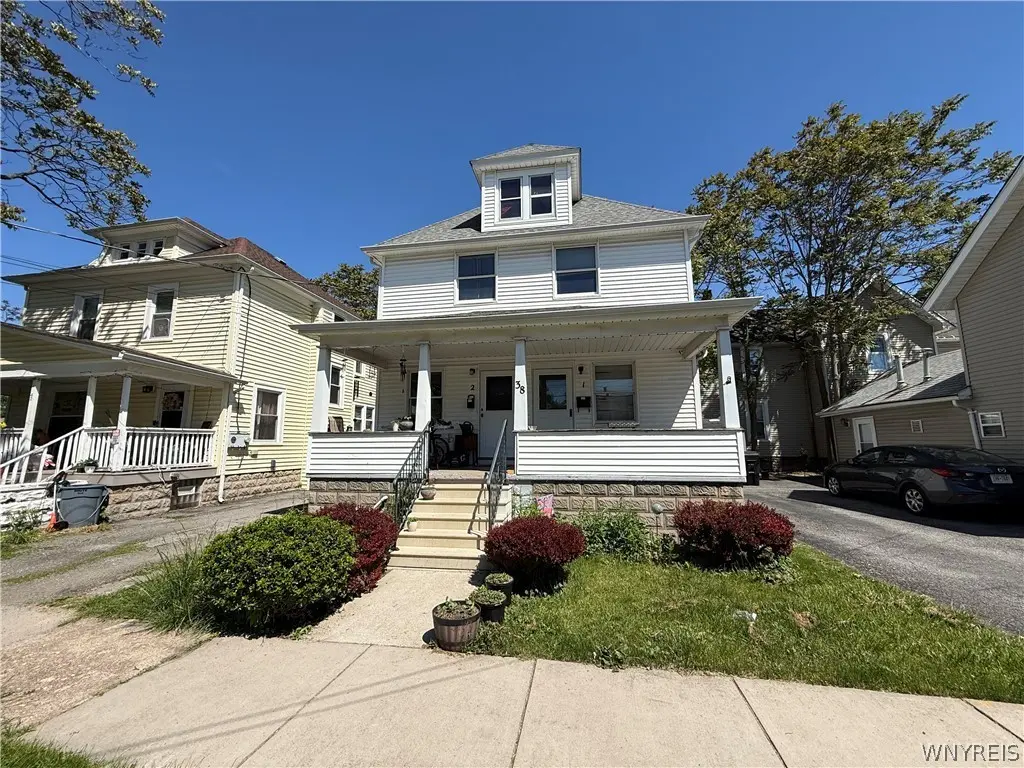
38 Morgan St · Tonawanda, NY
Flood risk 1/10 · Minimal
- FEMA flood zone
- X (unshaded)
- Chance of flooding over 30 yrs
- 0.0%
- Est. flood insurance / yr
- $473 – $860
Fire risk 1/10 · Minimal
- Est. fire insurance / yr
- $691 – $1,283
Heat risk 3/10 · Minor
- Hot days now (above 93°F)
- 7 days/yr
- Hot days in 30 yrs
- 15 days/yr
Wind risk 1/10 · Minimal
- Chance of severe wind over 30 yrs
- —
Air-quality risk 3/10 · Minor
- Unhealthy air days now
- 3 days/yr
- Unhealthy air days in 30 yrs
- 4 days/yr
Risk factors via First Street. Map © Google.
Why this score? — see what drove the B+ grade
The composite is a weighted blend of 9 inputs, each scored 0–100. Each bar is that input's sub-score; the figure is the points it added to the 100-point composite (weight × sub-score).
- Cash flow +30.0/30.0
- ARV discount +11.5/15.0
- 1% rule +10.0/10.0
- DSCR +10.0/10.0
- Livability +4.5/5.0
- Rent growth +4.2/5.0
- Schools +3.5/10.0
- Condition / age +2.5/5.0
- Appreciation +0.0/10.0
$189,900
🖨 Deal sheet 📄 Offer letter ✓ Due diligence
Multi-family units
County records classify this as Multi-Family (2-4 Unit). Listing-text estimate: 1 unit. estimate disagrees with records
Listing remarks
Discover the potential of 38 Morgan St. , a versatile and income-generating multi-unit property perfect for both owner-occupants and investors. This well-maintained property features three distinct units: one spacious two-bedroom apartment and two charming one-bedroom apartments, offering a variety of living arrangements for tenants or owners. The property is equipped with modern amenities, including vinyl siding, newer electrical panels, and a recently updated boiler, ensuring efficiency and low maintenance. A full basement provides ample storage space or potential for future enhancements. With convenient parking available, residents will enjoy easy access to their homes. Currently generat
Key facts
- Full basement
- Modern amenities
- Vinyl siding
Tags
Neighborhood map
What this means for you Summary
Snapshot
- This is a 4-bed/3.0-bath multifamily listed at $190k.
Deal economics
- At list price, monthly cash flow is $2k ($20k/yr) — positive.
- The deal already cash-flows at list — no discount required.
- Meets the 1% rule at list price ($4k rent vs $190k).
Location & tenants
- Location reads 89/100 on livability (#8 in NY, #169 nationally) — a professional / high-income tenant draw. Strengths: amenities A+, commute A+, cost of living A+.
- Tonawanda City School District (suburban): math 39% / reading 43% proficiency, ranked #508 of 590 in NY (top 86%) — families likely to look elsewhere, expect single-tenant / working-renter base with shorter leases.
- Market conditions: Rents rising fast (+6.8%/yr); 191 active listings in the ZIP; 2 comparable units currently listed for rent nearby; 1,244 units permitted in Erie County in 2024 (563 in 5+ unit buildings).
- At $3,768/mo this rent would consume 63% of the median local household income ($71k/yr) (locally 1427% of renters already pay >50% of income on rent) — very limited rent-growth headroom before tenants either downsize or default.
Forward outlook
- Local home prices are declining (-3.0%/yr); year-one equity from $1k of loan paydown is wiped out by about $6k of value loss. Plan a longer hold.
- At projected returns (-3.0% appreciation + 6.8% rent growth), your $53k cash investment doubles in ~3 years — after that, you're playing with house money.
Negotiation context
- Only 6 days on market — expect competitive offers; lowballing is unlikely to land.
- 6 sale attempts since 2y ago with the ask held roughly flat each time — persistent listings suggest the price (not the market) is what's stuck; bring a comps-based counter.
Risks & watch-outs
- Watch-outs: built in 1910 — expect roof / HVAC / electrical / plumbing capex.
Questions for the listing agent
- Built in 1910 — when were the roof, HVAC, electrical panel, plumbing, and water heater last replaced?
- Is there a deadline driving the sale (1031 exchange, divorce, estate, relocation)? That informs how much negotiation room exists.
- Schools are B-rated — typically a magnet for longer-tenancy family renters. What's the average tenant stay here, and is there a school-zone premium baked into asking?
- What's the average days-on-market for RENTAL listings here right now (not sales)? A rising rental-DOM trend means longer vacancies and softer asking-rent achievability than the comps imply.
- What's the recent tenant-quality profile in this submarket — average credit score on applications, eviction rate, late-payment / NSF rate, and stable-employment percentage? A property-management company in the area should have these aggregated.
- How much new apartment / multifamily construction is in the pipeline within 1–3 miles? Heavy new supply (>2% of stock underway) typically softens rents 12–24 months out; light construction supports rent growth.
Investment metrics
- 1% rule
- 1.98% ✓
- Cap rate
- 16.94%
- Cash-on-cash
- 38.04%
- DSCR
- 2.69
- GRM
- 4.2
CMA / ARV
- ARV (on-the-fly)
- $208,488
- Comps found
- 3
Show comp detail 3 sales within ~0.75 mi
| Address | Dist | Beds/Ba | Sqft | Sold | Price | $/sf | Match |
|---|---|---|---|---|---|---|---|
| 28 Lincoln Ave | 0.69mi | 4/2.0 | 2,228 (+9%) | 4mo | $215,000 | $96 | 46 |
| 182 Payne Ave | 0.74mi | 3/2.0 (-1) | 1,956 (-4%) | 17mo | $200,000 | $102 | 35 |
| 158 Christiana St | 0.73mi | 5/2.0 (+1) | 2,240 (+10%) | 13mo | $247,200 | $110 | 30 |
Match score weights: distance 35% · size 25% · config 20% · recency 20%. Top-matched comps best support the ARV.
Projected returns pro-forma
-3.0% appreciation · 6.75% rent growth · sell at horizon
- IRR
- 38.3%
- Equity multiple
- 2.72×
- Total profit
- $91,374
- Equity at exit
- $28,315
- IRR
- 46.6%
- Equity multiple
- 6.33×
- Total profit
- $283,375
- Equity at exit
- $16,419
Cash invested: $53,172 (down + closing). Projections, not guarantees.
Landlord ↔ Tenant lean methodology
- Overall (STATE)
- 15 Strongly Tenant-Friendly
- State New York
- 15 Strongly Tenant-Friendly · D+10
- County
- — inherits STATE
- City
- — inherits STATE
ZIP-level market 14150
- Rents YoY
- 6.8%
- Active inventory
- 191
- Price-to-rent
- 11.6×
Monthly cashflow live
- Estimated rent
- $3,768 medium interval (Pro) →
- Mortgage (P&I)
- −$996
- Tax from tax record
- −$216 /mo · $2,595/yr
- Insurance
- −$79
- HOA
- −$0
- Vacancy / Maint / Mgmt
- −$791
- Net cashflow
- $1,685
Break-even live
3-unit breakdown (identical units grouped — click to expand)
| Units | Beds | Baths | Est. rent |
|---|---|---|---|
| 1× unit | 2 | 1 | $1,361 |
| 2× units | 1 | 1 | $2,406 |
| #2 | 1 | 1 | $1,203 |
| #3 | 1 | 1 | $1,203 |
| Total (3 units) | $3,768 | ||
UW: 25.0% down · 7.5% · 30yr · 1.5% tax · 5.0% vac · 8.0% maint · 8.0% mgmt
Financing live
Cash to close
- Down payment
- $47,475
- Closing costs
- $5,697
- Reserves months
- —
- Total cash needed
- —
Loan-product check · same deal, 3 products live
Conventional
25% down · 7.5% · 30yr
- Down + closing
- —
- Monthly P&I
- —
- Monthly cashflow
- —
- DSCR
- —
- Eligible?
- —
Personal DTI + credit; lowest rate.
DSCR
20% down · 8.5% · 30yr
- Down + closing
- —
- Monthly P&I
- —
- Monthly cashflow
- —
- DSCR
- —
- Eligible?
- —
No personal income docs; deal must DSCR.
Hard money
10% down · 12.0% · 12mo
- Down + closing
- —
- Monthly P&I
- —
- Monthly cashflow
- —
- DSCR
- —
- Eligible?
- —
Short-term bridge; refi at stabilization.
Rent comps 2 comps
| Address | Beds | Baths | Sqft | Rent | $/sqft | DOM | Units | Dist |
|---|---|---|---|---|---|---|---|---|
| 203 Highland Ave Tonawanda, NY | 3.0 | 1.0 | 2288 | $1,800 | $0.79 | 3d | 1 | 1.03mi |
| 600 River Rd North Tonawanda, NY | 1.0–3.0 | 1.0–2.5 | 1320 | $4,995 | $3.78 | 1d | 12 | 1.30mi |
Listing history 19 events
-
2026-06-08statusdays on market $189,900 Pending 6 DOM
-
2026-06-07days on market $189,900 Active 5 DOM
-
2026-06-05days on market $189,900 Active 2 DOM
-
2026-06-02statusdays on market $189,900 Active 1 DOM
-
2026-01-02status Pending
-
2025-12-19historical Active Under Contract
-
2025-12-09$189,900 Active
-
2025-05-31historical $825
-
2025-05-31$825
-
2025-05-01historical $850
-
2025-04-30$850
-
2025-02-26historical $800
-
2025-02-08price $800
-
2025-01-18price $825
-
2025-01-17historical $825
-
2025-01-17$825
-
2024-12-21$850
-
2024-12-21historical $850
-
2024-12-21$850
ⓘ Source: listings_history table (triggers on properties + properties_extension) + one-shot
backfill from property_details.listing_events for pre-trigger history.
Tax reassessment forecast NY · Partial reset (capped growth)
- Current annual tax
- $2,595 · $216/mo
- Projected year-2 tax
- $2,902 · $242/mo
- Expected delta
- +$307/yr (+$26/mo · 11.8%)
ⓘ Screening estimate from a state-policy table — verify with the county assessor before closing.
Climate risk First Street
- Flood 1/10 Low FEMA zone X (unshaded) · 0% chance over 30 yrs
- Wildfire 1/10 Low
- Heat 3/10 Moderate 7 d/yr ≥93°F today · 15 d/yr by 30 yrs out
- Wind 1/10 Low
- Air quality 3/10 Moderate 3 unhealthy d/yr today · 4 by 30 yrs out
Nearby sold comps map
Loading sold comps map…
Walkable amenities ~0.75 mi
Loading nearby amenities…
Taxation est. · year 1
- Rental income
- $45,216
- − Mortgage interest
- −$10,637
- − Property taxes
- −$2,595
- − Insurance
- −$950
- − Repairs & maintenance
- −$3,617
- − Management
- −$3,617
- − Depreciation
- −$5,524
- Taxable income
- $18,275
- Est. tax owed @ 24.0%
- −$4,386
- After-tax cash flow
- $15,840/yr
For passive investors: Depreciation is non-cash, so a rental often shows a tax loss while cash-flowing — sheltering income. Rental losses are passive: they offset passive income freely, and up to $25,000/yr can offset ordinary (W-2) income if you actively participate and your MAGI is under $100k (phasing out to $0 by $150k); unused losses carry forward. On sale, claimed depreciation is recaptured at up to 25%, and gains may owe capital-gains tax (a 1031 exchange can defer both). Figures are a year-1 estimate at your 24.0% rate — not tax advice; consult a CPA.
Schools (NCES district)
- District
- Tonawanda City School District
- NCES district ID
- 3628740
- Math proficiency
- 39% ▼ -19.00%
- Reading proficiency
- 43% ▼ -7.00%
- Median HH income
- $47,061
- Composite
- 35.03/100
- National rank
- #5041
- State rank
- #508 of 590 in NY
Livability — Tonawanda
- Score
- 89/100
- State rank
- #8
- US rank
- #169
Category grades
Schools grade is shown separately in the Schools card above.
Census & demographics
- Census place
- Tonawanda, NY
- County
- Erie County · 714,559 people
- City population
- 41,260
- Metro
- Buffalo-Cheektowaga, NY
- Population (ZIP)
- 41,260
- Household income
- $71,406
- Rent vs Own
- Severe rent burden
- 1427.0
Population outlook (Erie County) Hauer SSP2
- Today (2025)
- 933,037 people
- By 2030
- 935,181 · +0.2%
- By 2040
- 928,531 · -0.5%
- By 2050
- 905,725 · -2.9%
- By 2075
- 834,037 · -10.6%
- By 2100
- 708,033 · -24.1%
Race, ethnicity, and origin ACS 2023
- Neighborhood character
- Predominantly White (87%)
- Race & ethnicity
- White 87% Two or more races 5% Hispanic / Latino 5% Black 4% Asian 2%
- Common ancestry
- Romanian 13% Lithuanian 3% Slovak 2%
- Foreign-born
- 6% · Canada, Philippines, Vietnam
- Languages at home
- 94% English-only · Other Indo-European 2% Spanish 1% Russian/Polish/Slavic 1%
Political lean MEDSL · Erie
- 2024 margin
- Lean D (+9.7) · D 54.8% · R 45.2%
- 2008→2024 swing
- -7.9pp toward R · 2008: 17.5pp · 2024: 9.7pp
- All cycles
- 2024: D+9.7 2020: D+14.7 2016: D+4.8 2012: D+15.6 2008: D+17.5
Not yet ingested
- Civics
- —
Market trends
- HPI YoY
- ▼ -260.43%
- Current HPI
- 334.5893
- Rent YoY
- ▲ 6.75%
- Metro
- Buffalo-Cheektowaga, NY
- State GDP YoY
- ▲ 2.60%
- F500 in state
- 92
Industry mix (Fortune 500 HQ in NY)
| Industry | F500 HQs | Revenue |
|---|---|---|
| Financial Services | 10 | $950B |
|
||
| Consumer Goods | 9 | $162B |
|
||
| Insurance | 4 | $225B |
|
||
| Telecommunications | 2 | $144B |
|
||
| Pharmaceuticals | 2 | $112B |
|
||
| Media / Entertainment | 2 | $69B |
|
||
Price history
15 events — show timeline
- 2026-01-02 Pending — WNYREIS
- 2025-12-19 Contingent — WNYREIS
- 2025-12-09 Listed $189,900 WNYREIS
- 2025-05-31 Rental Removed $825 PROPERTYWARE
- 2025-05-31 Listed for Rent $825 PROPERTYWARE
- 2025-05-01 Rental Removed $850 PROPERTYWARE
- 2025-04-30 Listed for Rent $850 PROPERTYWARE
- 2025-02-26 Rental Removed $800 PROPERTYWARE
- 2025-02-08 Price Changed $800 PROPERTYWARE
- 2025-01-18 Price Changed $825 PROPERTYWARE
- 2025-01-17 Rental Removed $825 SHOWMOJO
- 2025-01-17 Listed for Rent $825 SHOWMOJO
- 2024-12-21 Listed for Rent $850 PROPERTYWARE
- 2024-12-21 Rental Removed $850 SHOWMOJO
- 2024-12-21 Listed for Rent $850 SHOWMOJO
Property tax history
+4.3%/yrLatest (2025): $2,595 · +2.8% YoY. Source: county tax records.
Cash-flow waterfall
monthlySold comps — $/sqft
last 12 mo · ≤1 miLoading sold comps…