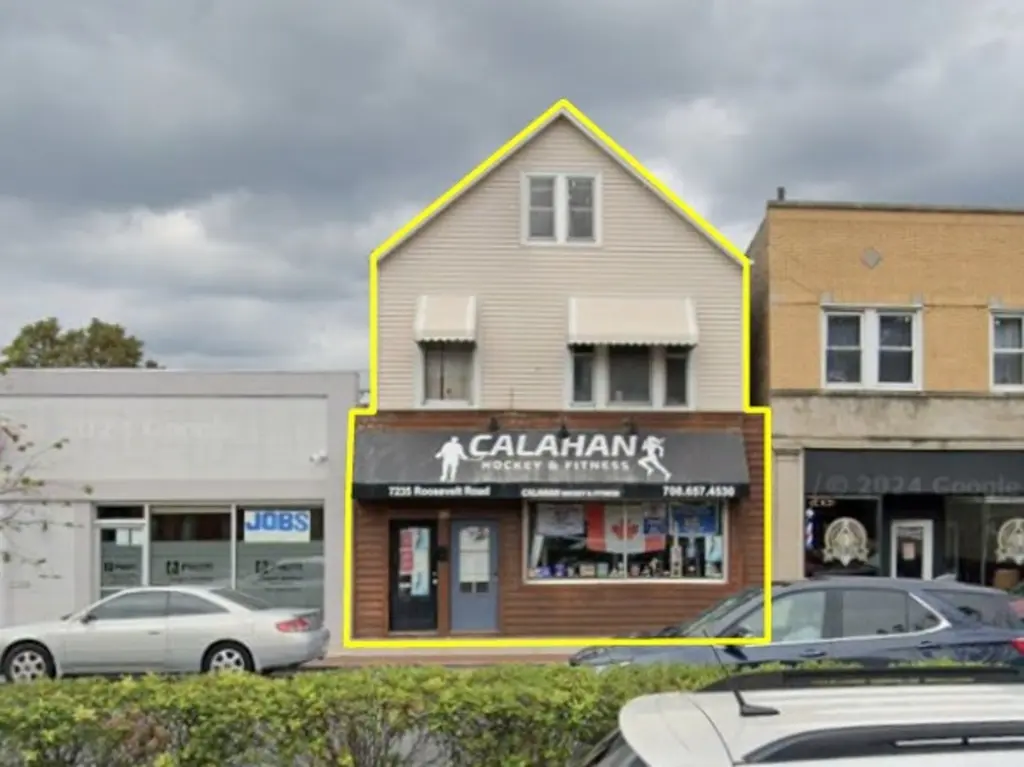
7235 Roosevelt Rd · Forest Park, IL
Flood risk 3/10 · Minor
- FEMA flood zone
- X (unshaded)
- Chance of flooding over 30 yrs
- 0.2%
- Est. flood insurance / yr
- $473 – $860
Fire risk 1/10 · Minimal
- Est. fire insurance / yr
- $804 – $1,492
Heat risk 3/10 · Minor
- Hot days now (above 100°F)
- 7 days/yr
- Hot days in 30 yrs
- 14 days/yr
Wind risk 2/10 · Minimal
- Chance of severe wind over 30 yrs
- 1.0%
Air-quality risk 5/10 · Moderate
- Unhealthy air days now
- 6 days/yr
- Unhealthy air days in 30 yrs
- 8 days/yr
Risk factors via First Street. Map © Google.
Why this score? — see what drove the D grade
The composite is a weighted blend of 9 inputs, each scored 0–100. Each bar is that input's sub-score; the figure is the points it added to the 100-point composite (weight × sub-score).
- Cash flow +15.4/30.0
- ARV discount +7.5/15.0
- 1% rule +5.5/10.0
- DSCR +4.7/10.0
- Livability +4.3/5.0
- Rent growth +3.2/5.0
- Condition / age +2.5/5.0
- Schools +1.4/10.0
- Appreciation +0.0/10.0
$249,000
🖨 Deal sheet 📄 Offer letter ✓ Due diligence
Listing remarks
Great opportunity for any business owner! Vacant mixed-use building with 2-bedroom apartment and 1,100 SF store. Located on busy Roosevelt Road with traffic count of 23,700 vehicles per day. The upstairs 2-bedroom apartment includes a den, with living room, formal dining room, and large kitchen, as well as unique and original woodwork details. Nearby businesses along Roosevelt Road include Walgreens, Shell, Jewel-Osco, McDonald's, Culvers, Walmart, Planet Fitness and much more. Population of 266,125 within 2 miles with 93,067 households and average household income of $107K.
Key facts
- Nearby businesses
- 3,125 sq ft lot
- Built 1909
Tags
Property features AI
Finance
- Other: Two-unit building; Sole proprietor ownership
Exterior
- Parking: Common outdoor parking; Indoor parking with 1–5 spaces
- Utilities: Electric with circuit breakers and separate meters (service 0–100 amps); Natural gas available; Water available; Sewer connected; Electric to site
- Home design: Mixed-use property; Located on Roosevelt Road, 1 block west of Harlem Avenue
- Construction: Built before 1978; Stone and vinyl siding exterior; Composition roof with gable structure; Block foundation
- Exterior features: 25 x 125 lot dimensions; Frontage on a state road; Zoned RTAIL (retail)
Interior
- Kitchen: One range/stove
- Flooring: Vinyl; Wood
- Heating & cooling: Central building heat (radiators); Window unit(s) for cooling
- Interior features: Vinyl and wood flooring; Central building heat with radiators; Window air conditioning units
- Laundry & utility: Washer/dryer not leased (no)
Neighborhood map
What this means for you Summary
Snapshot
- This is a 4-bed/1.5-bath condo listed at $249k.
Deal economics
- At list price, monthly cash flow is $96 ($1k/yr) — positive.
- The deal already cash-flows at list — no discount required.
- Meets the 1% rule at list price ($3k rent vs $249k).
- Recommended offer: $245k (1.5% below list) — sets the bar for market timing.
- Cap rate 6.8% vs local median 3.1% in Forest Park — top-decile yield for the area; either an underpriced asset or a hidden risk that comps aren't pricing in. Stress-test before assuming the spread holds.
Location & tenants
- Location reads 86/100 on livability (#20 in IL, #405 nationally) — a professional / high-income tenant draw. Strengths: amenities A+, commute A+, housing A+; Watch: crime F.
- Proviso Twp Hsd 209 (suburban): math 12% / reading 17% proficiency, ranked #507 of 620 in IL (top 82%) — low school quality limits family demand, transient renter base, plan for 1-2y turnover.
- Market conditions: Rents rising (+2.8%/yr); 48 active listings in the ZIP; 12 comparable units currently listed for rent nearby; rentals leasing fast (median 10d on market — plan ~1-2 weeks tenant-placement turnaround); solid renter incomes; 6,272 units permitted in Cook County in 2024 (4,658 in 5+ unit buildings).
- This rent runs 41% of the median local income ($77k/yr) — at the standard rent-burdened threshold; future hikes will face affordability resistance.
Forward outlook
- Local home prices are declining (-3.0%/yr); year-one equity from $2k of loan paydown is wiped out by about $7k of value loss. Plan a longer hold.
Negotiation context
- It's been on market 23 days — a 2% lower offer ($245k) is reasonable based on typical stale-listing flexibility.
- 2 sale attempts with the ask held roughly flat each time — persistent listings suggest the price (not the market) is what's stuck; bring a comps-based counter.
- Current owner paid $150k; list at $249k implies a 66% gain — meaningful room to come down on a strong offer.
Risks & watch-outs
- Watch-outs: property tax is 2.7% of price; built in 1909 — expect roof / HVAC / electrical / plumbing capex.
Questions for the listing agent
- Built in 1909 — when were the roof, HVAC, electrical panel, plumbing, and water heater last replaced?
- Property tax is high relative to price — has the assessment been appealed recently, and will the sale trigger a re-assessment?
- Any open or pending special assessments — roof, HVAC, plumbing, elevator, façade? What's the per-unit balance and payoff schedule, and is the seller paying it off at close or rolling it to the buyer?
- Is there a deadline driving the sale (1031 exchange, divorce, estate, relocation)? That informs how much negotiation room exists.
- Crime grade is F in this area — have there been break-ins, vandalism, or insurance claims at this property in the last 3 years? What carrier currently insures it and at what premium?
- The area grade is low — what's the realistic commute time and amenity access for the typical tenant pool here? Any planned neighborhood developments (good or bad) we should know about?
- What's the average days-on-market for RENTAL listings here right now (not sales)? A rising rental-DOM trend means longer vacancies and softer asking-rent achievability than the comps imply.
- What's the recent tenant-quality profile in this submarket — average credit score on applications, eviction rate, late-payment / NSF rate, and stable-employment percentage? A property-management company in the area should have these aggregated.
- How much new apartment / multifamily construction is in the pipeline within 1–3 miles? Heavy new supply (>2% of stock underway) typically softens rents 12–24 months out; light construction supports rent growth.
Investment metrics
- 1% rule
- 1.05% ✓
- Cap rate
- 6.76%
- Cash-on-cash
- 1.65%
- DSCR
- 1.07
- GRM
- 7.9
CMA / ARV
No comps found within radius.
Projected returns pro-forma
-3.0% appreciation · 2.76% rent growth · sell at horizon
- IRR
- -13.9%
- Equity multiple
- 0.50×
- Total profit
- $-34,663
- Equity at exit
- $37,127
- IRR
- -5.4%
- Equity multiple
- 0.65×
- Total profit
- $-24,082
- Equity at exit
- $21,529
Cash invested: $69,720 (down + closing). Projections, not guarantees.
Landlord ↔ Tenant lean methodology
- Overall (STATE)
- 43 Moderately Tenant-Leaning
- State Illinois
- 43 Moderately Tenant-Leaning · D+7
- County
- — inherits STATE
- City
- — inherits STATE
ZIP-level market 60130
- Rents YoY
- 2.8%
- Active inventory
- 48
- Price-to-rent
- 7.9×
Monthly cashflow live
- Estimated rent
- $2,627 high interval (Pro) →
- Mortgage (P&I)
- −$1,306
- Tax from tax record
- −$570 /mo · $6,836/yr
- Insurance
- −$104
- HOA
- −$0
- Vacancy / Maint / Mgmt
- −$552
- Net cashflow
- $96
Break-even live
UW: 25.0% down · 7.5% · 30yr · 1.5% tax · 5.0% vac · 8.0% maint · 8.0% mgmt
Financing live
Cash to close
- Down payment
- $62,250
- Closing costs
- $7,470
- Reserves months
- —
- Total cash needed
- —
Loan-product check · same deal, 3 products live
Conventional
25% down · 7.5% · 30yr
- Down + closing
- —
- Monthly P&I
- —
- Monthly cashflow
- —
- DSCR
- —
- Eligible?
- —
Personal DTI + credit; lowest rate.
DSCR
20% down · 8.5% · 30yr
- Down + closing
- —
- Monthly P&I
- —
- Monthly cashflow
- —
- DSCR
- —
- Eligible?
- —
No personal income docs; deal must DSCR.
Hard money
10% down · 12.0% · 12mo
- Down + closing
- —
- Monthly P&I
- —
- Monthly cashflow
- —
- DSCR
- —
- Eligible?
- —
Short-term bridge; refi at stabilization.
Rent comps 12 comps
| Address | Beds | Baths | Sqft | Rent | $/sqft | DOM | Units | Dist |
|---|---|---|---|---|---|---|---|---|
| 946 Beloit Ave Forest Park, IL | 3.0 | 2.5 | 2300 | $4,000 | $1.74 | 10d | 1 | 0.37mi |
| 1515 Maple Ave Unit 1 Berwyn, IL | 3.0 | 1.0 | 1400 | $1,995 | $1.43 | 24d | 1 | 0.46mi |
| 1056 Des Plaines Ave Forest Park, IL | 3.0 | 1.5 | 1450 | $2,295 | $1.58 | 7d | 1 | 0.64mi |
| 1628 Euclid Ave Unit 1 Berwyn, IL | 3.0 | 1.0 | 1500 | $2,100 | $1.40 | 24d | 1 | 0.89mi |
| 1801 S Oak Park Ave Unit 1 Berwyn, IL | 3.0 | 1.0 | 1304 | $2,300 | $1.76 | 5d | 1 | 0.91mi |
| 1845 S Oak Park Ave Unit 2 Berwyn, IL | 3.0 | 1.0 | 1322 | $1,650 | $1.25 | 24d | 1 | 0.99mi |
| 1447 Cuyler Ave Berwyn, IL | 3.0 | 1.5 | 1400 | $2,900 | $2.07 | 3d | 1 | 1.27mi |
| 1220 S Lombard Ave Unit 2 Berwyn, IL | 3.0 | 1.0 | 1300 | $1,650 | $1.27 | 24d | 1 | 1.38mi |
| 1105 Pleasant St Oak Park, IL | 3.0 | 1.0–2.0 | 1410 | $7,015 | $4.97 | 1d | 10 | 1.40mi |
| 7307 Franklin St Forest Park, IL | 3.0 | 3.0 | 2400 | $3,400 | $1.42 | 24d | 1 | 1.42mi |
| 2036 S 1st Ave Maywood, IL | 4.0 | 2.0 | 1363 | $2,750 | $2.02 | 1d | 1 | 1.44mi |
| 1133 South Blvd Oak Park, IL | 3.0 | 1.0–2.0 | 1042 | $6,240 | $5.99 | 1d | 8 | 1.49mi |
HOA detail condo
- Monthly dues
- $0 · $0/yr
- Assessments
- None detected in remarks — confirm with the listing agent.
Listing history 19 events
-
2026-06-18days on market $249,000 Active 23 DOM
-
2026-06-17days on market $249,000 Active 22 DOM
-
2026-06-16days on market $249,000 Active 21 DOM
-
2026-06-15days on market $249,000 Active 20 DOM
-
2026-06-13days on market $249,000 Active 18 DOM
-
2026-06-13days on market $249,000 Active 17 DOM
-
2026-06-09days on market $249,000 Active 14 DOM
-
2026-06-08days on market $249,000 Active 13 DOM
-
2026-06-07days on market $249,000 Active 12 DOM
-
2026-06-04days on market $249,000 Active 9 DOM
-
2026-06-03days on market $249,000 Active 8 DOM
-
2026-06-02days on market $249,000 Active 7 DOM
-
2026-06-01days on market $249,000 Active 6 DOM
-
2026-05-31days on market $249,000 Active 5 DOM
-
2026-05-26$249,000 Active
-
2026-05-20historical
-
2026-05-18price
-
2026-03-20Active
-
2015-04-07soldstatus $150,000
ⓘ Source: listings_history table (triggers on properties + properties_extension) + one-shot
backfill from property_details.listing_events for pre-trigger history.
Tax reassessment forecast IL · Partial reset (capped growth)
- Current annual tax
- $6,836 · $570/mo
- Projected year-2 tax
- $6,836 · $570/mo
- Expected delta
- $0/yr ($0/mo · 0.0%)
ⓘ Screening estimate from a state-policy table — verify with the county assessor before closing.
Climate risk First Street
- Flood 3/10 Moderate FEMA zone X (unshaded) · 20% chance over 30 yrs
- Wildfire 1/10 Low
- Heat 3/10 Moderate 7 d/yr ≥100°F today · 14 d/yr by 30 yrs out
- Wind 2/10 Low 100% chance of damaging wind over 30 yrs
- Air quality 5/10 Major 6 unhealthy d/yr today · 8 by 30 yrs out
Nearby sold comps map
Loading sold comps map…
Walkable amenities ~0.75 mi
Loading nearby amenities…
Taxation est. · year 1
- Rental income
- $31,523
- − Mortgage interest
- −$13,948
- − Property taxes
- −$6,836
- − Insurance
- −$1,245
- − Repairs & maintenance
- −$2,522
- − Management
- −$2,522
- − Depreciation
- −$7,244
- Taxable loss
- −$2,793
- Est. tax savings @ 24.0%
- +$670
- After-tax cash flow
- $1,823/yr
For passive investors: Depreciation is non-cash, so a rental often shows a tax loss while cash-flowing — sheltering income. Rental losses are passive: they offset passive income freely, and up to $25,000/yr can offset ordinary (W-2) income if you actively participate and your MAGI is under $100k (phasing out to $0 by $150k); unused losses carry forward. On sale, claimed depreciation is recaptured at up to 25%, and gains may owe capital-gains tax (a 1031 exchange can defer both). Figures are a year-1 estimate at your 24.0% rate — not tax advice; consult a CPA.
Schools (NCES district)
- District
- Proviso Twp Hsd 209
- NCES district ID
- 1732910
- Math proficiency
- 12% ▼ -4.00%
- Reading proficiency
- 17% ▼ -3.00%
- Median HH income
- $51,744
- Composite
- 13.5/100
- National rank
- #9518
- State rank
- #507 of 620 in IL
Livability — Forest Park
- Score
- 86/100
- State rank
- #20
- US rank
- #405
Category grades
Schools grade is shown separately in the Schools card above.
Census & demographics
- Census place
- Forest Park, IL
- County
- Cook County · 4,486,803 people
- City population
- 13,943
- Metro
- Chicago-Naperville-Elgin, IL-IN-WI
- Population (ZIP)
- 13,943
- Household income
- $77,221
- Rent vs Own
- Severe rent burden
- 650.0
Population outlook (Cook County) Hauer SSP2
- Today (2025)
- 5,347,519 people
- By 2030
- 5,357,703 · +0.2%
- By 2040
- 5,324,924 · -0.4%
- By 2050
- 5,230,762 · -2.2%
- By 2075
- 4,785,735 · -10.5%
- By 2100
- 4,188,836 · -21.7%
Race, ethnicity, and origin ACS 2023
- Neighborhood character
- Diverse neighborhood (Simpson 0.64)
- Race & ethnicity
- White 53% Black 25% Hispanic / Latino 11% Two or more races 7% Asian 7%
- Hispanic origin (detail)
- Mexican 6% Puerto Rican 2%
- Common ancestry
- Romanian 5% Lithuanian 3% Serbian 2%
- Foreign-born
- 9% · Canada
- Languages at home
- 85% English-only · Spanish 8% Other Asian/Pacific 2% Arabic 2%
Political lean MEDSL · Cook
- 2024 margin
- Solid D (+42.0) · D 70.4% · R 28.4% · Other 1.2%
- 2008→2024 swing
- -11.4pp toward R · 2008: 53.4pp · 2024: 42.0pp
- All cycles
- 2024: D+42.0 2020: D+50.3 2016: D+53.0 2012: D+49.4 2008: D+53.4
Not yet ingested
- Civics
- —
Market trends
- HPI YoY
- ▼ -192.60%
- Current HPI
- 292.8802
- Rent YoY
- ▲ 2.76%
- Metro
- Chicago-Naperville-Elgin, IL-IN-WI
- State GDP YoY
- ▲ 1.59%
- F500 in state
- 60
Industry mix (Fortune 500 HQ in IL)
| Industry | F500 HQs | Revenue |
|---|---|---|
| Insurance | 4 | $201B |
|
||
| Consumer Goods | 4 | $87B |
|
||
| Industrial Machinery | 3 | $64B |
|
||
| Healthcare | 2 | $55B |
|
||
| Retail / Pharmacy | 1 | $148B |
|
||
| Agriculture / Food | 1 | $86B |
|
||
Price history
+66.0% since first listed5 events — show timeline
- 2026-05-26 Listed $249,000 MRED as Distributed by MLS Grid
- 2026-05-20 Listing Removed — MRED as Distributed by MLS Grid
- 2026-05-18 Price Changed — MRED as Distributed by MLS Grid
- 2026-03-20 Listed — MRED as Distributed by MLS Grid
- 2015-04-07 Sold (Public Records) $150,000 Public Records
Property tax history
-0.1%/yrLatest (2023): $6,836 · -2.3% YoY. Source: county tax records.
Cash-flow waterfall
monthlySold comps — $/sqft
last 12 mo · ≤1 miLoading sold comps…