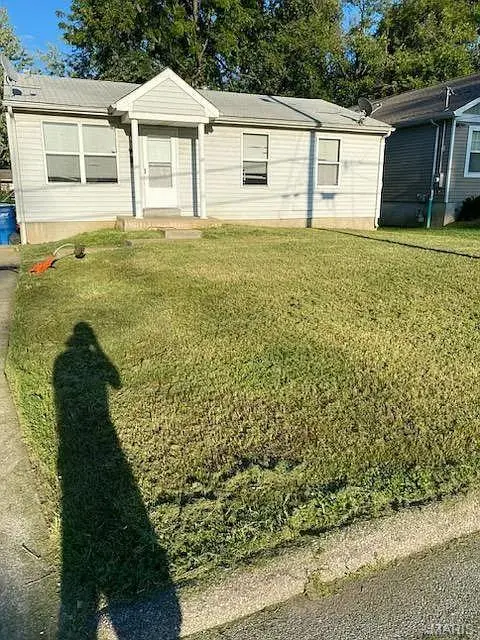
6128 Washington Ave · Berkeley, MO
Flood risk 1/10 · Minimal
- FEMA flood zone
- X (unshaded)
- Chance of flooding over 30 yrs
- 0.0%
- Est. flood insurance / yr
- $473 – $860
Fire risk 1/10 · Minimal
- Est. fire insurance / yr
- $1,054 – $1,958
Heat risk 4/10 · Minor
- Hot days now (above 106°F)
- 7 days/yr
- Hot days in 30 yrs
- 21 days/yr
Wind risk 2/10 · Minimal
- Chance of severe wind over 30 yrs
- 1.0%
Air-quality risk 4/10 · Minor
- Unhealthy air days now
- 4 days/yr
- Unhealthy air days in 30 yrs
- 5 days/yr
Risk factors via First Street. Map © Google.
Why this score? — see what drove the C grade
The composite is a weighted blend of 9 inputs, each scored 0–100. Each bar is that input's sub-score; the figure is the points it added to the 100-point composite (weight × sub-score).
- Cash flow +28.7/30.0
- DSCR +10.0/10.0
- 1% rule +7.4/10.0
- Rent growth +2.9/5.0
- Livability +2.7/5.0
- Condition / age +2.5/5.0
- Schools +1.2/10.0
- ARV discount +0.0/15.0
- Appreciation +0.0/10.0
$104,900
🖨 Deal sheet 📄 Offer letter ✓ Due diligence
Listing remarks MLS
6128 Washington Ave in 63134 is a solid turnkey rental opportunity for any new or experienced investor. The property is currently occupied by a Section 8 tenant paying $1,295 per month, with the lease in place through 1/1/27. This property is part of an 8 home single family rental portfolio, and the seller would prefer to sell the portfolio together or in groups, though each home is also being offered individually. The portfolio is made up entirely of 3 bedroom houses, including six 3 bed 1 bath homes, one 3 bed 1.5 bath home, and one 3 bed 2 bath home. 6/8 houses currently occupied, with current rents totaling $8,140 per month. Once the two vacant units are leased, scheduled rents are projected to reach $10,640 per month. There is also additional upside as units turn, with pro forma rents projected to exceed $11,000 per month. Ownership and management have been hands on and proactive during their time operating the portfolio, with a focus on maintaining safe, solid housing and keeping the properties in good condition making this portfolio a true turnkey investment. Most of the tenants are Section 8, with one market rate tenant currently in place, providing stable income in a strong rental area. The properties are also located near one another, which helps from both a management and operational standpoint. This is a great opportunity for an investor looking to add quality rental doors to an existing portfolio, or for someone looking to get started with a well positioned group of income producing properties.
Key facts
- 5,662 sq ft lot
- Built 1990
- Listed 52 days
Neighborhood map
What this means for you Summary
Snapshot
- This is a 3-bed/1.0-bath single-family listed at $105k.
Deal economics
- At list price, monthly cash flow is $349 ($4k/yr) — positive.
- The deal already cash-flows at list — no discount required.
- Meets the 1% rule at list price ($1k rent vs $105k).
- Recommended offer: $102k (3.0% below list) — sets the bar for market timing.
Location & tenants
- Location reads 54/100 on livability (#774 in MO) — a working-class tenant base; expect higher turnover. Strengths: cost of living A+, housing A; Watch: health & safety C-, schools F, crime F.
- Ferguson-Florissant R-II (suburban): math 7% / reading 20% proficiency, ranked #311 of 324 in MO (top 96%) — low school quality limits family demand, transient renter base, plan for 1-2y turnover; 70% free/reduced lunch — lower-income household profile, screen leases tightly.
- Market conditions: Rents rising (+1.6%/yr); 70 active listings in the ZIP; 37 comparable units currently listed for rent nearby; rentals at typical pace (median 24d on market — plan ~3-4 weeks tenant-placement turnaround); lower-income renter base — watch delinquency; 920 units permitted in St. Louis County in 2024 (250 in 5+ unit buildings).
- This rent runs 35% of the median local income ($45k/yr) — at the standard rent-burdened threshold; future hikes will face affordability resistance.
Forward outlook
- Local home prices are declining (-3.0%/yr); year-one equity from $725 of loan paydown is wiped out by about $3k of value loss. Plan a longer hold.
- At projected returns (-3.0% appreciation + 1.6% rent growth), your $29k cash investment doubles in ~10 years — after that, you're playing with house money.
Negotiation context
- It's been on market 53 days — a 3% lower offer ($102k) is reasonable based on typical stale-listing flexibility.
- 2 sale attempts since 5y ago with the ask held roughly flat each time — persistent listings suggest the price (not the market) is what's stuck; bring a comps-based counter.
- Current owner paid $76k; 38% above their basis — modest negotiation headroom, anchor on the comps not their cost.
Questions for the listing agent
- It's been on market 53 days. Have you received any prior offers? Is the seller open to a 3% concession, seller financing, or rate buy-down credit?
- Is there a deadline driving the sale (1031 exchange, divorce, estate, relocation)? That informs how much negotiation room exists.
- Schools are F-rated, which usually means shorter tenancies and higher turnover. Who's the typical renter profile here, and what's been the actual vacancy rate?
- Crime grade is F in this area — have there been break-ins, vandalism, or insurance claims at this property in the last 3 years? What carrier currently insures it and at what premium?
- What's the average days-on-market for RENTAL listings here right now (not sales)? A rising rental-DOM trend means longer vacancies and softer asking-rent achievability than the comps imply.
- What's the recent tenant-quality profile in this submarket — average credit score on applications, eviction rate, late-payment / NSF rate, and stable-employment percentage? A property-management company in the area should have these aggregated.
- How much new for-sale + rental construction is in the pipeline within 1–3 miles? Heavy new supply typically softens prices + rents 12–24 months out; constrained supply supports both.
Investment metrics
- 1% rule
- 1.24% ✓
- Cap rate
- 10.28%
- Cash-on-cash
- 14.25%
- DSCR
- 1.63
- GRM
- 6.7
CMA / ARV
- ARV (median comp)
- $81,885
- List price
- $104,900
- Delta
- 28.11%
- Verdict
- OVERPRICED
- Comps
- 20 within 1.0 mi
Show comp detail 12 sales within ~0.75 mi
| Address | Dist | Beds/Ba | Sqft | Sold | Price | $/sf | Match |
|---|---|---|---|---|---|---|---|
| 6300 Evergreen Blvd | 0.27mi | 3/1.0 | 864 (-8%) | 2mo | $99,000 | $115 | 73 |
| 6330 Washington Ave | 0.32mi | 3/1.0 | 864 (-8%) | 1mo | $50,000 | $58 | 71 |
| 6315 Jackson Ave | 0.29mi | 3/1.0 | 998 (+7%) | 5mo | $102,000 | $102 | 71 |
| 6013 Garfield Ave | 0.30mi | 2/1.0 (-1) | 984 (+5%) | 3mo | $75,000 | $76 | 70 |
| 6042 Hancock Ave | 0.21mi | 3/1.0 | 1,041 (+11%) | 3mo | $104,900 | $101 | 70 |
| 8139 Blanchard Dr | 0.33mi | 2/1.0 (-1) | 984 (+5%) | 4mo | $69,900 | $71 | 68 |
| 6006 Cascade Dr | 0.34mi | 2/1.0 (-1) | 1,044 (+12%) | 1mo | $75,000 | $72 | 59 |
| 826 Walters Dr | 0.72mi | 2/1.0 (-1) | 925 (-1%) | 2mo | $60,000 | $65 | 58 |
| 838 Abston Ave | 0.69mi | 2/1.0 (-1) | 959 (+2%) | 6mo | $85,000 | $89 | 54 |
| 308 Henquin Dr | 0.67mi | 2/1.0 (-1) | 861 (-8%) | 1mo | $80,000 | $93 | 50 |
| 8630 Haltonia Ln | 0.55mi | 2/1.0 (-1) | 1,072 (+14%) | 2mo | $85,000 | $79 | 44 |
| 222 Henquin Dr | 0.66mi | 2/1.0 (-1) | 816 (-13%) | 1mo | $115,000 | $141 | 42 |
Match score weights: distance 35% · size 25% · config 20% · recency 20%. Top-matched comps best support the ARV.
Projected returns pro-forma
-3.0% appreciation · 1.61% rent growth · sell at horizon
- IRR
- 3.1%
- Equity multiple
- 1.12×
- Total profit
- $3,407
- Equity at exit
- $15,641
- IRR
- 11.3%
- Equity multiple
- 1.83×
- Total profit
- $24,361
- Equity at exit
- $9,070
Cash invested: $29,372 (down + closing). Projections, not guarantees.
Landlord ↔ Tenant lean methodology
- Overall (STATE)
- 81 Strongly Landlord-Friendly
- State Missouri
- 81 Strongly Landlord-Friendly · R+10
- County
- — inherits STATE
- City
- — inherits STATE
ZIP-level market 63134
- Rents YoY
- 1.6%
- Active inventory
- 70
- Price-to-rent
- 6.7×
Monthly cashflow live
- Estimated rent
- $1,304 high interval (Pro) →
- Mortgage (P&I)
- −$550
- Tax from tax record
- −$88 /mo · $1,052/yr
- Insurance
- −$44
- HOA
- −$0
- Vacancy / Maint / Mgmt
- −$274
- Net cashflow
- $349
Break-even live
UW: 25.0% down · 7.5% · 30yr · 1.5% tax · 5.0% vac · 8.0% maint · 8.0% mgmt
Financing live
Cash to close
- Down payment
- $26,225
- Closing costs
- $3,147
- Reserves months
- —
- Total cash needed
- —
Loan-product check · same deal, 3 products live
Conventional
25% down · 7.5% · 30yr
- Down + closing
- —
- Monthly P&I
- —
- Monthly cashflow
- —
- DSCR
- —
- Eligible?
- —
Personal DTI + credit; lowest rate.
DSCR
20% down · 8.5% · 30yr
- Down + closing
- —
- Monthly P&I
- —
- Monthly cashflow
- —
- DSCR
- —
- Eligible?
- —
No personal income docs; deal must DSCR.
Hard money
10% down · 12.0% · 12mo
- Down + closing
- —
- Monthly P&I
- —
- Monthly cashflow
- —
- DSCR
- —
- Eligible?
- —
Short-term bridge; refi at stabilization.
Rent comps 37 comps
| Address | Beds | Baths | Sqft | Rent | $/sqft | DOM | Units | Dist |
|---|---|---|---|---|---|---|---|---|
| 6214 Jefferson Ave Saint Louis, MO | 2.0 | 1.0 | 816 | $1,195 | $1.46 | 23d | 1 | 0.13mi |
| 8306 Whitewater Dr Saint Louis, MO | 3.0 | 1.0 | 792 | $1,195 | $1.51 | 7d | 1 | 0.19mi |
| 6042 Hancock Ave Berkeley, MO | 3.0 | 1.0 | 1041 | $1,495 | $1.44 | 23d | 1 | 0.20mi |
| 6234 Hancock Ave Berkeley, MO | 2.0 | 1.0 | 846 | $1,050 | $1.24 | 43d | 1 | 0.21mi |
| 6315 Washington Ave Berkeley, MO | 2.0 | 1.0 | 739 | $1,175 | $1.59 | 16d | 1 | 0.27mi |
| 6044 Cascade Dr Saint Louis, MO | 2.0 | 1.0 | 984 | $1,150 | $1.17 | 7d | 1 | 0.29mi |
| 6334 Washington Ave Berkeley, MO | 3.0 | 1.0 | 864 | $1,100 | $1.27 | 4d | 1 | 0.31mi |
| 6336 Washington Ave Berkeley, MO | 2.0 | 1.0 | 720 | $1,175 | $1.63 | 43d | 1 | 0.32mi |
| 6132 Eaton Dr Saint Louis, MO | 2.0 | 1.0 | 792 | $1,125 | $1.42 | 23d | 1 | 0.45mi |
| 6333 Peurifoy Ave Saint Louis, MO | 3.0 | 2.0 | 840 | $1,295 | $1.54 | 23d | 1 | 0.46mi |
| 6156 Wulff Dr Saint Louis, MO | 3.0 | 2.0 | 960 | $1,425 | $1.48 | 10d | 1 | 0.59mi |
| 222 Henquin Dr Saint Louis, MO | 2.0 | 1.0 | 816 | $1,050 | $1.29 | 17d | 1 | 0.68mi |
| 910 Disco Dr Saint Louis, MO | 3.0 | 1.0 | 924 | $1,260 | $1.36 | 16d | 1 | 0.69mi |
| 60 Mayme Dr Saint Louis, MO | 3.0 | 1.0 | 960 | $1,285 | $1.34 | 43d | 1 | 0.71mi |
| 6625 Thurston Ave Saint Louis, MO | 2.0 | 1.0 | 939 | $1,300 | $1.38 | 43d | 1 | 0.81mi |
| 6625 Thurston Ave Saint Louis, MO | 2.0 | 1.0 | 939 | $1,400 | $1.49 | 23d | 1 | 0.81mi |
| 8330 Woodhurst Dr Saint Louis, MO | 3.0 | 1.0 | 1120 | $1,000 | $0.89 | 7d | 1 | 0.93mi |
| 601 Carson Rd Saint Louis, MO | 2.0 | 1.0 | 743 | $950 | $1.28 | 23d | 1 | 0.98mi |
| 422 Plaza Ave Saint Louis, MO | 3.0 | 1.0 | 792 | $1,000 | $1.26 | 7d | 1 | 1.18mi |
| 519 Graf Ave Saint Louis, MO | 3.0 | 2.0 | 887 | $1,297 | $1.46 | 20d | 1 | 1.23mi |
| 5500 Mable Ave Unit 5530 B1 St. Louis, MO | 3.0 | 1.0 | 850 | $915 | $1.08 | 43d | 1 | 1.24mi |
| 5500 Mable Ave Unit 5518 B4 St. Louis, MO | 2.0 | 1.0 | 750 | $835 | $1.11 | 43d | 1 | 1.24mi |
| 360 S Harvey Ave Saint Louis, MO | 2.0 | 1.0 | 936 | $925 | $0.99 | 43d | 1 | 1.25mi |
| 260 Sadonia Ave Saint Louis, MO | 3.0 | 2.0 | 1088 | $1,623 | $1.49 | 20d | 1 | 1.25mi |
| 24 Vierling Dr Saint Louis, MO | 2.0 | 1.0 | 850 | $1,290 | $1.52 | 7d | 1 | 1.26mi |
| 153 Bascom Dr Saint Louis, MO | 3.0 | 1.0 | 1076 | $1,195 | $1.11 | 19d | 1 | 1.26mi |
| 171 Elbring Dr Saint Louis, MO | 3.0 | 1.5 | 1008 | $1,395 | $1.38 | 12d | 1 | 1.27mi |
| 450 S Dade Ave Saint Louis, MO | 2.0 | 1.0 | 1040 | $1,200 | $1.15 | 23d | 1 | 1.27mi |
| 263 Sadonia Ave Saint Louis, MO | 3.0 | 2.0 | 888 | $1,350 | $1.52 | 43d | 1 | 1.28mi |
| 7025 Richwood Ln Hazelwood, MO | 3.0 | 1.0 | 936 | $1,375 | $1.47 | 17d | 1 | 1.30mi |
| 709 Suburban Ave Saint Louis, MO | 2.0 | 1.0 | 975 | $1,400 | $1.44 | 43d | 1 | 1.31mi |
| 46 Bascom Dr Saint Louis, MO | 2.0 | 1.0 | 932 | $1,175 | $1.26 | 43d | 1 | 1.37mi |
| 246 Louisa Ave Saint Louis, MO | 3.0 | 1.0 | 1036 | $1,600 | $1.54 | 43d | 1 | 1.38mi |
| 107 Anistasia Dr Saint Louis, MO | 2.0 | 2.0 | 1030 | $1,400 | $1.36 | 23d | 1 | 1.44mi |
| 241 Flora Dr Saint Louis, MO | 2.0 | 1.0 | 703 | $1,075 | $1.53 | 23d | 1 | 1.44mi |
| 1275 N Florissant Rd Saint Louis, MO | 2.0 | 1.0 | 1008 | $1,275 | $1.26 | 23d | 1 | 1.46mi |
| 222 Randolph Ave Saint Louis, MO | 2.0 | 1.0 | 964 | $1,400 | $1.45 | 7d | 1 | 1.47mi |
Listing history 28 events
-
2026-06-18days on market $104,900 Active 53 DOM
-
2026-06-17days on market $104,900 Active 52 DOM
-
2026-06-16days on market $104,900 Active 51 DOM
-
2026-06-15days on market $104,900 Active 50 DOM
-
2026-06-13days on market $104,900 Active 48 DOM
-
2026-06-13days on market $104,900 Active 47 DOM
-
2026-06-09days on market $104,900 Active 44 DOM
-
2026-06-08days on market $104,900 Active 43 DOM
-
2026-06-07days on market $104,900 Active 42 DOM
-
2026-06-05days on market $104,900 Active 39 DOM
-
2026-06-03days on market $104,900 Active 38 DOM
-
2026-06-02days on market $104,900 Active 37 DOM
-
2026-06-01days on market $104,900 Active 36 DOM
-
2026-05-31days on market $104,900 Active 35 DOM
-
2026-05-06historical Active Under Contract 1536-char remark
Show marketing remark (1536 chars)
6128 Washington Ave in 63134 is a solid turnkey rental opportunity for any new or experienced investor. The property is currently occupied by a Section 8 tenant paying $1,295 per month, with the lease in place through 1/1/27. This property is part of an 8 home single family rental portfolio, and the seller would prefer to sell the portfolio together or in groups, though each home is also being offered individually. The portfolio is made up entirely of 3 bedroom houses, including six 3 bed 1 bath homes, one 3 bed 1.5 bath home, and one 3 bed 2 bath home. 6/8 houses currently occupied, with current rents totaling $8,140 per month. Once the two vacant units are leased, scheduled rents are projected to reach $10,640 per month. There is also additional upside as units turn, with pro forma rents projected to exceed $11,000 per month. Ownership and management have been hands on and proactive during their time operating the portfolio, with a focus on maintaining safe, solid housing and keeping the properties in good condition making this portfolio a true turnkey investment. Most of the tenants are Section 8, with one market rate tenant currently in place, providing stable income in a strong rental area. The properties are also located near one another, which helps from both a management and operational standpoint. This is a great opportunity for an investor looking to add quality rental doors to an existing portfolio, or for someone looking to get started with a well positioned group of income producing properties.
-
2026-04-27$104,900 Active 1536-char remark
Show marketing remark (1536 chars)
6128 Washington Ave in 63134 is a solid turnkey rental opportunity for any new or experienced investor. The property is currently occupied by a Section 8 tenant paying $1,295 per month, with the lease in place through 1/1/27. This property is part of an 8 home single family rental portfolio, and the seller would prefer to sell the portfolio together or in groups, though each home is also being offered individually. The portfolio is made up entirely of 3 bedroom houses, including six 3 bed 1 bath homes, one 3 bed 1.5 bath home, and one 3 bed 2 bath home. 6/8 houses currently occupied, with current rents totaling $8,140 per month. Once the two vacant units are leased, scheduled rents are projected to reach $10,640 per month. There is also additional upside as units turn, with pro forma rents projected to exceed $11,000 per month. Ownership and management have been hands on and proactive during their time operating the portfolio, with a focus on maintaining safe, solid housing and keeping the properties in good condition making this portfolio a true turnkey investment. Most of the tenants are Section 8, with one market rate tenant currently in place, providing stable income in a strong rental area. The properties are also located near one another, which helps from both a management and operational standpoint. This is a great opportunity for an investor looking to add quality rental doors to an existing portfolio, or for someone looking to get started with a well positioned group of income producing properties.
-
2026-04-14historical $104,900 1536-char remark
Show marketing remark (1536 chars)
6128 Washington Ave in 63134 is a solid turnkey rental opportunity for any new or experienced investor. The property is currently occupied by a Section 8 tenant paying $1,295 per month, with the lease in place through 1/1/27. This property is part of an 8 home single family rental portfolio, and the seller would prefer to sell the portfolio together or in groups, though each home is also being offered individually. The portfolio is made up entirely of 3 bedroom houses, including six 3 bed 1 bath homes, one 3 bed 1.5 bath home, and one 3 bed 2 bath home. 6/8 houses currently occupied, with current rents totaling $8,140 per month. Once the two vacant units are leased, scheduled rents are projected to reach $10,640 per month. There is also additional upside as units turn, with pro forma rents projected to exceed $11,000 per month. Ownership and management have been hands on and proactive during their time operating the portfolio, with a focus on maintaining safe, solid housing and keeping the properties in good condition making this portfolio a true turnkey investment. Most of the tenants are Section 8, with one market rate tenant currently in place, providing stable income in a strong rental area. The properties are also located near one another, which helps from both a management and operational standpoint. This is a great opportunity for an investor looking to add quality rental doors to an existing portfolio, or for someone looking to get started with a well positioned group of income producing properties.
-
2021-04-21soldstatus Closed 250-char remark
Show marketing remark (250 chars)
Add this one to your rental portfolio!! NO SHOWINGS WITHOUT AN ACCEPTED CONTRACT! Tenant pays $695.00 a month and the lease ends on 7/31/2022. Seller will do no repairs, warranties or inspections. SELLER REQUEST THAT BUYER CLOSES WITH INTEGRITY TITLE
-
2021-04-20status Pending 250-char remark
Show marketing remark (250 chars)
Add this one to your rental portfolio!! NO SHOWINGS WITHOUT AN ACCEPTED CONTRACT! Tenant pays $695.00 a month and the lease ends on 7/31/2022. Seller will do no repairs, warranties or inspections. SELLER REQUEST THAT BUYER CLOSES WITH INTEGRITY TITLE
-
2021-03-18historical Active Under Contract 250-char remark
Show marketing remark (250 chars)
Add this one to your rental portfolio!! NO SHOWINGS WITHOUT AN ACCEPTED CONTRACT! Tenant pays $695.00 a month and the lease ends on 7/31/2022. Seller will do no repairs, warranties or inspections. SELLER REQUEST THAT BUYER CLOSES WITH INTEGRITY TITLE
-
2021-03-10$46,000 Active 250-char remark
Show marketing remark (250 chars)
Add this one to your rental portfolio!! NO SHOWINGS WITHOUT AN ACCEPTED CONTRACT! Tenant pays $695.00 a month and the lease ends on 7/31/2022. Seller will do no repairs, warranties or inspections. SELLER REQUEST THAT BUYER CLOSES WITH INTEGRITY TITLE
-
2016-07-25soldstatus $76,000
-
2016-04-05soldstatus $39,000
-
2016-03-14soldstatus $24,000
-
2016-03-10soldstatus $16,000
-
1991-01-15soldstatus
-
1990-11-01soldstatus $3,000
-
1990-11-01soldstatus
ⓘ Source: listings_history table (triggers on properties + properties_extension) + one-shot
backfill from property_details.listing_events for pre-trigger history.
Tax reassessment forecast MO · Resets to sale price
- Current annual tax
- $1,052 · $88/mo
- Projected year-2 tax
- $1,052 · $88/mo
- Expected delta
- $0/yr ($0/mo · 0.0%)
ⓘ Screening estimate from a state-policy table — verify with the county assessor before closing.
Climate risk First Street
- Flood 1/10 Low FEMA zone X (unshaded) · 0% chance over 30 yrs
- Wildfire 1/10 Low
- Heat 4/10 Moderate 7 d/yr ≥106°F today · 21 d/yr by 30 yrs out
- Wind 2/10 Low 100% chance of damaging wind over 30 yrs
- Air quality 4/10 Moderate 4 unhealthy d/yr today · 5 by 30 yrs out
Nearby sold comps map
Loading sold comps map…
Walkable amenities ~0.75 mi
Loading nearby amenities…
Taxation est. · year 1
- Rental income
- $15,649
- − Mortgage interest
- −$5,876
- − Property taxes
- −$1,052
- − Insurance
- −$524
- − Repairs & maintenance
- −$1,252
- − Management
- −$1,252
- − Depreciation
- −$3,052
- Taxable income
- $2,641
- Est. tax owed @ 24.0%
- −$634
- After-tax cash flow
- $3,551/yr
For passive investors: Depreciation is non-cash, so a rental often shows a tax loss while cash-flowing — sheltering income. Rental losses are passive: they offset passive income freely, and up to $25,000/yr can offset ordinary (W-2) income if you actively participate and your MAGI is under $100k (phasing out to $0 by $150k); unused losses carry forward. On sale, claimed depreciation is recaptured at up to 25%, and gains may owe capital-gains tax (a 1031 exchange can defer both). Figures are a year-1 estimate at your 24.0% rate — not tax advice; consult a CPA.
Schools (NCES district)
- District
- Ferguson-Florissant R-II
- NCES district ID
- 2912010
- Math proficiency
- 7% ▼ -9.00%
- Reading proficiency
- 20% ▼ -6.00%
- Median HH income
- $44,610
- Composite
- 11.96/100
- National rank
- #9666
- State rank
- #311 of 324 in MO
Livability — Berkeley
- Score
- 54/100
- State rank
- #774
- US rank
- #23800
Category grades
Schools grade is shown separately in the Schools card above.
Census & demographics
- Census place
- Berkeley, MO
- County
- Saint Louis County · 888,823 people
- City population
- 13,059
- Metro
- St. Louis, MO-IL
- Population (ZIP)
- 13,059
- Household income
- $44,680
- Rent vs Own
- Severe rent burden
- 655.0
Population outlook (St. Louis County) Hauer SSP2
- Today (2025)
- 1,025,227 people
- By 2030
- 1,028,023 · +0.3%
- By 2040
- 1,020,940 · -0.4%
- By 2050
- 1,007,280 · -1.8%
- By 2075
- 987,277 · -3.7%
- By 2100
- 921,984 · -10.1%
Race, ethnicity, and origin ACS 2023
- Neighborhood character
- Predominantly Black (66%)
- Race & ethnicity
- Black 66% White 17% Hispanic / Latino 13% Two or more races 7%
- Hispanic origin (detail)
- Mexican 8%
- Common ancestry
- Lithuanian 1%
- Foreign-born
- 6% · Canada
- Languages at home
- 86% English-only · Spanish 11%
Political lean MEDSL · St. Louis
- 2024 margin
- Strong D (+23.4) · D 60.8% · R 37.4% · Other 1.7%
- 2008→2024 swing
- +3.5pp toward D · 2008: 19.9pp · 2024: 23.4pp
- All cycles
- 2024: D+23.4 2020: D+24.0 2016: D+16.2 2012: D+13.7 2008: D+19.9
Not yet ingested
- Civics
- —
Market trends
- HPI YoY
- ▼ -164.02%
- Current HPI
- 226.9524
- Rent YoY
- ▲ 1.61%
- Metro
- St. Louis, MO-IL
- State GDP YoY
- ▲ 1.84%
- F500 in state
- 20
Industry mix (Fortune 500 HQ in MO)
| Industry | F500 HQs | Revenue |
|---|---|---|
| Healthcare | 1 | $163B |
|
||
| Insurance | 1 | $21B |
|
||
| Industrial Technology | 1 | $17B |
|
||
| Retail | 1 | $16B |
|
||
| Industrial Distribution | 1 | $10B |
|
||
| Utilities | 1 | $9B |
|
||
Price history
+3396.7% since first listed14 events — show timeline
- 2026-05-06 Contingent — MARIS as Distributed by MLS Grid
- 2026-04-27 Listed $104,900 MARIS as Distributed by MLS Grid
- 2026-04-14 Coming Soon $104,900 MARIS as Distributed by MLS Grid
- 2021-04-21 Sold (MLS) — MARIS as Distributed by MLS Grid
- 2021-04-20 Pending — MARIS as Distributed by MLS Grid
- 2021-03-18 Contingent — MARIS as Distributed by MLS Grid
- 2021-03-10 Listed $46,000 MARIS as Distributed by MLS Grid
- 2016-07-25 Sold (Public Records) $76,000 Public Records
- 2016-04-05 Sold (Public Records) $39,000 Public Records
- 2016-03-14 Sold (Public Records) $24,000 Public Records
- 2016-03-10 Sold (Public Records) $16,000 Public Records
- 1991-01-15 Sold (Public Records) — Public Records
- 1990-11-01 Sold (Public Records) — Public Records
- 1990-11-01 Sold (Public Records) $3,000 Public Records
Property tax history
-3.5%/yrLatest (2018): $1,052 · +0.6% YoY. Source: county tax records.
Cash-flow waterfall
monthlySold comps — $/sqft
last 12 mo · ≤1 miLoading sold comps…