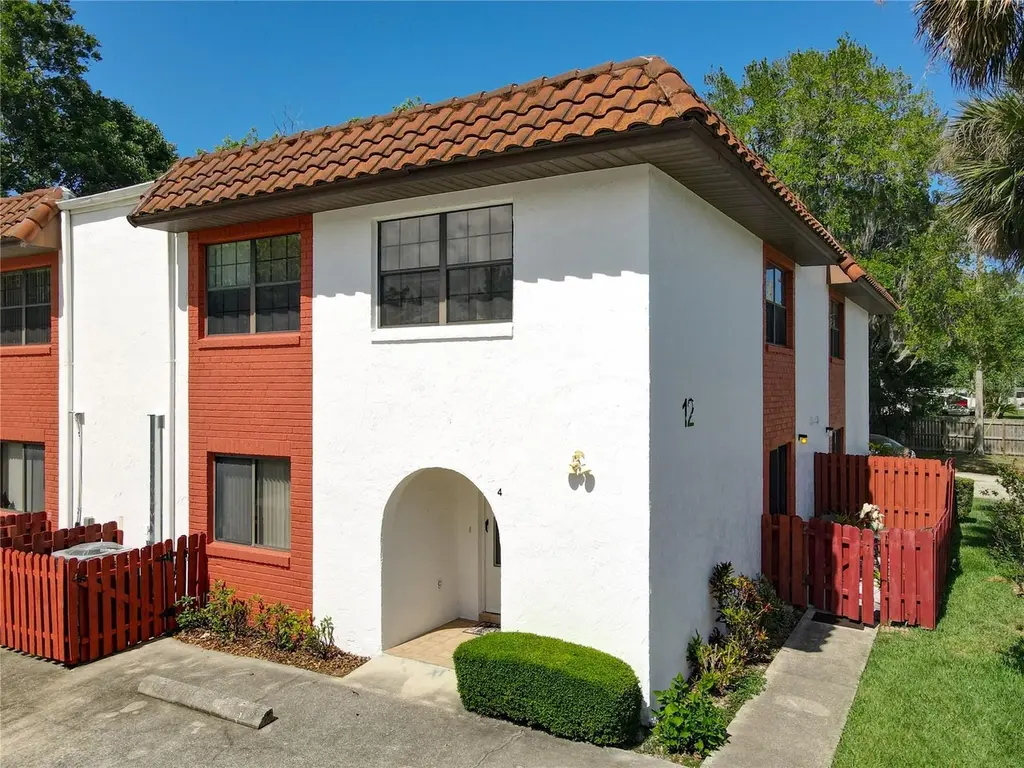
910 Big Tree Rd Unit 12-4 · South Daytona, FL
Flood risk 6/10 · Moderate
- FEMA flood zone
- X (shaded)
- Chance of flooding over 30 yrs
- 0.57%
- Est. flood insurance / yr
- $507 – $1,088
Fire risk 1/10 · Minimal
- Est. fire insurance / yr
- $947 – $1,759
Heat risk 10/10 · Severe
- Hot days now (above 105°F)
- 7 days/yr
- Hot days in 30 yrs
- 20 days/yr
Wind risk 10/10 · Severe
- Chance of severe wind over 30 yrs
- 99.0%
Air-quality risk 2/10 · Minimal
- Unhealthy air days now
- 2 days/yr
- Unhealthy air days in 30 yrs
- 2 days/yr
Risk factors via First Street. Map © Google.
Why this score? — see what drove the D grade
The composite is a weighted blend of 9 inputs, each scored 0–100. Each bar is that input's sub-score; the figure is the points it added to the 100-point composite (weight × sub-score).
- Cash flow +12.2/30.0
- ARV discount +7.5/15.0
- 1% rule +4.7/10.0
- Livability +4.0/5.0
- Schools +3.9/10.0
- DSCR +3.6/10.0
- Condition / age +2.5/5.0
- Rent growth +2.0/5.0
- Appreciation +0.0/10.0
$196,000
🖨 Deal sheet 📄 Offer letter ✓ Due diligence
Listing remarks
Welcome to this well-maintained 3-bedroom, 2-bath, two-story condo located in the desirable Jemecy Oaks community in South Daytona. All bedrooms are thoughtfully situated upstairs, offering privacy and separation from the main living areas. The eat-in kitchen was upgraded in 2023 with new cabinet faces and tile, and opens to a private, fenced patio—perfect for relaxing or entertaining. This unit is positioned in the rear of the neighborhood, providing a quieter setting with minimal traffic. Interior features include neutral tones, wood and tile flooring throughout, a new HVAC system installed in 2025, and some updates to the bathrooms (2025). Enjoy the convenience of having two parks
Key facts
- $400 HOA
- Built 1991
- Listed 50 days
Property features AI
Finance
- Other: Development: Jemecy Oaks; CDD present; Unfurnished unit
- Financial info: No lease restrictions reported
- HOA & community: Monthly condo/HOA fee of $400 (includes common area taxes, insurance, grounds maintenance, private road); Association management: Win-Win mgt; Community mailbox; Pets allowed
Exterior
- Parking: Assigned parking
- Utilities: Public water; Public sewer; Electricity connected; Sewer connected
- Home design: Condominium; Two-story building; Unit on 2nd floor; Faces west
- Construction: Block construction; Other roof type; Slab foundation; Built on a 4.61-acre lot (community grounds)
- Exterior features: Side porch; Exterior storage; Wood fencing; Paved roads
Interior
- Kitchen: Dishwasher; Range; Refrigerator
- Bedrooms: 3 bedrooms
- Flooring: Ceramic tile; Hardwood; Tile
- Bathrooms: 2 full bathrooms
- Heating & cooling: Central heating; Central air conditioning
- Interior features: Built-in features; Ceiling fans; Eat-in kitchen; Thermostat
- Laundry & utility: Laundry inside in a laundry closet
Neighborhood map
What this means for you Summary
Snapshot
- This is a 3-bed/2.0-bath condo listed at $196k.
Deal economics
- At list price, monthly cash flow is $-40 ($-482/yr) — negative.
- To cash-flow at today's rent, offer at most $189k (3.6% below list).
- To meet the 1% rule (rent ≥ 1% of price), the offer needs to be $191k (2.6% below list).
- Recommended offer: $189k (3.6% below list) — sets the bar for cash-flow.
Location & tenants
- Location reads 80/100 on livability (#114 in FL, #1,755 nationally) — a professional / high-income tenant draw. Strengths: amenities A+, cost of living A+, housing A+; Watch: employment D, commute F.
- Volusia (suburban): math 44% / reading 49% proficiency, ranked #47 of 73 in FL (top 64%) — families likely to look elsewhere, expect single-tenant / working-renter base with shorter leases.
- Zoned schools: South Daytona Elementary School (math 43% / reading 44%, grade F, #1,345 of 2,144 statewide, top 64%, 779 students, 77% FRL); Atlantic High School (math 24% / reading 46%, grade F, #379 of 667 statewide, top 58%, 1,266 students, 52% FRL).
- Market conditions: Rents soft (-2.0%/yr); 280 active listings in the ZIP; 35 comparable units currently listed for rent nearby; rentals at typical pace (median 24d on market — plan ~3-4 weeks tenant-placement turnaround); 3,402 units permitted in Volusia County in 2024 (681 in 5+ unit buildings).
- This rent runs 40% of the median local income ($57k/yr) — at the standard rent-burdened threshold; future hikes will face affordability resistance.
Forward outlook
- Local home prices are declining (-3.0%/yr); year-one equity from $1k of loan paydown is wiped out by about $6k of value loss. Plan a longer hold.
- Volusia County population projected at +19% by 2050 — long-run rental-demand tailwind backs the buy-and-hold thesis.
Negotiation context
- It's been on market 50 days — a 3% lower offer ($190k) is reasonable based on typical stale-listing flexibility.
- Current owner paid $58k; list at $196k implies a 238% gain — meaningful room to come down on a strong offer.
Risks & watch-outs
- Watch-outs: HOA is 21% of rent.
- Climate carrying-cost: major flood risk; severe wind risk, 99% chance of damaging wind over 30y; extreme-heat days projected 7→20/yr by 2055 (HVAC capex compounding) — expect insurance premiums to compound above CPI over the hold.
Questions for the listing agent
- What do current leases actually rent for vs. the listed asking? Can we see a recent rent roll and the last 12 months of T-12 income?
- It's been on market 50 days. Have you received any prior offers? Is the seller open to a 4% concession, seller financing, or rate buy-down credit?
- What does the HOA fee cover, when was the last increase, and are there any pending special assessments or reserve-fund shortfalls?
- Any open or pending special assessments — roof, HVAC, plumbing, elevator, façade? What's the per-unit balance and payoff schedule, and is the seller paying it off at close or rolling it to the buyer?
- Is there a deadline driving the sale (1031 exchange, divorce, estate, relocation)? That informs how much negotiation room exists.
- Schools are D-rated, which usually means shorter tenancies and higher turnover. Who's the typical renter profile here, and what's been the actual vacancy rate?
- The area grade is low — what's the realistic commute time and amenity access for the typical tenant pool here? Any planned neighborhood developments (good or bad) we should know about?
- What's the average days-on-market for RENTAL listings here right now (not sales)? A rising rental-DOM trend means longer vacancies and softer asking-rent achievability than the comps imply.
- What's the recent tenant-quality profile in this submarket — average credit score on applications, eviction rate, late-payment / NSF rate, and stable-employment percentage? A property-management company in the area should have these aggregated.
- How much new apartment / multifamily construction is in the pipeline within 1–3 miles? Heavy new supply (>2% of stock underway) typically softens rents 12–24 months out; light construction supports rent growth.
Investment metrics
- 1% rule
- 0.97% ✗
- Cap rate
- 6.05%
- Cash-on-cash
- -0.88%
- DSCR
- 0.96
- GRM
- 8.6
CMA / ARV
No comps found within radius.
Projected returns pro-forma
-3.0% appreciation · 0.0% rent growth · sell at horizon
- IRR
- -21.6%
- Equity multiple
- 0.28×
- Total profit
- $-39,761
- Equity at exit
- $29,224
- IRR
- -26.7%
- Equity multiple
- -0.07×
- Total profit
- $-58,927
- Equity at exit
- $16,946
Cash invested: $54,880 (down + closing). Projections, not guarantees.
Landlord ↔ Tenant lean methodology
- Overall (STATE)
- 87 Strongly Landlord-Friendly
- State Florida
- 87 Strongly Landlord-Friendly · R+3
- County
- — inherits STATE
- City
- — inherits STATE
ZIP-level market 32119
- Rents YoY
- -2.0%
- Active inventory
- 280
- Price-to-rent
- 8.6×
Monthly cashflow live
- Estimated rent
- $1,908 high interval (Pro) →
- Mortgage (P&I)
- −$1,028
- Tax from tax record
- −$38 /mo · $457/yr
- Insurance
- −$82
- HOA
- −$400
- Vacancy / Maint / Mgmt
- −$401
- Net cashflow
- $-40
Break-even live
UW: 25.0% down · 7.5% · 30yr · 1.5% tax · 5.0% vac · 8.0% maint · 8.0% mgmt
Financing live
Cash to close
- Down payment
- $49,000
- Closing costs
- $5,880
- Reserves months
- —
- Total cash needed
- —
Loan-product check · same deal, 3 products live
Conventional
25% down · 7.5% · 30yr
- Down + closing
- —
- Monthly P&I
- —
- Monthly cashflow
- —
- DSCR
- —
- Eligible?
- —
Personal DTI + credit; lowest rate.
DSCR
20% down · 8.5% · 30yr
- Down + closing
- —
- Monthly P&I
- —
- Monthly cashflow
- —
- DSCR
- —
- Eligible?
- —
No personal income docs; deal must DSCR.
Hard money
10% down · 12.0% · 12mo
- Down + closing
- —
- Monthly P&I
- —
- Monthly cashflow
- —
- DSCR
- —
- Eligible?
- —
Short-term bridge; refi at stabilization.
Rent comps 35 comps
| Address | Beds | Baths | Sqft | Rent | $/sqft | DOM | Units | Dist |
|---|---|---|---|---|---|---|---|---|
| 900 Boulder Dr South Daytona, FL | 2.0 | 1.0 | 939 | $1,850 | $1.97 | 23d | 1 | 0.13mi |
| 2208 Flourescent Way South Daytona, FL | 3.0 | 2.5 | 1400 | $2,300 | $1.64 | 23d | 1 | 0.17mi |
| 2085 Oak Meadow Cir South Daytona, FL | 3.0 | 2.0 | 1632 | $1,900 | $1.16 | 14d | 1 | 0.22mi |
| 2313 Incandescent Way Unit 1 South Daytona, FL | 3.0 | 2.5 | 1500 | $1,900 | $1.27 | 14d | 1 | 0.24mi |
| 793 Aspen Dr South Daytona, FL | 2.0 | 2.0 | 1300 | $1,940 | $1.49 | 23d | 1 | 0.30mi |
| 1952 Menger Cir South Daytona, FL | 3.0 | 2.0 | 1600 | $2,300 | $1.44 | 23d | 1 | 0.31mi |
| 17 Kimberly Ct Daytona Beach, FL | 2.0 | 2.0 | 896 | $1,299 | $1.45 | 23d | 1 | 0.37mi |
| 10 Harbor Cove Ct Daytona Beach, FL | 3.0 | 2.0 | 1456 | $1,499 | $1.03 | 23d | 1 | 0.43mi |
| 716 Boston Ave South Daytona, FL | 2.0 | 2.0 | 1373 | $2,100 | $1.53 | 14d | 1 | 0.54mi |
| 1505 Edgewater Rd Daytona Beach, FL | 3.0 | 2.0 | 1209 | $1,800 | $1.49 | 23d | 1 | 0.66mi |
| 910 Carey Dr South Daytona, FL | 3.0 | 2.0 | 1529 | $2,500 | $1.64 | 23d | 1 | 0.74mi |
| 535 Olive St South Daytona, FL | 2.0 | 1.0 | 1024 | $1,725 | $1.68 | 11d | 1 | 0.74mi |
| 1436 Suwanee Rd Daytona Beach, FL | 4.0 | 2.0 | 1823 | $2,500 | $1.37 | 23d | 1 | 0.76mi |
| 2050 S Ridgewood Ave South Daytona, FL | 1.0–2.0 | 1.0–1.5 | 818 | $1,450 | $1.77 | 23d | 1 | 0.98mi |
| 2203 Nottingham Rd South Daytona, FL | 4.0 | 2.0 | 1600 | $2,400 | $1.50 | 23d | 1 | 0.99mi |
| 1200 Floral Springs Blvd Port Orange, FL | 1.0–3.0 | 1.0–2.0 | 1047 | $2,175 | $2.08 | 11d | 81 | 1.08mi |
| 1830 S Palmetto Ave Unit 4 South Daytona, FL | 2.0 | 1.0 | 900 | $1,450 | $1.61 | 23d | 1 | 1.15mi |
| 2275 Granada Dr Unit 1 South Daytona, FL | 2.0 | 2.0 | 1000 | $1,600 | $1.60 | 23d | 1 | 1.16mi |
| 2140 S Palmetto Ave South Daytona, FL | 2.0 | 1.5 | 1100 | $1,499 | $1.36 | 23d | 1 | 1.19mi |
| 1270 Reed Canal Rd Port Orange, FL | 1.0–3.0 | 1.0–2.0 | 1001 | $2,137 | $2.13 | 11d | 29 | 1.21mi |
| 2250 S Palmetto Ave South Daytona, FL | 2.0 | 2.5 | 1386 | $1,600 | $1.15 | 23d | 1 | 1.24mi |
| 1504 Virginia Ave Daytona Beach, FL | 1.0–2.0 | 1.0–2.0 | 842 | $1,650 | $1.96 | 23d | 3 | 1.25mi |
| 1756 S Clyde Morris Blvd Daytona Beach, FL | 1.0–2.0 | 1.0–2.0 | 850 | $1,650 | $1.94 | 23d | 8 | 1.25mi |
| 1500 Virginia Ave Daytona Beach, FL | 2.0 | 2.0 | 910 | $1,475 | $1.62 | 23d | 1 | 1.26mi |
| 1174 Margina Ave Daytona Beach, FL | 3.0 | 2.0 | 1190 | $2,340 | $1.97 | 23d | 1 | 1.26mi |
| 1350 Virginia Ave Apt 17 Daytona Beach, FL | 2.0 | 2.0 | 950 | $1,399 | $1.47 | 23d | 1 | 1.29mi |
| 329 Wilder Blvd Daytona Beach, FL | 2.0 | 2.0 | 1161 | $1,900 | $1.64 | 23d | 1 | 1.36mi |
| 110 Dolphin Fleet Cir Daytona Beach, FL | 1.0–3.0 | 1.0–2.5 | 1125 | $2,124 | $1.89 | 11d | 20 | 1.39mi |
| 1400 Hancock Blvd Daytona Beach, FL | 1.0–2.0 | 1.0–2.0 | 800 | $1,483 | $1.85 | 11d | 11 | 1.39mi |
| 121 Westwood Dr Daytona Beach, FL | 3.0 | 2.0 | 1548 | $2,300 | $1.49 | 14d | 1 | 1.41mi |
| 1351 S Ridgewood Ave #26 Daytona Beach, FL | 2.0 | 1.5 | 988 | $1,285 | $1.30 | 14d | 1 | 1.42mi |
| 480 Reed Canal Rd #57 South Daytona, FL | 2.0 | 1.5 | 1024 | $1,550 | $1.51 | 23d | 1 | 1.42mi |
| 1420 New Bellevue Ave Daytona Beach, FL | 1.0–2.0 | 1.0–2.0 | 800 | $1,554 | $1.94 | 11d | 9 | 1.46mi |
| 1401 S Palmetto Ave Daytona Beach, FL | 1.0–2.0 | 1.0–2.0 | 890 | $1,800 | $2.02 | 23d | 3 | 1.46mi |
| 940 Lockhart St Daytona Beach, FL | 3.0 | 2.0 | 1071 | $1,850 | $1.73 | 19d | 1 | 1.46mi |
HOA detail condo
- Monthly dues
- $400 · $4,800/yr
- Assessments
- None detected in remarks — confirm with the listing agent.
Listing history 19 events
-
2026-06-18days on market $196,000 Active 50 DOM
-
2026-06-17days on market $196,000 Active 49 DOM
-
2026-06-16days on market $196,000 Active 48 DOM
-
2026-06-15price $196,000 Active 47 DOM
-
2026-06-15days on market $206,000 Active 47 DOM
-
2026-06-14days on market $206,000 Active 45 DOM
-
2026-06-10days on market $206,000 Active 42 DOM
-
2026-06-09days on market $206,000 Active 41 DOM
-
2026-06-08days on market $206,000 Active 40 DOM
-
2026-06-07days on market $206,000 Active 39 DOM
-
2026-06-05days on market $206,000 Active 36 DOM
-
2026-06-03days on market $206,000 Active 35 DOM
-
2026-06-03days on market $206,000 Active 34 DOM
-
2026-06-01days on market $206,000 Active 33 DOM
-
2026-05-31days on market $206,000 Active 32 DOM
-
2026-05-31pricedays on market $206,000 Active 31 DOM
-
2026-05-08price $216,000 862-char remark
-
2026-04-29$236,000 Active 862-char remark
-
1999-04-08soldstatus $58,000
ⓘ Source: listings_history table (triggers on properties + properties_extension) + one-shot
backfill from property_details.listing_events for pre-trigger history.
Tax reassessment forecast FL · Resets to sale price
- Current annual tax
- $457 · $38/mo
- Projected year-2 tax
- $1,627 · $136/mo
- Expected delta
- +$1,169/yr (+$97/mo · 255.7%)
ⓘ Screening estimate from a state-policy table — verify with the county assessor before closing.
Climate risk First Street
- Flood 6/10 Major FEMA zone X (shaded) · 57% chance over 30 yrs
- Wildfire 1/10 Low
- Heat 10/10 Extreme 7 d/yr ≥105°F today · 20 d/yr by 30 yrs out
- Wind 10/10 Extreme 99% chance of damaging wind over 30 yrs
- Air quality 2/10 Low 2 unhealthy d/yr today · 2 by 30 yrs out
Nearby sold comps map
Loading sold comps map…
Walkable amenities ~0.75 mi
Loading nearby amenities…
Taxation est. · year 1
- Rental income
- $22,899
- − Mortgage interest
- −$10,979
- − Property taxes
- −$457
- − Insurance
- −$980
- − Repairs & maintenance
- −$1,832
- − Management
- −$1,832
- − HOA
- −$4,800
- − Depreciation
- −$5,702
- Taxable loss
- −$3,683
- Est. tax savings @ 24.0%
- +$884
- After-tax cash flow
- $402/yr
For passive investors: Depreciation is non-cash, so a rental often shows a tax loss while cash-flowing — sheltering income. Rental losses are passive: they offset passive income freely, and up to $25,000/yr can offset ordinary (W-2) income if you actively participate and your MAGI is under $100k (phasing out to $0 by $150k); unused losses carry forward. On sale, claimed depreciation is recaptured at up to 25%, and gains may owe capital-gains tax (a 1031 exchange can defer both). Figures are a year-1 estimate at your 24.0% rate — not tax advice; consult a CPA.
Schools (NCES district)
- District
- Volusia
- NCES district ID
- 1201920
- Math proficiency
- 44% ▼ -9.00%
- Reading proficiency
- 49% ▼ -3.00%
- Median HH income
- $42,946
- Composite
- 39.2/100
- National rank
- #4019
- State rank
- #47 of 73 in FL
Livability — South Daytona
- Score
- 80/100
- State rank
- #114
- US rank
- #1755
Category grades
Schools grade is shown separately in the Schools card above.
Census & demographics
- Census place
- South Daytona, FL
- County
- Volusia County · 556,871 people
- City population
- 22,348
- Metro
- Deltona-Daytona Beach-Ormond Beach, FL
- Population (ZIP)
- 22,348
- Household income
- $56,862
- Rent vs Own
- Severe rent burden
- 1158.0
Population outlook (Volusia County) Hauer SSP2
- Today (2025)
- 572,749 people
- By 2030
- 598,695 · +4.5%
- By 2040
- 644,880 · +12.6%
- By 2050
- 681,451 · +19.0%
- By 2075
- 759,957 · +32.7%
- By 2100
- 778,902 · +36.0%
Race, ethnicity, and origin ACS 2023
- Neighborhood character
- Predominantly White (75%)
- Race & ethnicity
- White 75% Black 10% Hispanic / Latino 9% Two or more races 5% Asian 2%
- Hispanic origin (detail)
- Puerto Rican 4%
- Common ancestry
- Lithuanian 2% Slovak 2% Romanian 2%
- Foreign-born
- 9% · Canada, South Korea, Jamaica
- Languages at home
- 87% English-only · Spanish 7% Other Indo-European 2% German/W. Germanic 1%
Political lean MEDSL · Volusia
- 2024 margin
- Strong R (+21.8) · D 38.7% · R 60.5%
- 2008→2024 swing
- -27.4pp toward R · 2008: 5.7pp · 2024: -21.8pp
- All cycles
- 2024: R+21.8 2020: R+14.1 2016: R+13.1 2012: R+1.2 2008: D+5.7
Not yet ingested
- Civics
- —
Market trends
- HPI YoY
- ▼ -247.99%
- Current HPI
- 309.304
- Rent YoY
- ▼ -2.01%
- Metro
- Deltona-Daytona Beach-Ormond Beach, FL
- State GDP YoY
- ▲ 3.28%
- F500 in state
- 36
Industry mix (Fortune 500 HQ in FL)
| Industry | F500 HQs | Revenue |
|---|---|---|
| Industrial Technology | 2 | $29B |
|
||
| Insurance | 2 | $17B |
|
||
| Retail | 1 | $60B |
|
||
| Technology Distribution | 1 | $58B |
|
||
| Homebuilding | 1 | $35B |
|
||
| Technology Manufacturing | 1 | $35B |
|
||
Price history
+237.9% since first listed5 events — show timeline
- 2026-06-15 Price Changed $196,000 Stellar MLS as Distributed by MLS Grid
- 2026-05-29 Price Changed $206,000 Stellar MLS as Distributed by MLS Grid
- 2026-05-08 Price Changed $216,000 Stellar MLS as Distributed by MLS Grid
- 2026-04-29 Listed $236,000 Stellar MLS as Distributed by MLS Grid
- 1999-04-08 Sold (Public Records) $58,000 Public Records
Property tax history
+3.5%/yrLatest (2025): $457 · +5.9% YoY. Source: county tax records.
Cash-flow waterfall
monthlySold comps — $/sqft
last 12 mo · ≤1 miLoading sold comps…