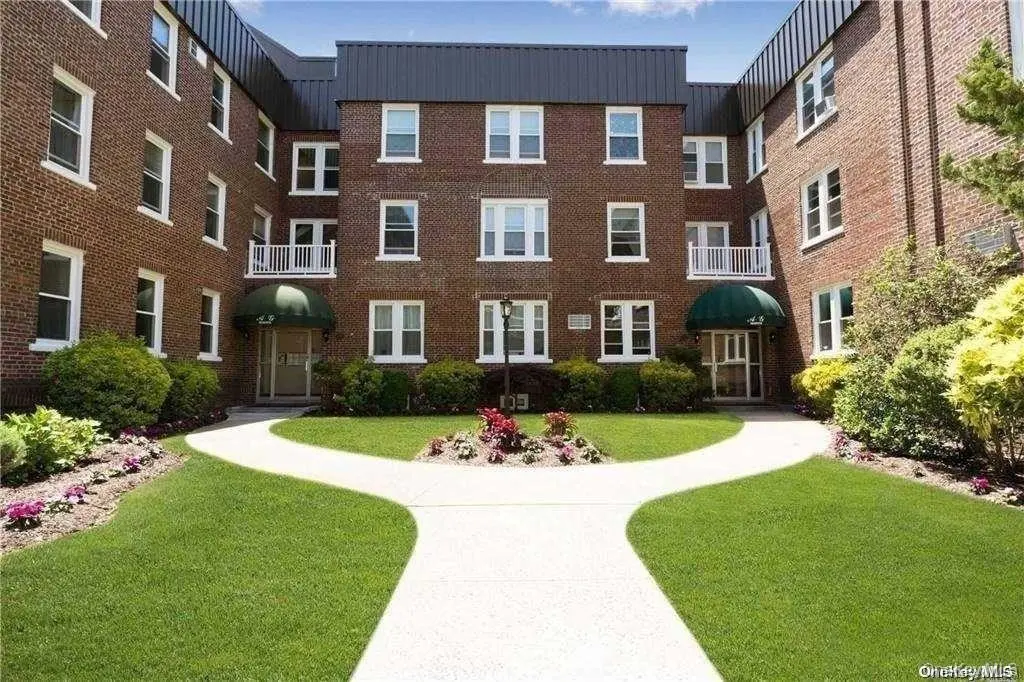
185 Atlantic Ave Unit B-10 · Lynbrook, NY
Flood risk 4/10 · Minor
- FEMA flood zone
- X (unshaded)
- Chance of flooding over 30 yrs
- 0.22%
- Est. flood insurance / yr
- $473 – $860
Fire risk 1/10 · Minimal
- Est. fire insurance / yr
- $691 – $1,283
Heat risk 6/10 · Moderate
- Hot days now (above 97°F)
- 7 days/yr
- Hot days in 30 yrs
- 15 days/yr
Wind risk 6/10 · Moderate
- Chance of severe wind over 30 yrs
- 71.0%
Air-quality risk 3/10 · Minor
- Unhealthy air days now
- 4 days/yr
- Unhealthy air days in 30 yrs
- 4 days/yr
Risk factors via First Street. Map © Google.
Why this score? — see what drove the F grade
The composite is a weighted blend of 9 inputs, each scored 0–100. Each bar is that input's sub-score; the figure is the points it added to the 100-point composite (weight × sub-score).
- ARV discount +7.5/15.0
- Schools +6.7/10.0
- 1% rule +5.4/10.0
- Livability +4.4/5.0
- Cash flow +4.3/30.0
- Condition / age +4.0/5.0
- Rent growth +2.5/5.0
- DSCR +0.0/10.0
- Appreciation +0.0/10.0
$284,900
🖨 Deal sheet 📄 Offer letter ✓ Due diligence
Listing remarks
Huge 1 Bedroom Apartment W/ High Ceilings. Parking, Gym, Laundry Room, Storage. 30 Minutes To Penn Station, Close to shopping, beaches & highway and public transportation. Must see!!!
Key facts
- Storage
- Laundry room
- Parking
Tags
Property features AI
Finance
- HOA & community: Monthly association fee; Association includes heat, hot water, water, sewer, trash, common area maintenance, grounds care, snow removal; Community amenities include fitness center, landscaping, maintained grounds, snow removal
Exterior
- Parking: Assigned parking in lot (1 space); Monthly parking fee
- Security: Security system; Video cameras
- Utilities: Electric service: PSEG; Public sewer; Sewer connected
- Home design: Stock cooperative; One level; Entry level: 2; 3 total stories
- Construction: Brick exterior
- Exterior features: Brick construction; Not waterfront
Interior
- Kitchen: Dishwasher; Gas oven; Refrigerator
- Bedrooms: Located on entry level 2
- Flooring: Wood flooring
- Bathrooms: 1 full bathroom
- Heating & cooling: Natural gas heating; Steam heat; Wall/window AC unit(s)
- Interior features: Eat-in kitchen; Entrance foyer; High ceilings; Storage
- Laundry & utility: Laundry in basement
Neighborhood map
What this means for you Summary
Snapshot
- This is a 1-bed/1.0-bath condo listed at $285k. Condition is rated good.
Deal economics
- At list price, monthly cash flow is $-760 ($-9k/yr) — negative.
- The deal already cash-flows at list — no discount required.
- Meets the 1% rule at list price ($3k rent vs $285k).
- Recommended offer: $281k (1.5% below list) — sets the bar for market timing.
Location & tenants
- Location reads 88/100 on livability (#10 in NY, #221 nationally) — a professional / high-income tenant draw. Strengths: crime A+, amenities A+, commute A+; Watch: cost of living F.
- Lynbrook Union Free School District (suburban): math 75% / reading 73% proficiency, ranked #72 of 590 in NY (top 12%) — strong family-tenant draw, lease renewals of 3-5y typical; only 8% free/reduced lunch — higher-income household profile.
- Zoned schools: Marion Street School (math 82% / reading 77%, grade A, #188 of 2,108 statewide, top 11%, 454 students, 0% FRL); Lynbrook South Middle School (math 37% / reading 67%, grade C+, #241 of 729 statewide, top 35%, 388 students, 13% FRL); Lynbrook Senior High School (math 97% / reading 82%, grade A+, #265 of 1,100 statewide, top 26%, 850 students, 19% FRL) — zoned schools at 11% FRL track the district average.
- Market conditions: 133 active listings in the ZIP; 13 comparable units currently listed for rent nearby; rentals at typical pace (median 25d on market — plan ~3-4 weeks tenant-placement turnaround); high-income renter base; 824 units permitted in Nassau County in 2024 (153 in 5+ unit buildings).
Forward outlook
- Local home prices are declining (-3.0%/yr); year-one equity from $2k of loan paydown is wiped out by about $9k of value loss. Plan a longer hold.
- Nassau County population projected at +7% by 2050 — modest demand growth; plan on rents tracking national, not racing it.
Negotiation context
- It's been on market 29 days — a 2% lower offer ($281k) is reasonable based on typical stale-listing flexibility.
Risks & watch-outs
- Watch-outs: HOA is 38% of rent; built in 1920 — expect roof / HVAC / electrical / plumbing capex.
- Climate carrying-cost: major wind risk, 71% chance of damaging wind over 30y; extreme-heat days projected 7→15/yr by 2055 (HVAC capex compounding) — expect insurance premiums to compound above CPI over the hold.
Questions for the listing agent
- What do current leases actually rent for vs. the listed asking? Can we see a recent rent roll and the last 12 months of T-12 income?
- Built in 1920 — when were the roof, HVAC, electrical panel, plumbing, and water heater last replaced?
- What does the HOA fee cover, when was the last increase, and are there any pending special assessments or reserve-fund shortfalls?
- Any open or pending special assessments — roof, HVAC, plumbing, elevator, façade? What's the per-unit balance and payoff schedule, and is the seller paying it off at close or rolling it to the buyer?
- Is there a deadline driving the sale (1031 exchange, divorce, estate, relocation)? That informs how much negotiation room exists.
- Schools are A-rated — typically a magnet for longer-tenancy family renters. What's the average tenant stay here, and is there a school-zone premium baked into asking?
- The area grade is low — what's the realistic commute time and amenity access for the typical tenant pool here? Any planned neighborhood developments (good or bad) we should know about?
- What's the average days-on-market for RENTAL listings here right now (not sales)? A rising rental-DOM trend means longer vacancies and softer asking-rent achievability than the comps imply.
- What's the recent tenant-quality profile in this submarket — average credit score on applications, eviction rate, late-payment / NSF rate, and stable-employment percentage? A property-management company in the area should have these aggregated.
- How much new apartment / multifamily construction is in the pipeline within 1–3 miles? Heavy new supply (>2% of stock underway) typically softens rents 12–24 months out; light construction supports rent growth.
Investment metrics
- 1% rule
- 1.04% ✓
- Cap rate
- 3.09%
- Cash-on-cash
- -11.43%
- DSCR
- 0.49
- GRM
- 8.0
CMA / ARV
No comps found within radius.
Projected returns pro-forma
-3.0% appreciation · 3.0% rent growth · sell at horizon
- IRR
- -36.7%
- Equity multiple
- -0.18×
- Total profit
- $-93,821
- Equity at exit
- $42,480
- IRR
- -48.9%
- Equity multiple
- -0.77×
- Total profit
- $-141,010
- Equity at exit
- $24,633
Cash invested: $79,772 (down + closing). Projections, not guarantees.
Landlord ↔ Tenant lean methodology
- Overall (STATE)
- 15 Strongly Tenant-Friendly
- State New York
- 15 Strongly Tenant-Friendly · D+10
- County
- — inherits STATE
- City
- — inherits STATE
ZIP-level market 11563
- Active inventory
- 133
- Price-to-rent
- 8.0×
Monthly cashflow live
- Estimated rent
- $2,961 high interval (Pro) →
- Mortgage (P&I)
- −$1,494
- Tax est. 1.5%
- −$356 /mo · $4,274/yr
- Insurance
- −$119
- HOA est. from 2 same-building comps
- −$1,130
- Vacancy / Maint / Mgmt
- −$622
- Net cashflow
- $-760
Break-even live
UW: 25.0% down · 7.5% · 30yr · 1.5% tax · 5.0% vac · 8.0% maint · 8.0% mgmt
Financing live
Cash to close
- Down payment
- $71,225
- Closing costs
- $8,547
- Reserves months
- —
- Total cash needed
- —
Loan-product check · same deal, 3 products live
Conventional
25% down · 7.5% · 30yr
- Down + closing
- —
- Monthly P&I
- —
- Monthly cashflow
- —
- DSCR
- —
- Eligible?
- —
Personal DTI + credit; lowest rate.
DSCR
20% down · 8.5% · 30yr
- Down + closing
- —
- Monthly P&I
- —
- Monthly cashflow
- —
- DSCR
- —
- Eligible?
- —
No personal income docs; deal must DSCR.
Hard money
10% down · 12.0% · 12mo
- Down + closing
- —
- Monthly P&I
- —
- Monthly cashflow
- —
- DSCR
- —
- Eligible?
- —
Short-term bridge; refi at stabilization.
Rent comps 13 comps
| Address | Beds | Baths | Sqft | Rent | $/sqft | DOM | Units | Dist |
|---|---|---|---|---|---|---|---|---|
| 24 Doxsey Pl Unit 3 Lynbrook, NY | 2.0 | 1.0 | 900 | $3,300 | $3.67 | 24d | 1 | 0.14mi |
| 112 Atlantic Ave Apt 71 Lynbrook, NY | 2.0 | 1.0 | 760 | $3,000 | $3.95 | 13d | 1 | 0.20mi |
| 318 Earle Ave Unit 2 Lynbrook, NY | 1.0 | 1.0 | 600 | $2,500 | $4.17 | 24d | 1 | 0.75mi |
| 157 Hempstead Ave Unit B6 Lynbrook, NY | 1.0 | 1.0 | 700 | $2,700 | $3.86 | 24d | 1 | 0.82mi |
| 65 Prospect Ave Apt 15W Lynbrook, NY | 2.0 | 2.0 | 1060 | $3,680 | $3.47 | 21d | 1 | 0.85mi |
| 65 Prospect Ave Unit 2W Lynbrook, NY | 1.0 | 1.0 | 800 | $3,055 | $3.82 | 43d | 1 | 0.85mi |
| 111 S Centre Ave Apt 1SS Rockville Centre, NY | 2.0 | 1.0 | 950 | $3,250 | $3.42 | 4d | 1 | 1.04mi |
| 80 N Centre Ave Rockville Centre, NY | 3.0 | 1.0–3.5 | 1254 | $3,962 | $3.16 | 1d | 1 | 1.15mi |
| 67 N Prospect Ave Unit 16C Lynbrook, NY | 1.0 | 1.0 | 785 | $3,030 | $3.86 | 18d | 1 | 1.24mi |
| 8 Winthrop St Unit 2 Lynbrook, NY | 1.0 | 1.0 | 600 | $2,100 | $3.50 | 43d | 1 | 1.24mi |
| 141 Munro Blvd Valley Stream, NY | 1.0 | 1.0 | 1000 | $1,300 | $1.30 | 17d | 1 | 1.40mi |
| 8 Roswell Ave Oceanside, NY | 2.0 | 1.5 | 741 | $3,100 | $4.18 | 24d | 1 | 1.45mi |
| 45 Grand Ave Rockville Centre, NY | 2.0 | 1.0 | 800 | $3,000 | $3.75 | 24d | 1 | 1.49mi |
HOA detail condo
- Monthly dues
- $0 · $0/yr
- Likely covers
- gym
- Assessments
- None detected in remarks — confirm with the listing agent.
Listing history 14 events
-
2026-06-18days on market $284,900 Active 29 DOM
-
2026-06-17days on market $284,900 Active 28 DOM
-
2026-06-16days on market $284,900 Active 27 DOM
-
2026-06-15days on market $284,900 Active 26 DOM
-
2026-06-13pricedays on market $284,900 Active 24 DOM
-
2026-06-09days on market $289,000 Active 20 DOM
-
2026-06-08days on market $289,000 Active 19 DOM
-
2026-06-07days on market $289,000 Active 18 DOM
-
2026-06-04days on market $289,000 Active 15 DOM
-
2026-06-03days on market $289,000 Active 14 DOM
-
2026-06-02days on market $289,000 Active 13 DOM
-
2026-06-01days on market $289,000 Active 12 DOM
-
2026-05-31days on market $289,000 Active 11 DOM
-
2026-05-20$289,000 Active
ⓘ Source: listings_history table (triggers on properties + properties_extension) + one-shot
backfill from property_details.listing_events for pre-trigger history.
Climate risk First Street
- Flood 4/10 Moderate FEMA zone X (unshaded) · 22% chance over 30 yrs
- Wildfire 1/10 Low
- Heat 6/10 Major 7 d/yr ≥97°F today · 15 d/yr by 30 yrs out
- Wind 6/10 Major 71% chance of damaging wind over 30 yrs
- Air quality 3/10 Moderate 4 unhealthy d/yr today · 4 by 30 yrs out
Nearby sold comps map
Loading sold comps map…
Walkable amenities ~0.75 mi
Loading nearby amenities…
Taxation est. · year 1
- Rental income
- $35,530
- − Mortgage interest
- −$15,959
- − Property taxes
- −$4,274
- − Insurance
- −$1,424
- − Repairs & maintenance
- −$2,842
- − Management
- −$2,842
- − HOA
- −$13,560
- − Depreciation
- −$8,288
- Taxable loss
- −$13,660
- Est. tax savings @ 24.0%
- +$3,278
- After-tax cash flow
- $-5,840/yr
For passive investors: Depreciation is non-cash, so a rental often shows a tax loss while cash-flowing — sheltering income. Rental losses are passive: they offset passive income freely, and up to $25,000/yr can offset ordinary (W-2) income if you actively participate and your MAGI is under $100k (phasing out to $0 by $150k); unused losses carry forward. On sale, claimed depreciation is recaptured at up to 25%, and gains may owe capital-gains tax (a 1031 exchange can defer both). Figures are a year-1 estimate at your 24.0% rate — not tax advice; consult a CPA.
Condition & rehab AI · 12 photos
This well-maintained apartment is move-in ready with a good condition score and potential for minor updates to enhance its resale and rental value.
Value-add opportunities
- Both Painting the interior walls — Fresh paint can enhance the home's curb appeal and interior aesthetics.
- Both Updating the kitchen appliances — Modern appliances can attract more buyers and renters.
- Both Upgrading the bathroom fixtures — Newer fixtures can improve functionality and appeal to potential buyers and renters.
- Both Landscaping improvements — Enhanced landscaping can increase the home's curb appeal and attract more interest from potential buyers and renters.
Renovation cost estimate screening
Value-add ROI direction
- Both Painting the interior walls — Fresh paint can enhance the home's curb appeal and interior aesthetics. ↑
- Both Updating the kitchen appliances — Modern appliances can attract more buyers and renters. ↑
- Both Upgrading the bathroom fixtures — Newer fixtures can improve functionality and appeal to potential buyers and renters. ↑
- Both Landscaping improvements — Enhanced landscaping can increase the home's curb appeal and attract more interest from potential buyers and renters. ↑
ⓘ Cost ranges are severity-bucket heuristics (US national rule-of-thumb). Get contractor quotes + a written scope before underwriting a rehab budget.
Schools (NCES district)
- District
- Lynbrook Union Free School District
- NCES district ID
- 3617910
- Math proficiency
- 75% ▬ 0.00%
- Reading proficiency
- 73% ▲ 2.00%
- Median HH income
- $93,436
- Composite
- 66.85/100
- National rank
- #404
- State rank
- #72 of 590 in NY
Livability — Lynbrook
- Score
- 88/100
- State rank
- #10
- US rank
- #221
Category grades
Schools grade is shown separately in the Schools card above.
Census & demographics
- Census place
- Lynbrook, NY
- County
- Nassau County · 653,051 people
- City population
- 22,899
- Metro
- New York-Newark-Jersey City, NY-NJ-PA
- Population (ZIP)
- 22,899
- Household income
- $136,887
- Rent vs Own
- Severe rent burden
- 618.0
Population outlook (Nassau County) Hauer SSP2
- Today (2025)
- 1,409,302 people
- By 2030
- 1,431,482 · +1.6%
- By 2040
- 1,471,607 · +4.4%
- By 2050
- 1,502,845 · +6.6%
- By 2075
- 1,575,403 · +11.8%
- By 2100
- 1,554,356 · +10.3%
Race, ethnicity, and origin ACS 2023
- Neighborhood character
- Diverse neighborhood (Simpson 0.56)
- Race & ethnicity
- White 62% Hispanic / Latino 21% Two or more races 10% Asian 7% Black 7%
- Hispanic origin (detail)
- Mexican 1% Puerto Rican 4% Cuban 2% Dominican 3%
- Common ancestry
- Hispanic 2% Romanian 2% Scotch-Irish 2%
- Foreign-born
- 17% · Canada, China, Jamaica
- Languages at home
- 74% English-only · Spanish 13% Other Indo-European 7% French/Haitian/Cajun 2%
Political lean MEDSL · Nassau
- 2024 margin
- Toss-up / Even · D 47.9% · R 52.1%
- 2008→2024 swing
- -12.6pp toward R · 2008: 8.4pp · 2024: -4.2pp
- All cycles
- 2024: R+4.2 2020: D+9.5 2016: D+5.3 2012: D+6.7 2008: D+8.4
Not yet ingested
- Civics
- —
Market trends
- HPI YoY
- ▼ -652.00%
- Current HPI
- 317.1455
- Rent YoY
- —
- Metro
- New York-Newark-Jersey City, NY-NJ-PA
- State GDP YoY
- ▲ 2.60%
- F500 in state
- 92
Industry mix (Fortune 500 HQ in NY)
| Industry | F500 HQs | Revenue |
|---|---|---|
| Financial Services | 10 | $950B |
|
||
| Consumer Goods | 9 | $162B |
|
||
| Insurance | 4 | $225B |
|
||
| Telecommunications | 2 | $144B |
|
||
| Pharmaceuticals | 2 | $112B |
|
||
| Media / Entertainment | 2 | $69B |
|
||
Price history
1 event — show timeline
- 2026-05-20 Listed $289,000 OneKey® MLS as Distributed by MLS Grid
Cash-flow waterfall
monthlySold comps — $/sqft
last 12 mo · ≤1 miLoading sold comps…