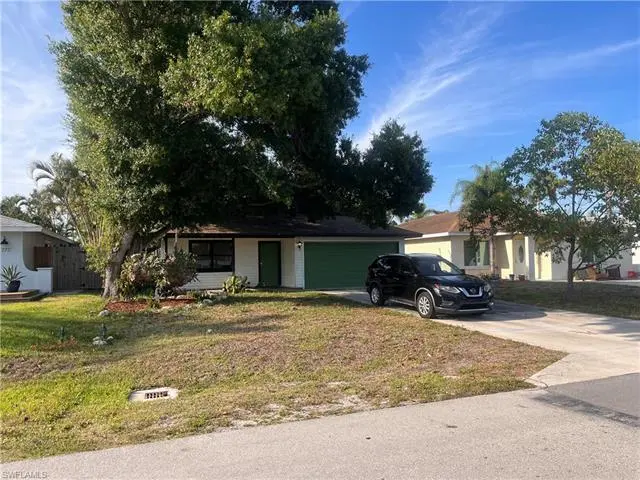
781 107th Ave · Naples Park, FL
Flood risk 7/10 · Major
- FEMA flood zone
- X (shaded)
- Chance of flooding over 30 yrs
- 0.92%
- Est. flood insurance / yr
- $507 – $1,088
Fire risk 1/10 · Minimal
- Est. fire insurance / yr
- $947 – $1,759
Heat risk 10/10 · Severe
- Hot days now (above 107°F)
- 7 days/yr
- Hot days in 30 yrs
- 30 days/yr
Wind risk 10/10 · Severe
- Chance of severe wind over 30 yrs
- 99.0%
Air-quality risk 2/10 · Minimal
- Unhealthy air days now
- 1 days/yr
- Unhealthy air days in 30 yrs
- 1 days/yr
Risk factors via First Street. Map © Google.
Why this score? — see what drove the B grade
The composite is a weighted blend of 9 inputs, each scored 0–100. Each bar is that input's sub-score; the figure is the points it added to the 100-point composite (weight × sub-score).
- Cash flow +30.0/30.0
- DSCR +10.0/10.0
- 1% rule +8.6/10.0
- ARV discount +7.5/15.0
- Schools +5.0/10.0
- Rent growth +4.7/5.0
- Livability +3.2/5.0
- Condition / age +2.5/5.0
- Appreciation +0.0/10.0
$565,000
🖨 Deal sheet 📄 Offer letter ✓ Due diligence
Listing remarks
One of Naples saw after Community is Naples Park. Enjoy this gorgeous three bedroom two bathroom brand new towel throughout two renovated bathroom bathrooms for your families enjoyment this house will not last the Lott value alone is worth more than the less price.
Key facts
- 2 garage spots
- Built 1986
- Listed 16 days
Property features AI
Finance
- Other: Single-unit property (1 unit/floor, 1 unit in building, 1 unit in complex); 1 total floor; Possession at closing
- HOA & community: Non-gated community; No HOA maintenance; No HOA amenities
Exterior
- Parking: Attached garage; 2 garage spaces; 2+ parking spaces
- Utilities: Central water; Central sewer; Cable available
- Home design: Residential single-family home; 1 story (ranch); Built in 1986; Located in Naples Park development
- Construction: Wood frame construction
- Exterior features: Shingle roof; Awning windows; Wood siding exterior; Storm protection described in remarks; Regular lot; Central irrigation; Rear exposure facing north
Interior
- Kitchen: Cooktop; Microwave; Refrigerator; Disposal; Pantry
- Bedrooms: 3 bedrooms; Split bedroom floor plan
- Flooring: Tile
- Bathrooms: 2 full bathrooms; Master bathroom with shower only
- Heating & cooling: Central electric heat; Central electric air conditioning; Ceiling fans
- Interior features: Window coverings; Pantry; Dining area combined with living; Screened lanai/porch; Screened porch (guest house description); Auto garage door; Cooktop; Disposal; Microwave; Refrigerator; Smoke detector; Washer; Unfurnished
- Laundry & utility: Washer
Neighborhood map
What this means for you Summary
Snapshot
- This is a 3-bed/2.0-bath single-family listed at $565k.
Deal economics
- At list price, monthly cash flow is $3k ($31k/yr) — positive.
- The deal already cash-flows at list — no discount required.
- Meets the 1% rule at list price ($8k rent vs $565k).
- Recommended offer: $557k (1.5% below list) — sets the bar for market timing.
Location & tenants
- Location reads 64/100 on livability (#696 in FL) — a middle-class / working-renter tenant base. Strengths: crime A+, housing A-, employment B+; Watch: health & safety D, schools F, amenities F.
- Collier (suburban): math 60% / reading 56% proficiency, ranked #16 of 73 in FL (top 22%) — acceptable for families but not a draw, mixed tenant base, ~2y average lease.
- Market conditions: Rents rising fast (+8.7%/yr); 679 active listings in the ZIP; 40 comparable units currently listed for rent nearby; rentals at typical pace (median 24d on market — plan ~3-4 weeks tenant-placement turnaround); high-income renter base; 3,520 units permitted in Collier County in 2024 (959 in 5+ unit buildings).
- At $7,682/mo this rent would consume 77% of the median local household income ($119k/yr) (locally 237% of renters already pay >50% of income on rent) — very limited rent-growth headroom before tenants either downsize or default.
Forward outlook
- Local home prices are declining (-3.0%/yr); year-one equity from $4k of loan paydown is wiped out by about $17k of value loss. Plan a longer hold.
- Collier County population projected at +30% by 2050 — long-run rental-demand tailwind backs the buy-and-hold thesis.
- At projected returns (-3.0% appreciation + 8.0% rent growth), your $158k cash investment doubles in ~6 years — after that, you're playing with house money.
Negotiation context
- It's been on market 16 days — a 2% lower offer ($557k) is reasonable based on typical stale-listing flexibility.
- 2 sale attempts since 16y ago with the ask held roughly flat each time — persistent listings suggest the price (not the market) is what's stuck; bring a comps-based counter.
- Current owner paid $135k; list at $565k implies a 319% gain — meaningful room to come down on a strong offer.
Risks & watch-outs
- Watch-outs: flood insurance adds $66/mo.
- Climate carrying-cost: major flood risk; severe wind risk, 99% chance of damaging wind over 30y; extreme-heat days projected 7→30/yr by 2055 (HVAC capex compounding) — expect insurance premiums to compound above CPI over the hold.
Questions for the listing agent
- What's the actual annual flood-insurance premium (NFIP or private), and is the property in a SFHA with mandatory coverage?
- Is there a deadline driving the sale (1031 exchange, divorce, estate, relocation)? That informs how much negotiation room exists.
- Schools are F-rated, which usually means shorter tenancies and higher turnover. Who's the typical renter profile here, and what's been the actual vacancy rate?
- What's the average days-on-market for RENTAL listings here right now (not sales)? A rising rental-DOM trend means longer vacancies and softer asking-rent achievability than the comps imply.
- What's the recent tenant-quality profile in this submarket — average credit score on applications, eviction rate, late-payment / NSF rate, and stable-employment percentage? A property-management company in the area should have these aggregated.
- How much new for-sale + rental construction is in the pipeline within 1–3 miles? Heavy new supply typically softens prices + rents 12–24 months out; constrained supply supports both.
Investment metrics
- 1% rule
- 1.36% ✓
- Cap rate
- 11.87%
- Cash-on-cash
- 19.92%
- DSCR
- 1.89
- GRM
- 6.1
CMA / ARV
No comps found within radius.
Projected returns pro-forma
-3.0% appreciation · 8.0% rent growth · sell at horizon
- IRR
- 16.6%
- Equity multiple
- 1.71×
- Total profit
- $111,917
- Equity at exit
- $84,243
- IRR
- 28.4%
- Equity multiple
- 4.11×
- Total profit
- $491,601
- Equity at exit
- $48,851
Cash invested: $158,200 (down + closing). Projections, not guarantees.
Landlord ↔ Tenant lean methodology
- Overall (STATE)
- 87 Strongly Landlord-Friendly
- State Florida
- 87 Strongly Landlord-Friendly · R+3
- County
- — inherits STATE
- City
- — inherits STATE
ZIP-level market 34108
- Rents YoY
- 8.7%
- Active inventory
- 679
- Price-to-rent
- 6.1×
Monthly cashflow live
- Estimated rent
- $7,682 high interval (Pro) →
- Mortgage (P&I)
- −$2,963
- Tax from tax record
- −$245 /mo · $2,934/yr
- Insurance
- −$235
- Flood insurance flood zone
- −$66 /mo · $798/yr
- HOA
- −$0
- Vacancy / Maint / Mgmt
- −$1,613
- Net cashflow
- $2,559
Break-even live
UW: 25.0% down · 7.5% · 30yr · 1.5% tax · 5.0% vac · 8.0% maint · 8.0% mgmt
Financing live
Cash to close
- Down payment
- $141,250
- Closing costs
- $16,950
- Reserves months
- —
- Total cash needed
- —
Loan-product check · same deal, 3 products live
Conventional
25% down · 7.5% · 30yr
- Down + closing
- —
- Monthly P&I
- —
- Monthly cashflow
- —
- DSCR
- —
- Eligible?
- —
Personal DTI + credit; lowest rate.
DSCR
20% down · 8.5% · 30yr
- Down + closing
- —
- Monthly P&I
- —
- Monthly cashflow
- —
- DSCR
- —
- Eligible?
- —
No personal income docs; deal must DSCR.
Hard money
10% down · 12.0% · 12mo
- Down + closing
- —
- Monthly P&I
- —
- Monthly cashflow
- —
- DSCR
- —
- Eligible?
- —
Short-term bridge; refi at stabilization.
Rent comps 40 comps
| Address | Beds | Baths | Sqft | Rent | $/sqft | DOM | Units | Dist |
|---|---|---|---|---|---|---|---|---|
| 792 108th Ave N Naples, FL | 3.0 | 2.0 | 1446 | $8,500 | $5.88 | 23d | 1 | 0.04mi |
| 754 107th Ave N Naples, FL | 3.0 | 2.5 | 1994 | $5,790 | $2.90 | 23d | 1 | 0.08mi |
| 760 106th Ave N Naples, FL | 3.0 | 2.0 | 1968 | $12,000 | $6.10 | 23d | 1 | 0.11mi |
| 724 108th Ave N Unit 1073495P Naples, FL | 3.0 | 2.0 | 1151 | $4,915 | $4.27 | 14d | 1 | 0.15mi |
| 749 105th Ave N Naples, FL | 3.0 | 2.0 | 1394 | $4,000 | $2.87 | 23d | 1 | 0.15mi |
| 838 109th Ave N Naples, FL | 3.0 | 2.0 | 1168 | $5,299 | $4.54 | 23d | 1 | 0.16mi |
| 851 108th Ave N Unit 1504157P Naples, FL | 3.0 | 3.0 | 2185 | $7,796 | $3.57 | 23d | 1 | 0.17mi |
| 712 108th Ave N Naples, FL | 3.0 | 3.0 | 1997 | $12,500 | $6.26 | 23d | 1 | 0.18mi |
| 744 110th Ave N Naples, FL | 3.0 | 2.0 | 1596 | $4,500 | $2.82 | 23d | 1 | 0.18mi |
| 822 105th Ave N Naples, FL | 4.0 | 3.0 | 2200 | $19,000 | $8.64 | 23d | 1 | 0.19mi |
| 828 110th Ave N Unit 1504175P Naples, FL | 4.0 | 4.0 | 2152 | $11,370 | $5.28 | 21d | 1 | 0.19mi |
| 731 104th Ave N Naples, FL | 2.0 | 2.0 | 1388 | $12,000 | $8.65 | 23d | 1 | 0.23mi |
| 698 107th Ave N Naples, FL | 4.0 | 3.0 | 1487 | $3,800 | $2.56 | 23d | 1 | 0.23mi |
| 714 105th Ave N Naples, FL | 3.0 | 2.0 | 1491 | $4,150 | $2.78 | 23d | 1 | 0.23mi |
| 692 106th Ave N Unit 1387168P Naples, FL | 3.0 | 3.0 | 1356 | $6,573 | $4.85 | 14d | 1 | 0.25mi |
| 685 107th Ave N Unit 1504184P Naples, FL | 4.0 | 3.0 | 2238 | $8,819 | $3.94 | 21d | 1 | 0.26mi |
| 707 104th Ave N Naples, FL | 3.0 | 2.0 | 1745 | $14,500 | $8.31 | 23d | 1 | 0.26mi |
| 693 105th Ave N Naples, FL | 4.0 | 3.0 | 2014 | $10,500 | $5.21 | 23d | 1 | 0.26mi |
| 673 107th Ave N Naples, FL | 3.0 | 2.0 | 1428 | $3,850 | $2.70 | 23d | 1 | 0.29mi |
| 856 104th Ave N Naples, FL | 3.0 | 2.0 | 1398 | $3,750 | $2.68 | 23d | 1 | 0.29mi |
| 706 111th Ave N Naples, FL | 2.0 | 2.0 | 1080 | $1,850 | $1.71 | 23d | 1 | 0.29mi |
| 669 107th Ave N Unit 1504183P Naples, FL | 3.0 | 2.0 | 1614 | $3,571 | $2.21 | 23d | 1 | 0.30mi |
| 663 106th Ave N Unit 1504161P Naples, FL | 3.0 | 2.0 | 1539 | $7,887 | $5.12 | 14d | 1 | 0.32mi |
| 715 102nd Ave N Unit 1504167P Naples, FL | 3.0 | 3.0 | 1991 | $7,661 | $3.85 | 14d | 1 | 0.35mi |
| 663 110th Ave N Naples, FL | 4.0 | 3.0 | 1936 | $8,500 | $4.39 | 23d | 1 | 0.37mi |
| 757 101st Ave N Naples, FL | 3.0 | 2.0 | 1366 | $3,900 | $2.86 | 23d | 1 | 0.38mi |
| 691 102nd Ave N Naples, FL | 3.0 | 2.0 | 1311 | $7,000 | $5.34 | 23d | 1 | 0.39mi |
| 625 107th Ave N Unit 1534807P Naples, FL | 4.0 | 2.5 | 2012 | $8,779 | $4.36 | 23d | 1 | 0.40mi |
| 630 105th Ave N Naples, FL | 4.0 | 2.0 | 2119 | $3,950 | $1.86 | 23d | 1 | 0.42mi |
| 10022 8th St N Unit 22 Naples, FL | 2.0 | 2.0 | 1250 | $2,250 | $1.80 | 23d | 1 | 0.43mi |
| 645 103rd Ave N Unit 1534775P Naples, FL | 4.0 | 2.0 | 1840 | $8,513 | $4.63 | 21d | 1 | 0.43mi |
| 612 106th Ave N Unit 1073496P Naples, FL | 3.0 | 2.0 | 1550 | $6,772 | $4.37 | 14d | 1 | 0.44mi |
| 10022 8th St N Unit B Naples, FL | 2.0 | 2.0 | 1249 | $2,225 | $1.78 | 14d | 1 | 0.44mi |
| 637 103rd Ave N Naples, FL | 3.0 | 2.0 | 1669 | $3,100 | $1.86 | 23d | 1 | 0.44mi |
| 772 100th Ave N Naples, FL | 3.0 | 2.0 | 1712 | $3,200 | $1.87 | 23d | 1 | 0.47mi |
| 593 106th Ave N Naples, FL | 3.0 | 2.0 | 1800 | $9,000 | $5.00 | 23d | 1 | 0.48mi |
| 670 101st Ave N Naples, FL | 4.0 | 3.0 | 2208 | $15,000 | $6.79 | 23d | 1 | 0.49mi |
| 610 111th Ave N Unit 1534774P Naples, FL | 4.0 | 2.5 | 1905 | $6,664 | $3.50 | 14d | 1 | 0.49mi |
| 801 99th Ave N Naples, FL | 2.0 | 2.0 | 1781 | $3,500 | $1.97 | 23d | 1 | 0.50mi |
| 602 111th Ave N Naples, FL | 2.0 | 2.0 | 1104 | $4,000 | $3.62 | 23d | 1 | 0.51mi |
Listing history 5 events
-
2026-05-20status Pending
-
2026-05-04$565,000 Active
-
2011-07-12soldstatus $135,000
-
2010-06-18$149,900
-
1995-05-02soldstatus $93,000
ⓘ Source: listings_history table (triggers on properties + properties_extension) + one-shot
backfill from property_details.listing_events for pre-trigger history.
Tax reassessment forecast FL · Resets to sale price
- Current annual tax
- $2,934 · $245/mo
- Projected year-2 tax
- $4,690 · $391/mo
- Expected delta
- +$1,755/yr (+$146/mo · 59.8%)
ⓘ Screening estimate from a state-policy table — verify with the county assessor before closing.
Climate risk First Street
- Flood 7/10 Severe FEMA zone X (shaded) · 92% chance over 30 yrs
- Wildfire 1/10 Low
- Heat 10/10 Extreme 7 d/yr ≥107°F today · 30 d/yr by 30 yrs out
- Wind 10/10 Extreme 99% chance of damaging wind over 30 yrs
- Air quality 2/10 Low 1 unhealthy d/yr today · 1 by 30 yrs out
Nearby sold comps map
Loading sold comps map…
Walkable amenities ~0.75 mi
Loading nearby amenities…
Taxation est. · year 1
- Rental income
- $92,181
- − Mortgage interest
- −$31,649
- − Property taxes
- −$2,934
- − Insurance
- −$3,622
- − Repairs & maintenance
- −$7,374
- − Management
- −$7,374
- − Depreciation
- −$16,436
- Taxable income
- $22,790
- Est. tax owed @ 24.0%
- −$5,470
- After-tax cash flow
- $25,242/yr
For passive investors: Depreciation is non-cash, so a rental often shows a tax loss while cash-flowing — sheltering income. Rental losses are passive: they offset passive income freely, and up to $25,000/yr can offset ordinary (W-2) income if you actively participate and your MAGI is under $100k (phasing out to $0 by $150k); unused losses carry forward. On sale, claimed depreciation is recaptured at up to 25%, and gains may owe capital-gains tax (a 1031 exchange can defer both). Figures are a year-1 estimate at your 24.0% rate — not tax advice; consult a CPA.
Schools (NCES district)
- District
- Collier
- NCES district ID
- 1200330
- Math proficiency
- 60% ▼ -4.00%
- Reading proficiency
- 56% ▼ -2.00%
- Median HH income
- $58,275
- Composite
- 50.23/100
- National rank
- #1892
- State rank
- #16 of 73 in FL
Livability — Naples Park
- Score
- 64/100
- State rank
- #696
- US rank
- #14564
Category grades
Schools grade is shown separately in the Schools card above.
Census & demographics
- Census place
- Naples Park, FL
- County
- Collier County · 396,295 people
- Metro
- Naples-Marco Island, FL
- Population (ZIP)
- 16,237
- Household income
- $119,212
- Rent vs Own
- Severe rent burden
- 237.0
Population outlook (Collier County) Hauer SSP2
- Today (2025)
- 420,858 people
- By 2030
- 450,054 · +6.9%
- By 2040
- 502,232 · +19.3%
- By 2050
- 544,932 · +29.5%
- By 2075
- 627,203 · +49.0%
- By 2100
- 659,015 · +56.6%
Race, ethnicity, and origin ACS 2023
- Neighborhood character
- Predominantly White (87%)
- Race & ethnicity
- White 87% Hispanic / Latino 8% Two or more races 7% Asian 1% Black 1%
- Hispanic origin (detail)
- Mexican 2% Cuban 3%
- Common ancestry
- Romanian 5% Lithuanian 3% Slovak 3%
- Foreign-born
- 16% · Canada, Dominican Republic, South Korea
- Languages at home
- 86% English-only · Spanish 6% Russian/Polish/Slavic 2% Other Indo-European 2%
Political lean MEDSL · Collier
- 2024 margin
- Solid R (+33.1) · D 33.1% · R 66.2%
- 2008→2024 swing
- -10.6pp toward R · 2008: -22.5pp · 2024: -33.1pp
- All cycles
- 2024: R+33.1 2020: R+24.7 2016: R+26.0 2012: R+30.1 2008: R+22.5
Not yet ingested
- Civics
- —
Market trends
- HPI YoY
- ▼ -587.97%
- Current HPI
- 275.1872
- Rent YoY
- ▲ 8.74%
- Metro
- Naples-Marco Island, FL
- State GDP YoY
- ▲ 3.28%
- F500 in state
- 36
Industry mix (Fortune 500 HQ in FL)
| Industry | F500 HQs | Revenue |
|---|---|---|
| Industrial Technology | 2 | $29B |
|
||
| Insurance | 2 | $17B |
|
||
| Retail | 1 | $60B |
|
||
| Technology Distribution | 1 | $58B |
|
||
| Homebuilding | 1 | $35B |
|
||
| Technology Manufacturing | 1 | $35B |
|
||
Price history
+507.5% since first listed5 events — show timeline
- 2026-05-20 Pending — NAPLESMLS
- 2026-05-04 Listed $565,000 NAPLESMLS
- 2011-07-12 Sold (Public Records) $135,000 Public Records
- 2010-06-18 Listed $149,900 NAPLESMLS
- 1995-05-02 Sold (Public Records) $93,000 Public Records
Cash-flow waterfall
monthlySold comps — $/sqft
last 12 mo · ≤1 miLoading sold comps…