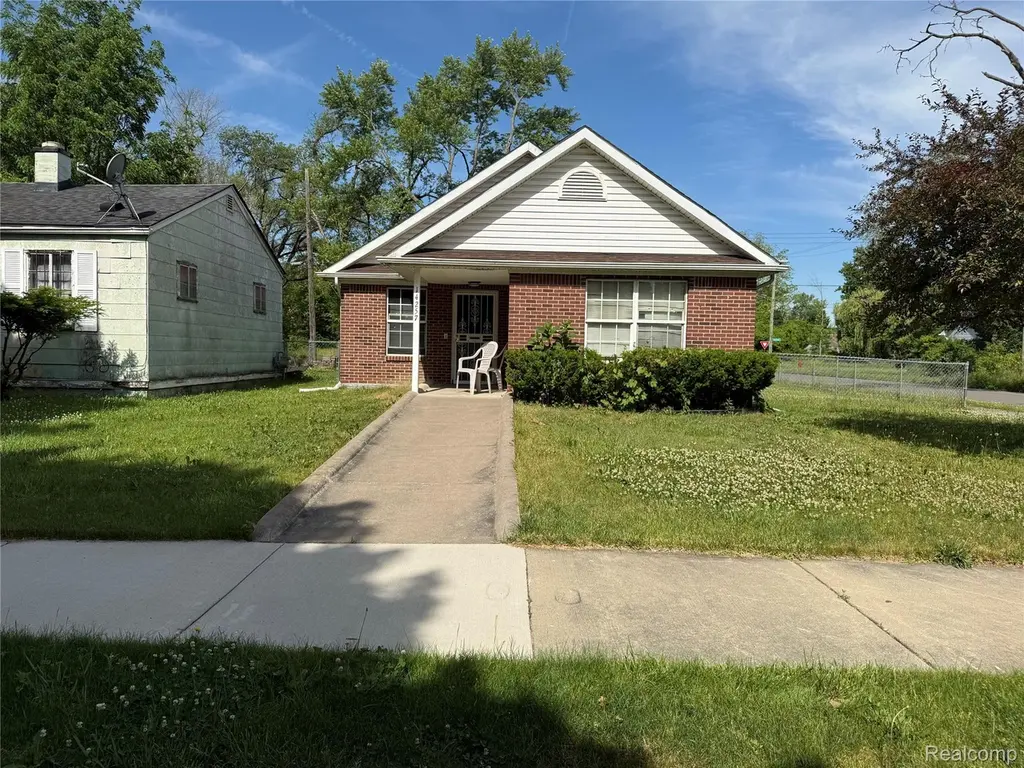
14257 Fielding St · Detroit, MI
Flood risk 1/10 · Minimal
- FEMA flood zone
- X (unshaded)
- Chance of flooding over 30 yrs
- 0.0%
- Est. flood insurance / yr
- $473 – $860
Fire risk 1/10 · Minimal
- Est. fire insurance / yr
- $784 – $1,456
Heat risk 3/10 · Minor
- Hot days now (above 99°F)
- 7 days/yr
- Hot days in 30 yrs
- 15 days/yr
Wind risk 2/10 · Minimal
- Chance of severe wind over 30 yrs
- —
Air-quality risk 3/10 · Minor
- Unhealthy air days now
- 2 days/yr
- Unhealthy air days in 30 yrs
- 5 days/yr
Risk factors via First Street. Map © Google.
Why this score? — see what drove the D grade
The composite is a weighted blend of 9 inputs, each scored 0–100. Each bar is that input's sub-score; the figure is the points it added to the 100-point composite (weight × sub-score).
- Cash flow +19.7/30.0
- 1% rule +8.1/10.0
- DSCR +6.2/10.0
- Livability +3.7/5.0
- Rent growth +2.5/5.0
- Condition / age +2.5/5.0
- Schools +1.3/10.0
- ARV discount +0.0/15.0
- Appreciation +0.0/10.0
$99,900
🖨 Deal sheet 📄 Offer letter ✓ Due diligence
Listing remarks MLS
Nice 3 Bedroom, 1 Bathroom Ranch Home with Full Basement & Detached Garage. Home is tenant occupied, please do not walk property without an appointment.
Key facts
- 5,227 sq ft lot
- Garage
- Built 1999
Property features AI
Finance
- Other: Paved road access; Lot dimensions approximately 50 x 104.46 (0.12 acres)
- Financial info: No investor or income/expense details provided
- HOA & community: No HOA information provided
Exterior
- Parking: Detached garage; Approximately 1.5 garage spaces
- Security: No security features provided
- Utilities: Public water; Public sewer
- Home design: Single-family residence; One story; Ground-level entry
- Construction: Vinyl siding; Block foundation; Asphalt roof; Built area above grade: 1,148 (units provided in source)
- Exterior features: Awning(s); Covered porch
Interior
- Kitchen: No specific appliances listed beyond water heater
- Bedrooms: Total of 3 rooms (bedrooms/other rooms combined)
- Flooring: No flooring information provided
- Bathrooms: 1 full bathroom
- Heating & cooling: Forced air heating; Natural gas heating; No central cooling
- Interior features: Gas water heater; Unfinished basement
- Laundry & utility: No laundry details provided
Neighborhood map
What this means for you Summary
Snapshot
- This is a 3-bed/1.0-bath single-family listed at $100k.
Deal economics
- At list price, monthly cash flow is $118 ($1k/yr) — positive.
- The deal already cash-flows at list — no discount required.
- Meets the 1% rule at list price ($1k rent vs $100k).
- Cap rate 7.7% vs local median 10.2% in Detroit — below-typical yield; the buyer is paying a premium for something (appreciation thesis, condition, location) that the cap rate doesn't capture.
Location & tenants
- Location reads 73/100 on livability (#218 in MI) — a middle-class / working-renter tenant base. Strengths: amenities A+, commute A+, cost of living A+; Watch: schools F, crime F, employment F.
- Detroit Public Schools Community District (urban): math 10% / reading 24% proficiency, ranked #499 of 540 in MI (top 92%) — low school quality limits family demand, transient renter base, plan for 1-2y turnover; 90% free/reduced lunch — lower-income household profile, screen leases tightly.
- Market conditions: 158 active listings in the ZIP; 37 comparable units currently listed for rent nearby; rentals lingering (median 44d on market — plan ~5-8 weeks vacancy on turnover, expect pricing pressure); 54% of comp listings sitting > 30 days — soft ceiling on asking rent; lower-income renter base — watch delinquency; 2,639 units permitted in Wayne County in 2024 (1,216 in 5+ unit buildings).
- This rent runs 35% of the median local income ($45k/yr) — at the standard rent-burdened threshold; future hikes will face affordability resistance.
Forward outlook
- Local home prices are declining (-3.0%/yr); year-one equity from $691 of loan paydown is wiped out by about $3k of value loss. Plan a longer hold.
- Wayne County population projected at -17% by 2050 — secular population decline; favor cash flow + early exit over multi-decade hold.
Negotiation context
- Only 9 days on market — expect competitive offers; lowballing is unlikely to land.
- 2 sale attempts with the ask held roughly flat each time — persistent listings suggest the price (not the market) is what's stuck; bring a comps-based counter.
Risks & watch-outs
- Watch-outs: property tax is 4.2% of price.
Questions for the listing agent
- Property tax is high relative to price — has the assessment been appealed recently, and will the sale trigger a re-assessment?
- Is there a deadline driving the sale (1031 exchange, divorce, estate, relocation)? That informs how much negotiation room exists.
- Schools are F-rated, which usually means shorter tenancies and higher turnover. Who's the typical renter profile here, and what's been the actual vacancy rate?
- Crime grade is F in this area — have there been break-ins, vandalism, or insurance claims at this property in the last 3 years? What carrier currently insures it and at what premium?
- The area grade is low — what's the realistic commute time and amenity access for the typical tenant pool here? Any planned neighborhood developments (good or bad) we should know about?
- What's the average days-on-market for RENTAL listings here right now (not sales)? A rising rental-DOM trend means longer vacancies and softer asking-rent achievability than the comps imply.
- What's the recent tenant-quality profile in this submarket — average credit score on applications, eviction rate, late-payment / NSF rate, and stable-employment percentage? A property-management company in the area should have these aggregated.
- How much new for-sale + rental construction is in the pipeline within 1–3 miles? Heavy new supply typically softens prices + rents 12–24 months out; constrained supply supports both.
Investment metrics
- 1% rule
- 1.31% ✓
- Cap rate
- 7.70%
- Cash-on-cash
- 5.04%
- DSCR
- 1.22
- GRM
- 6.4
CMA / ARV
- ARV (on-the-fly)
- $68,880
- Comps found
- 12
Show comp detail 12 sales within ~0.75 mi
| Address | Dist | Beds/Ba | Sqft | Sold | Price | $/sf | Match |
|---|---|---|---|---|---|---|---|
| 14823 Heyden St | 0.40mi | 3/1.0 | 1,162 (+1%) | 12mo | $70,000 | $60 | 69 |
| 13968 Blackstone St | 0.40mi | 2/1.0 (-1) | 1,200 (+4%) | 4mo | $35,000 | $29 | 66 |
| 14171 Plainview Ave | 0.34mi | 3/1.0 | 1,040 (-9%) | 7mo | $41,000 | $39 | 62 |
| 19400 Lyndon St | 0.56mi | 3/2.0 | 1,169 (+2%) | 9mo | $70,000 | $60 | 60 |
| 14895 Evergreen Rd | 0.51mi | 3/1.0 | 1,079 (-6%) | 9mo | $63,000 | $58 | 58 |
| 13961 Piedmont St | 0.68mi | 3/1.0 | 1,083 (-6%) | 2mo | $130,000 | $120 | 57 |
| 15051 Minock St | 0.72mi | 3/1.5 | 1,164 (+1%) | 10mo | $172,000 | $148 | 54 |
| 13940 Evergreen Rd | 0.41mi | 3/1.0 | 1,019 (-11%) | 12mo | $65,400 | $64 | 52 |
| 14177 Bentler St | 0.48mi | 4/1.0 (+1) | 1,000 (-13%) | 8mo | $30,000 | $30 | 44 |
| 14825 Chapel St | 0.65mi | 4/1.0 (+1) | 1,058 (-8%) | 11mo | $30,000 | $28 | 42 |
| 19431 Lyndon St | 0.53mi | 2/1.0 (-1) | 990 (-14%) | 7mo | $36,500 | $37 | 42 |
| 15112 Kentfield St | 0.63mi | 3/1.0 | 990 (-14%) | 12mo | $62,500 | $63 | 38 |
Match score weights: distance 35% · size 25% · config 20% · recency 20%. Top-matched comps best support the ARV.
Projected returns pro-forma
-3.0% appreciation · 3.0% rent growth · sell at horizon
- IRR
- -8.3%
- Equity multiple
- 0.69×
- Total profit
- $-8,543
- Equity at exit
- $14,895
- IRR
- 1.4%
- Equity multiple
- 1.10×
- Total profit
- $2,847
- Equity at exit
- $8,638
Cash invested: $27,972 (down + closing). Projections, not guarantees.
Landlord ↔ Tenant lean methodology
- Overall (STATE)
- 62 Landlord-Friendly
- State Michigan
- 62 Landlord-Friendly · EVEN
- County
- — inherits STATE
- City
- — inherits STATE
ZIP-level market 48223
- Active inventory
- 158
- Price-to-rent
- 6.4×
Monthly cashflow live
- Estimated rent
- $1,309 high interval (Pro) →
- Mortgage (P&I)
- −$524
- Tax from tax record
- −$351 /mo · $4,216/yr
- Insurance
- −$42
- HOA
- −$0
- Vacancy / Maint / Mgmt
- −$275
- Net cashflow
- $118
Break-even live
UW: 25.0% down · 7.5% · 30yr · 1.5% tax · 5.0% vac · 8.0% maint · 8.0% mgmt
Financing live
Cash to close
- Down payment
- $24,975
- Closing costs
- $2,997
- Reserves months
- —
- Total cash needed
- —
Loan-product check · same deal, 3 products live
Conventional
25% down · 7.5% · 30yr
- Down + closing
- —
- Monthly P&I
- —
- Monthly cashflow
- —
- DSCR
- —
- Eligible?
- —
Personal DTI + credit; lowest rate.
DSCR
20% down · 8.5% · 30yr
- Down + closing
- —
- Monthly P&I
- —
- Monthly cashflow
- —
- DSCR
- —
- Eligible?
- —
No personal income docs; deal must DSCR.
Hard money
10% down · 12.0% · 12mo
- Down + closing
- —
- Monthly P&I
- —
- Monthly cashflow
- —
- DSCR
- —
- Eligible?
- —
Short-term bridge; refi at stabilization.
Rent comps 37 comps
| Address | Beds | Baths | Sqft | Rent | $/sqft | DOM | Units | Dist |
|---|---|---|---|---|---|---|---|---|
| 14541 Kentfield St Detroit, MI | 3.0 | 1.0 | 797 | $1,300 | $1.63 | 16d | 1 | 0.24mi |
| 14258 Plainview Ave Detroit, MI | 3.0 | 1.0 | 918 | $1,200 | $1.31 | 43d | 1 | 0.38mi |
| 14177 Bentler St Detroit, MI | 4.0 | 1.0 | 1000 | $1,475 | $1.48 | 43d | 1 | 0.47mi |
| 13500 Heyden St Detroit, MI | 2.0 | 1.0 | 850 | $1,200 | $1.41 | 43d | 1 | 0.53mi |
| 14347 Westwood St Detroit, MI | 2.0 | 1.0 | 706 | $1,200 | $1.70 | 24d | 1 | 0.54mi |
| 19431 Lyndon St Detroit, MI | 2.0 | 1.0 | 1000 | $1,275 | $1.27 | 43d | 1 | 0.54mi |
| 12867 Westbrook St Detroit, MI | 2.0 | 1.0 | 736 | $1,050 | $1.43 | 43d | 1 | 0.71mi |
| 15318 Kentfield St Detroit, MI | 3.0 | 1.5 | 900 | $1,400 | $1.56 | 43d | 1 | 0.71mi |
| 15340 Braile St Detroit, MI | 3.0 | 1.0 | 883 | $1,000 | $1.13 | 4d | 1 | 0.73mi |
| 12880 Dolson St Detroit, MI | 1.0–2.0 | 1.0 | 750 | $1,200 | $1.60 | 43d | 6 | 0.86mi |
| 22241 Lyndon St Detroit, MI | 3.0 | 1.0 | 960 | $1,100 | $1.15 | 16d | 1 | 0.88mi |
| 19050 W Davison St Detroit, MI | 3.0 | 1.0 | 1118 | $1,400 | $1.25 | 43d | 1 | 0.89mi |
| 15519 Plainview Ave Detroit, MI | 3.0 | 1.0 | 900 | $1,396 | $1.55 | 16d | 1 | 0.94mi |
| 15712 Vaughan St Detroit, MI | 3.0 | 1.0 | 1280 | $1,400 | $1.09 | 14d | 1 | 0.97mi |
| 12850 Dolphin St Detroit, MI | 1.0–2.0 | 1.0 | 746 | $999 | $1.34 | 4d | 4 | 0.98mi |
| 15712 Evergreen Rd Detroit, MI | 2.0 | 1.0 | 850 | $1,050 | $1.24 | 43d | 1 | 0.99mi |
| 13514 Stahelin Ave Detroit, MI | 3.0 | 1.0 | 1000 | $1,400 | $1.40 | 17d | 1 | 1.00mi |
| 12950 Glastonbury Ave Detroit, MI | 3.0 | 1.0 | 1000 | $1,400 | $1.40 | 24d | 1 | 1.07mi |
| 15815 Evergreen Rd Detroit, MI | 3.0 | 1.0 | 1350 | $1,300 | $0.96 | 43d | 1 | 1.09mi |
| 13591 Faust Ave Detroit, MI | 2.0 | 1.0 | 1000 | $1,275 | $1.27 | 43d | 1 | 1.11mi |
| 12084 Vaughan St Detroit, MI | 3.0 | 1.0 | 1000 | $1,200 | $1.20 | 16d | 1 | 1.12mi |
| 15829 Minock St Detroit, MI | 3.0 | 1.5 | 1200 | $1,550 | $1.29 | 24d | 1 | 1.14mi |
| 14280 Bramell St Detroit, MI | 3.0 | 1.0 | 1100 | $1,500 | $1.36 | 16d | 1 | 1.15mi |
| 13581 Penrod St Detroit, MI | 4.0 | 1.0 | 1152 | $1,200 | $1.04 | 43d | 1 | 1.17mi |
| 12875 Faust Ave Detroit, MI | 2.0 | 1.0 | 735 | $1,200 | $1.63 | 4d | 1 | 1.19mi |
| 12941 Penrod St Detroit, MI | 2.0 | 1.0 | 1000 | $1,275 | $1.27 | 43d | 1 | 1.22mi |
| 16194 Fielding St Unit 2 Detroit, MI | 2.0 | 1.0 | 750 | $950 | $1.27 | 14d | 1 | 1.26mi |
| 11652 Fielding St Detroit, MI | 3.0 | 1.0 | 1000 | $1,386 | $1.39 | 43d | 1 | 1.26mi |
| 12944 Rosemont Ave Detroit, MI | 2.0 | 1.0 | 800 | $1,050 | $1.31 | 4d | 1 | 1.30mi |
| 13600 Southfield Fwy Detroit, MI | 2.0 | 1.0 | 848 | $1,100 | $1.30 | 4d | 1 | 1.37mi |
| 14716 Archdale St Detroit, MI | 2.0 | 1.0 | 900 | $1,100 | $1.22 | 43d | 1 | 1.44mi |
| 16717 Trinity St Detroit, MI | 3.0 | 1.5 | 1101 | $1,250 | $1.14 | 43d | 1 | 1.47mi |
| 23610 Schoolcraft Rd Detroit, MI | 2.0 | 1.0 | 900 | $1,050 | $1.17 | 43d | 1 | 1.49mi |
| 15847 Chatham St Detroit, MI | 3.0 | 1.0 | 909 | $1,325 | $1.46 | 4d | 1 | 1.49mi |
| 23606 Schoolcraft Rd Detroit, MI | 2.0 | 1.0 | 900 | $1,050 | $1.17 | 43d | 1 | 1.50mi |
| 23602 Schoolcraft Rd Detroit, MI | 2.0 | 1.0 | 900 | $1,050 | $1.17 | 43d | 1 | 1.50mi |
| 23626 Schoolcraft Rd Detroit, MI | 2.0 | 1.0 | 900 | $1,050 | $1.17 | 43d | 1 | 1.50mi |
Listing history 8 events
-
2026-06-18days on market $99,900 Active 9 DOM
-
2026-06-17days on market $99,900 Active 8 DOM
-
2026-06-16days on market $99,900 Active 7 DOM
-
2026-06-15days on market $99,900 Active 6 DOM
-
2026-06-13days on market $99,900 Active 4 DOM
-
2026-06-13days on market $99,900 Active 3 DOM
-
2026-06-10remarks 154-char remark
-
2026-06-10$99,900 Active 1 DOM
ⓘ Source: listings_history table (triggers on properties + properties_extension) + one-shot
backfill from property_details.listing_events for pre-trigger history.
Tax reassessment forecast MI · Partial reset (capped growth)
- Current annual tax
- $4,216 · $351/mo
- Projected year-2 tax
- $4,216 · $351/mo
- Expected delta
- $0/yr ($0/mo · 0.0%)
ⓘ Screening estimate from a state-policy table — verify with the county assessor before closing.
Climate risk First Street
- Flood 1/10 Low FEMA zone X (unshaded) · 0% chance over 30 yrs
- Wildfire 1/10 Low
- Heat 3/10 Moderate 7 d/yr ≥99°F today · 15 d/yr by 30 yrs out
- Wind 2/10 Low
- Air quality 3/10 Moderate 2 unhealthy d/yr today · 5 by 30 yrs out
Nearby sold comps map
Loading sold comps map…
Walkable amenities ~0.75 mi
Loading nearby amenities…
Taxation est. · year 1
- Rental income
- $15,713
- − Mortgage interest
- −$5,596
- − Property taxes
- −$4,216
- − Insurance
- −$500
- − Repairs & maintenance
- −$1,257
- − Management
- −$1,257
- − Depreciation
- −$2,906
- Taxable loss
- −$19
- Est. tax savings @ 24.0%
- +$5
- After-tax cash flow
- $1,415/yr
For passive investors: Depreciation is non-cash, so a rental often shows a tax loss while cash-flowing — sheltering income. Rental losses are passive: they offset passive income freely, and up to $25,000/yr can offset ordinary (W-2) income if you actively participate and your MAGI is under $100k (phasing out to $0 by $150k); unused losses carry forward. On sale, claimed depreciation is recaptured at up to 25%, and gains may owe capital-gains tax (a 1031 exchange can defer both). Figures are a year-1 estimate at your 24.0% rate — not tax advice; consult a CPA.
Schools (NCES district)
- District
- Detroit Public Schools Community District
- NCES district ID
- 2601103
- Math proficiency
- 10% ▼ -2.00%
- Reading proficiency
- 24% ▲ 6.00%
- Median HH income
- $25,815
- Composite
- 13.06/100
- National rank
- #9564
- State rank
- #499 of 540 in MI
Livability — Detroit
- Score
- 73/100
- State rank
- #218
- US rank
- #5427
Category grades
Schools grade is shown separately in the Schools card above.
Census & demographics
- Census place
- Detroit, MI
- County
- Wayne County · 1,562,939 people
- City population
- 572,865
- Metro
- Detroit-Warren-Dearborn, MI
- Population (ZIP)
- 22,622
- Household income
- $44,512
- Rent vs Own
- Severe rent burden
- 1151.0
Population outlook (Wayne County) Hauer SSP2
- Today (2025)
- 1,675,273 people
- By 2030
- 1,620,300 · -3.3%
- By 2040
- 1,502,341 · -10.3%
- By 2050
- 1,384,039 · -17.4%
- By 2075
- 1,124,592 · -32.9%
- By 2100
- 881,193 · -47.4%
Race, ethnicity, and origin ACS 2023
- Neighborhood character
- Predominantly Black (86%)
- Race & ethnicity
- Black 86% White 7% Two or more races 5% Hispanic / Latino 2%
- Common ancestry
- Romanian 1% Iranian 1%
- Foreign-born
- 1% · Canada
- Languages at home
- 97% English-only · Spanish 2%
Political lean MEDSL · Wayne
- 2024 margin
- Strong D (+29.0) · D 62.7% · R 33.7% · Other 3.6%
- 2008→2024 swing
- -20.5pp toward R · 2008: 49.5pp · 2024: 29.0pp
- All cycles
- 2024: D+29.0 2020: D+38.1 2016: D+37.3 2012: D+46.9 2008: D+49.5
Not yet ingested
- Civics
- —
Market trends
- HPI YoY
- ▼ -303.41%
- Current HPI
- 138.2779
- Rent YoY
- —
- Metro
- Detroit-Warren-Dearborn, MI
- State GDP YoY
- ▲ 1.37%
- F500 in state
- 28
Industry mix (Fortune 500 HQ in MI)
| Industry | F500 HQs | Revenue |
|---|---|---|
| Automotive Parts | 3 | $48B |
|
||
| Automotive | 2 | $372B |
|
||
| Chemicals | 1 | $45B |
|
||
| Automotive Retail | 1 | $29B |
|
||
| Healthcare / Medical Devices | 1 | $23B |
|
||
| Automotive Technology | 1 | $20B |
|
||
Price history
+0.0% since first listed2 events — show timeline
- 2026-06-09 Listed $99,900 MiRealSource-MiMLS
- 2026-06-09 Listed $99,900 REALCOMP
Property tax history
+33.2%/yrLatest (2025): $4,216 · +706.9% YoY. Source: county tax records.
Cash-flow waterfall
monthlySold comps — $/sqft
last 12 mo · ≤1 miLoading sold comps…