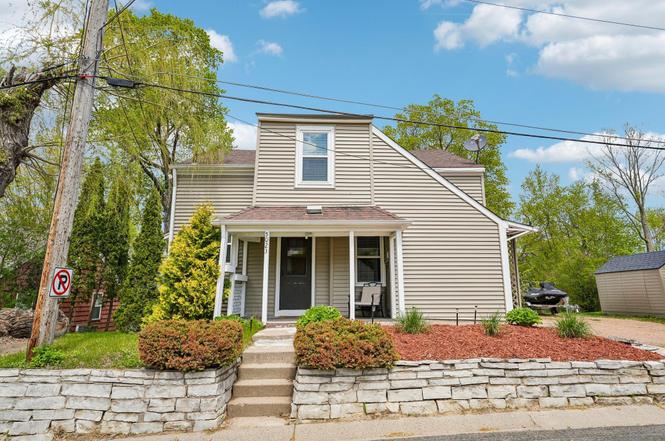
5023 Edgewater Dr · Mound, MN
Flood risk 1/10 · Minimal
- FEMA flood zone
- X (unshaded)
- Chance of flooding over 30 yrs
- 0.0%
- Est. flood insurance / yr
- $473 – $860
Fire risk 1/10 · Minimal
- Est. fire insurance / yr
- $888 – $1,650
Heat risk 2/10 · Minimal
- Hot days now (above 98°F)
- 7 days/yr
- Hot days in 30 yrs
- 14 days/yr
Wind risk 2/10 · Minimal
- Chance of severe wind over 30 yrs
- —
Air-quality risk 2/10 · Minimal
- Unhealthy air days now
- 1 days/yr
- Unhealthy air days in 30 yrs
- 1 days/yr
Risk factors via First Street. Map © Google.
Why this score? — see what drove the C+ grade
The composite is a weighted blend of 9 inputs, each scored 0–100. Each bar is that input's sub-score; the figure is the points it added to the 100-point composite (weight × sub-score).
- Cash flow +20.0/30.0
- ARV discount +15.0/15.0
- DSCR +6.3/10.0
- Schools +5.9/10.0
- 1% rule +4.7/10.0
- Livability +4.2/5.0
- Rent growth +2.5/5.0
- Condition / age +2.5/5.0
- Appreciation +0.0/10.0
$389,000
🖨 Deal sheet 📄 Offer letter ✓ Due diligence
Listing remarks MLS
Charming 2 story home with Harrison Bay views! Nestled into a spacious lot next to Edgewater city park. Main floor owner’s bedroom. Both a formal dining area and eat in kitchen. Upper left has a reading nook and 2 spacious bedrooms with large closets. Fully finished lower level has a great family room and 3/4 bath. Plenty of indoor and outdoor storage.
Key facts
- 6,098 sq ft lot
- Built 1935
- Listed 33 days
Property features AI
Finance
- Financial info: Conventional financing available
Exterior
- Parking: Gravel parking
- Utilities: City water (connected); City sewer (connected); Natural gas
- Home design: Residential property; One-and-one-half stories; Block foundation
- Construction: Block foundation
- Exterior features: Deck; Vinyl exterior; Storage shed; Property adjoins public land; Lake view (note: a road between the waterfront and home)
Interior
- Kitchen: Range; Refrigerator; Microwave; Dishwasher; Garbage disposal; Eat-in kitchen with breakfast bar
- Bedrooms: 3 bedrooms (one on the main level, two on the upper level)
- Bathrooms: Main floor full bath; Upper level full bath; Three-quarter bath in the basement
- Heating & cooling: Forced air heating; Central air conditioning
- Interior features: Finished full basement; Breakfast bar; Eat-in kitchen; Informal dining area; Living/dining room combination; Loft; Main floor bedroom
- Laundry & utility: Washer; Dryer; Laundry room on lower level
Neighborhood map
What this means for you Summary
Snapshot
- This is a 4-bed/2.0-bath single-family listed at $389k.
Deal economics
- At list price, monthly cash flow is $474 ($6k/yr) — positive.
- The deal already cash-flows at list — no discount required.
- To meet the 1% rule (rent ≥ 1% of price), the offer needs to be $377k (3.2% below list).
- Recommended offer: $377k (3.2% below list) — sets the bar for 1% rule.
- Cap rate 7.8% vs local median 1.8% in Mound — top-decile yield for the area; either an underpriced asset or a hidden risk that comps aren't pricing in. Stress-test before assuming the spread holds.
Location & tenants
- Location reads 85/100 on livability (#20 in MN, #559 nationally) — a professional / high-income tenant draw. Strengths: schools A+, crime A+, commute A+; Watch: amenities F.
- Westonka Public School District (rural): math 65% / reading 68% proficiency, ranked #14 of 301 in MN (top 5%) — acceptable for families but not a draw, mixed tenant base, ~2y average lease; only 14% free/reduced lunch — higher-income household profile.
- Market conditions: 147 active listings in the ZIP; 2 comparable units currently listed for rent nearby; solid renter incomes; 4,651 units permitted in Hennepin County in 2024 (2,443 in 5+ unit buildings).
- This rent runs 42% of the median local income ($109k/yr) — at the standard rent-burdened threshold; future hikes will face affordability resistance.
Forward outlook
- Local home prices are declining (-3.0%/yr); year-one equity from $3k of loan paydown is wiped out by about $12k of value loss. Plan a longer hold.
- Hennepin County population projected at +30% by 2050 — long-run rental-demand tailwind backs the buy-and-hold thesis.
Negotiation context
- It's been on market 33 days — a 3% lower offer ($377k) is reasonable based on typical stale-listing flexibility.
- 5 sale attempts since 17y ago with the ask held roughly flat each time — persistent listings suggest the price (not the market) is what's stuck; bring a comps-based counter.
Risks & watch-outs
- Watch-outs: built in 1935 — expect roof / HVAC / electrical / plumbing capex.
Questions for the listing agent
- It's been on market 33 days. Have you received any prior offers? Is the seller open to a 3% concession, seller financing, or rate buy-down credit?
- Built in 1935 — when were the roof, HVAC, electrical panel, plumbing, and water heater last replaced?
- Is there a deadline driving the sale (1031 exchange, divorce, estate, relocation)? That informs how much negotiation room exists.
- Schools are A-rated — typically a magnet for longer-tenancy family renters. What's the average tenant stay here, and is there a school-zone premium baked into asking?
- What's the average days-on-market for RENTAL listings here right now (not sales)? A rising rental-DOM trend means longer vacancies and softer asking-rent achievability than the comps imply.
- What's the recent tenant-quality profile in this submarket — average credit score on applications, eviction rate, late-payment / NSF rate, and stable-employment percentage? A property-management company in the area should have these aggregated.
- How much new for-sale + rental construction is in the pipeline within 1–3 miles? Heavy new supply typically softens prices + rents 12–24 months out; constrained supply supports both.
Investment metrics
- 1% rule
- 0.97% ✗
- Cap rate
- 7.76%
- Cash-on-cash
- 5.22%
- DSCR
- 1.23
- GRM
- 8.6
CMA / ARV
- ARV (median comp)
- $609,316
- List price
- $389,000
- Delta
- -36.16%
- Verdict
- UNDERPRICED
- Comps
- 5 within 1.0 mi
Show comp detail 1 sale within ~0.75 mi
| Address | Dist | Beds/Ba | Sqft | Sold | Price | $/sf | Match |
|---|---|---|---|---|---|---|---|
| 1942 Shorewood Ln | 0.58mi | 3/3.0 (-1) | 1,992 (+9%) | 12mo | $1,040,000 | $522 | 38 |
Match score weights: distance 35% · size 25% · config 20% · recency 20%. Top-matched comps best support the ARV.
Projected returns pro-forma
-3.0% appreciation · 3.0% rent growth · sell at horizon
- IRR
- -8.2%
- Equity multiple
- 0.70×
- Total profit
- $-32,896
- Equity at exit
- $58,001
- IRR
- 1.3%
- Equity multiple
- 1.09×
- Total profit
- $10,001
- Equity at exit
- $33,634
Cash invested: $108,920 (down + closing). Projections, not guarantees.
Landlord ↔ Tenant lean methodology
- Overall (STATE)
- 46 Balanced
- State Minnesota
- 46 Balanced · D+2
- County
- — inherits STATE
- City
- — inherits STATE
ZIP-level market 55364
- Active inventory
- 147
- Price-to-rent
- 8.6×
Monthly cashflow live
- Estimated rent
- $3,766 medium interval (Pro) →
- Mortgage (P&I)
- −$2,040
- Tax from tax record
- −$299 /mo · $3,584/yr
- Insurance
- −$162
- HOA
- −$0
- Vacancy / Maint / Mgmt
- −$791
- Net cashflow
- $474
Break-even live
UW: 25.0% down · 7.5% · 30yr · 1.5% tax · 5.0% vac · 8.0% maint · 8.0% mgmt
Financing live
Cash to close
- Down payment
- $97,250
- Closing costs
- $11,670
- Reserves months
- —
- Total cash needed
- —
Loan-product check · same deal, 3 products live
Conventional
25% down · 7.5% · 30yr
- Down + closing
- —
- Monthly P&I
- —
- Monthly cashflow
- —
- DSCR
- —
- Eligible?
- —
Personal DTI + credit; lowest rate.
DSCR
20% down · 8.5% · 30yr
- Down + closing
- —
- Monthly P&I
- —
- Monthly cashflow
- —
- DSCR
- —
- Eligible?
- —
No personal income docs; deal must DSCR.
Hard money
10% down · 12.0% · 12mo
- Down + closing
- —
- Monthly P&I
- —
- Monthly cashflow
- —
- DSCR
- —
- Eligible?
- —
Short-term bridge; refi at stabilization.
Rent comps 2 comps
| Address | Beds | Baths | Sqft | Rent | $/sqft | DOM | Units | Dist |
|---|---|---|---|---|---|---|---|---|
| 4870 Glasgow Rd Mound, MN | 3.0 | 3.0 | 2592 | $2,924 | $1.13 | 3d | 1 | 1.11mi |
| 5912 Bartlett Blvd Mound, MN | 4.0 | 2.5 | 2500 | $7,000 | $2.80 | 1d | 1 | 1.32mi |
Listing history 27 events
-
2026-06-18status $389,000 Pending 33 DOM
-
2026-06-17days on market $389,000 Contingent - Inspection 33 DOM
-
2026-06-16days on market $389,000 Contingent - Inspection 32 DOM
-
2026-06-15days on market $389,000 Contingent - Inspection 31 DOM
-
2026-06-13days on market $389,000 Contingent - Inspection 29 DOM
-
2026-06-09days on market $389,000 Contingent - Inspection 25 DOM
-
2026-06-08days on market $389,000 Contingent - Inspection 24 DOM
-
2026-06-07days on market $389,000 Contingent - Inspection 23 DOM
-
2026-06-04days on market $389,000 Contingent - Inspection 20 DOM
-
2026-06-03days on market $389,000 Contingent - Inspection 19 DOM
-
2026-06-02days on market $389,000 Contingent - Inspection 18 DOM
-
2026-06-01days on market $389,000 Contingent - Inspection 17 DOM
-
2026-05-31days on market $389,000 Contingent - Inspection 16 DOM
-
2026-05-15$389,000 Active 594-char remark
-
2026-05-12historical $389,000 594-char remark
-
2023-03-13soldstatus $358,000
-
2023-03-07soldstatus $358,000 Sold 360-char remark
Show marketing remark (360 chars)
Charming 2 story home with Harrison Bay views! Nestled into a spacious lot next to Edgewater city park. Main floor owner’s bedroom. Both a formal dining area and eat in kitchen. Upper left has a reading nook and 2 spacious bedrooms with large closets. Fully finished lower level has a great family room and 3/4 bath. Plenty of indoor and outdoor storage.
-
2023-02-02status Pending 360-char remark
Show marketing remark (360 chars)
Charming 2 story home with Harrison Bay views! Nestled into a spacious lot next to Edgewater city park. Main floor owner’s bedroom. Both a formal dining area and eat in kitchen. Upper left has a reading nook and 2 spacious bedrooms with large closets. Fully finished lower level has a great family room and 3/4 bath. Plenty of indoor and outdoor storage.
-
2022-11-11$374,999 Active 360-char remark
Show marketing remark (360 chars)
Charming 2 story home with Harrison Bay views! Nestled into a spacious lot next to Edgewater city park. Main floor owner’s bedroom. Both a formal dining area and eat in kitchen. Upper left has a reading nook and 2 spacious bedrooms with large closets. Fully finished lower level has a great family room and 3/4 bath. Plenty of indoor and outdoor storage.
-
2011-02-18soldstatus $95,000
-
2011-01-29historical
-
2010-12-28$108,900
-
2010-10-07historical
-
2010-02-09$108,900
-
2010-02-01historical
-
2009-09-14$140,000
-
1995-10-20soldstatus $76,000
ⓘ Source: listings_history table (triggers on properties + properties_extension) + one-shot
backfill from property_details.listing_events for pre-trigger history.
Tax reassessment forecast MN · Partial reset (capped growth)
- Current annual tax
- $3,584 · $299/mo
- Projected year-2 tax
- $3,970 · $331/mo
- Expected delta
- +$386/yr (+$32/mo · 10.8%)
ⓘ Screening estimate from a state-policy table — verify with the county assessor before closing.
Climate risk First Street
- Flood 1/10 Low FEMA zone X (unshaded) · 0% chance over 30 yrs
- Wildfire 1/10 Low
- Heat 2/10 Low 7 d/yr ≥98°F today · 14 d/yr by 30 yrs out
- Wind 2/10 Low
- Air quality 2/10 Low 1 unhealthy d/yr today · 1 by 30 yrs out
Nearby sold comps map
Loading sold comps map…
Walkable amenities ~0.75 mi
Loading nearby amenities…
Taxation est. · year 1
- Rental income
- $45,187
- − Mortgage interest
- −$21,790
- − Property taxes
- −$3,584
- − Insurance
- −$1,945
- − Repairs & maintenance
- −$3,615
- − Management
- −$3,615
- − Depreciation
- −$11,316
- Taxable loss
- −$678
- Est. tax savings @ 24.0%
- +$163
- After-tax cash flow
- $5,852/yr
For passive investors: Depreciation is non-cash, so a rental often shows a tax loss while cash-flowing — sheltering income. Rental losses are passive: they offset passive income freely, and up to $25,000/yr can offset ordinary (W-2) income if you actively participate and your MAGI is under $100k (phasing out to $0 by $150k); unused losses carry forward. On sale, claimed depreciation is recaptured at up to 25%, and gains may owe capital-gains tax (a 1031 exchange can defer both). Figures are a year-1 estimate at your 24.0% rate — not tax advice; consult a CPA.
Schools (NCES district)
- District
- Westonka Public School District
- NCES district ID
- 2722920
- Math proficiency
- 65% ▼ -14.00%
- Reading proficiency
- 68% ▼ -10.00%
- Median HH income
- $80,965
- Composite
- 59.42/100
- National rank
- #928
- State rank
- #14 of 301 in MN
Livability — Mound
- Score
- 85/100
- State rank
- #20
- US rank
- #559
Category grades
Schools grade is shown separately in the Schools card above.
Census & demographics
- Census place
- Mound, MN
- County
- Hennepin County · 1,150,272 people
- City population
- 14,097
- Metro
- Minneapolis-St. Paul-Bloomington, MN-WI
- Population (ZIP)
- 14,097
- Household income
- $108,725
- Rent vs Own
- Severe rent burden
- 198.0
Population outlook (Hennepin County) Hauer SSP2
- Today (2025)
- 1,405,227 people
- By 2030
- 1,492,650 · +6.2%
- By 2040
- 1,660,157 · +18.1%
- By 2050
- 1,823,498 · +29.8%
- By 2075
- 2,221,283 · +58.1%
- By 2100
- 2,509,976 · +78.6%
Race, ethnicity, and origin ACS 2023
- Neighborhood character
- Predominantly White (89%)
- Race & ethnicity
- White 89% Two or more races 5% Hispanic / Latino 2% Black 1% Asian 1%
- Common ancestry
- Portuguese 19% Lithuanian 3% Slovak 3%
- Foreign-born
- 7% · Canada, China
- Languages at home
- 92% English-only · Spanish 4% Russian/Polish/Slavic 1% Chinese 1%
Political lean MEDSL · Hennepin
- 2024 margin
- Solid D (+42.6) · D 70.2% · R 27.5% · Other 2.3%
- 2008→2024 swing
- +14.0pp toward D · 2008: 28.6pp · 2024: 42.6pp
- All cycles
- 2024: D+42.6 2020: D+43.2 2016: D+35.3 2012: D+27.1 2008: D+28.6
Not yet ingested
- Civics
- —
Market trends
- HPI YoY
- ▼ -395.23%
- Current HPI
- 249.0081
- Rent YoY
- —
- Metro
- Minneapolis-St. Paul-Bloomington, MN-WI
- State GDP YoY
- ▲ 2.41%
- F500 in state
- 34
Industry mix (Fortune 500 HQ in MN)
| Industry | F500 HQs | Revenue |
|---|---|---|
| Healthcare | 2 | $407B |
|
||
| Retail | 2 | $150B |
|
||
| Consumer Goods | 2 | $32B |
|
||
| Industrial Machinery | 2 | $6B |
|
||
| Agriculture | 1 | $40B |
|
||
| Healthcare / Medical Devices | 1 | $32B |
|
||
Price history
+411.8% since first listed16 events — show timeline
- 2026-06-18 Pending — NORTHSTARMLS as Distributed by MLS Grid
- 2026-05-22 Contingent — NORTHSTARMLS as Distributed by MLS Grid
- 2026-05-15 Listed $389,000 NORTHSTARMLS as Distributed by MLS Grid
- 2026-05-12 Coming Soon $389,000 NORTHSTARMLS as Distributed by MLS Grid
- 2023-03-13 Sold (Public Records) $358,000 Public Records
- 2023-03-07 Sold (MLS) $358,000 NORTHSTARMLS as Distributed by MLS Grid
- 2023-02-02 Pending — NORTHSTARMLS as Distributed by MLS Grid
- 2022-11-11 Listed $374,999 NORTHSTARMLS as Distributed by MLS Grid
- 2011-02-18 Sold (MLS) $95,000 NORTHSTARMLS as Distributed by MLS Grid
- 2011-01-29 Listing Removed — NORTHSTARMLS as Distributed by MLS Grid
- 2010-12-28 Listed $108,900 NORTHSTARMLS as Distributed by MLS Grid
- 2010-10-07 Listing Removed — NORTHSTARMLS as Distributed by MLS Grid
- 2010-02-09 Listed $108,900 NORTHSTARMLS as Distributed by MLS Grid
- 2010-02-01 Listing Removed — NORTHSTARMLS as Distributed by MLS Grid
- 2009-09-14 Listed $140,000 NORTHSTARMLS as Distributed by MLS Grid
- 1995-10-20 Sold (Public Records) $76,000 Public Records
Property tax history
+4.0%/yrLatest (2025): $3,584 · +1.2% YoY. Source: county tax records.
Cash-flow waterfall
monthlySold comps — $/sqft
last 12 mo · ≤1 miLoading sold comps…