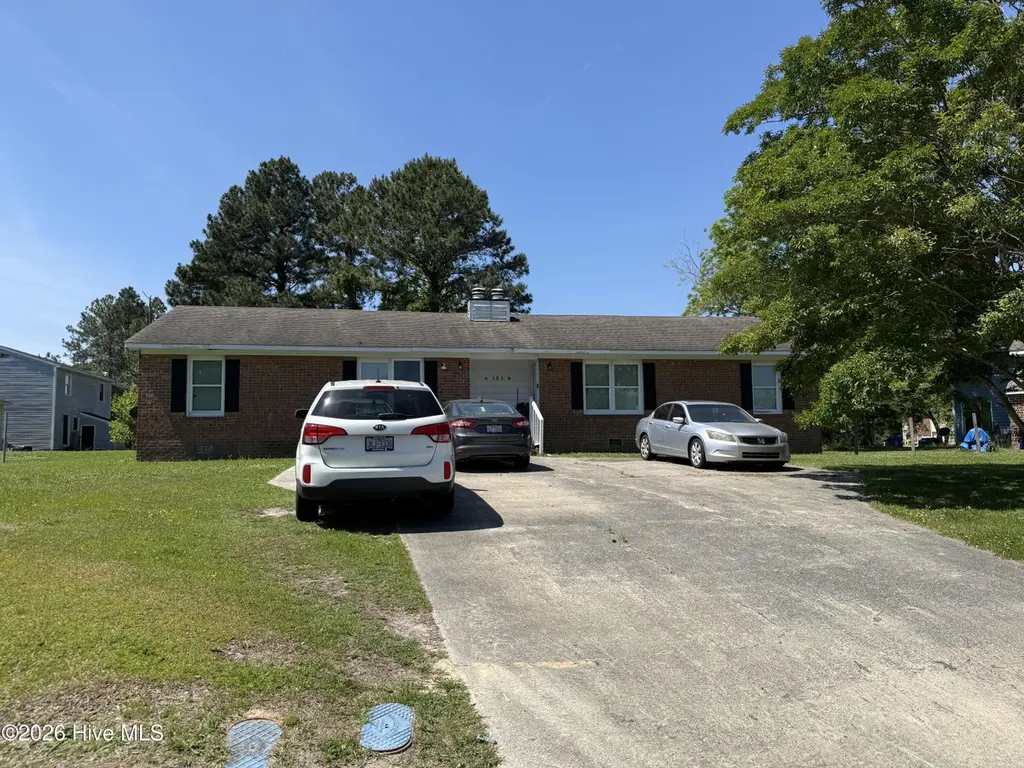
103 Mosby Cir Unit A/B · Greenville, NC
Flood risk 1/10 · Minimal
- FEMA flood zone
- X (unshaded)
- Chance of flooding over 30 yrs
- 0.0%
- Est. flood insurance / yr
- $507 – $1,088
Fire risk 3/10 · Minor
- Est. fire insurance / yr
- $906 – $1,684
Heat risk 8/10 · Major
- Hot days now (above 106°F)
- 7 days/yr
- Hot days in 30 yrs
- 17 days/yr
Wind risk 8/10 · Major
- Chance of severe wind over 30 yrs
- 80.0%
Air-quality risk 3/10 · Minor
- Unhealthy air days now
- 3 days/yr
- Unhealthy air days in 30 yrs
- 3 days/yr
Risk factors via First Street. Map © Google.
Why this score? — see what drove the D grade
The composite is a weighted blend of 9 inputs, each scored 0–100. Each bar is that input's sub-score; the figure is the points it added to the 100-point composite (weight × sub-score).
- Cash flow +13.0/30.0
- ARV discount +7.5/15.0
- DSCR +3.9/10.0
- Rent growth +3.9/5.0
- Livability +3.9/5.0
- 1% rule +3.7/10.0
- Schools +3.6/10.0
- Condition / age +1.0/5.0
- Appreciation +0.0/10.0
$215,000
🖨 Deal sheet (PDF) 📄 Offer letter ✓ Due diligence
Listing remarks MLS
Each unit can rent for $450/month. Located in quiet cul-de-sac area. No HOA. Priced to sell quickly. Selling as-is, where-is. Needs work. Can close ASAP, BRING ALL OFFERS!!! Submit proof financing with offer.
Key facts
- Full brick duplex
- 9,583 sq ft lot
- Built 1981
Tags
Property features AI
Finance
- Other: Property located on a cul-de-sac; Has a view; Subdivision: Shenandoah
- Financial info:
- HOA & community: Homeowners association with park and playground amenities
Exterior
- Parking: Assigned parking on concrete; No garage
- Security:
- Utilities: Public water; Electricity connected; Sewer connected; Water connected
- Home design: Duplex (residential income); One story
- Construction: Brick veneer and frame construction; Shingle roof; Crawl space foundation
- Exterior features: Covered front porch; No additional exterior features listed
Interior
- Kitchen: Electric cooktop; Range; Refrigerator; Dishwasher
- Bedrooms:
- Flooring: Laminate flooring; Vinyl flooring
- Bathrooms:
- Heating & cooling: Heat pump heating; Electric heating; Central air conditioning
- Interior features: Electric water heater; No notable built-in exterior interior features listed
- Laundry & utility: Washer hookup
Neighborhood map
What this means for you Summary
Snapshot
- This is a 4-bed/2.0-bath condo listed at $215k. Condition is rated poor.
Deal economics
- At list price, monthly cash flow is $-11 ($-126/yr) — negative.
- To cash-flow at today's rent, offer at most $213k (0.7% below list).
- To meet the 1% rule (rent ≥ 1% of price), the offer needs to be $187k (13.1% below list).
- Recommended offer: $187k (13.1% below list) — sets the bar for 1% rule.
- Cap rate 6.2% vs local median 3.8% in Greenville — top-decile yield for the area; either an underpriced asset or a hidden risk that comps aren't pricing in. Stress-test before assuming the spread holds.
Location & tenants
- Location reads 77/100 on livability (#30 in NC, #2,977 nationally) — a middle-class / working-renter tenant base. Strengths: commute A+, cost of living A+, health & safety A+; Watch: crime F, employment F.
- Pitt County Schools (rural): math 41% / reading 44% proficiency, ranked #100 of 178 in NC (top 56%) — families likely to look elsewhere, expect single-tenant / working-renter base with shorter leases.
- Zoned schools: Ridgewood Elementary (math 50% / reading 57%, grade C, #335 of 1,410 statewide, top 24%, 722 students, 47% FRL); E B Aycock Middle (math 27% / reading 30%, grade F, #355 of 475 statewide, top 76%, 661 students, 99% FRL); South Central (math 42% / reading 51%, grade D-, #344 of 535 statewide, top 64%, 1,675 students, 55% FRL).
- Market conditions: Rents rising fast (+5.4%/yr); 356 active listings in the ZIP; 12 comparable units currently listed for rent nearby; rentals at typical pace (median 23d on market — plan ~3-4 weeks tenant-placement turnaround); 1,300 units permitted in Pitt County in 2024 (204 in 5+ unit buildings).
- At $1,867/mo this rent would consume 46% of the median local household income ($49k/yr) (locally 3319% of renters already pay >50% of income on rent) — very limited rent-growth headroom before tenants either downsize or default.
Forward outlook
- Local home prices are declining (-3.0%/yr); year-one equity from $1k of loan paydown is wiped out by about $6k of value loss. Plan a longer hold.
- Pitt County population projected at +22% by 2050 — long-run rental-demand tailwind backs the buy-and-hold thesis.
Negotiation context
- It's been on market 34 days — a 3% lower offer ($209k) is reasonable based on typical stale-listing flexibility.
- 3 sale attempts since 15y ago with the ask held roughly flat each time — persistent listings suggest the price (not the market) is what's stuck; bring a comps-based counter.
- Current owner paid $15k; list at $215k implies a 1333% gain — meaningful room to come down on a strong offer.
Risks & watch-outs
- Climate carrying-cost: severe wind risk, 80% chance of damaging wind over 30y; extreme-heat days projected 7→17/yr by 2055 (HVAC capex compounding) — expect insurance premiums to compound above CPI over the hold.
Questions for the listing agent
- What do current leases actually rent for vs. the listed asking? Can we see a recent rent roll and the last 12 months of T-12 income?
- It's been on market 34 days. Have you received any prior offers? Is the seller open to a 13% concession, seller financing, or rate buy-down credit?
- Have any recent inspections been done? Can we get a copy of the seller's disclosures and any deferred-maintenance estimates?
- Any open or pending special assessments — roof, HVAC, plumbing, elevator, façade? What's the per-unit balance and payoff schedule, and is the seller paying it off at close or rolling it to the buyer?
- Is there a deadline driving the sale (1031 exchange, divorce, estate, relocation)? That informs how much negotiation room exists.
- Crime grade is F in this area — have there been break-ins, vandalism, or insurance claims at this property in the last 3 years? What carrier currently insures it and at what premium?
- The area grade is low — what's the realistic commute time and amenity access for the typical tenant pool here? Any planned neighborhood developments (good or bad) we should know about?
- What's the average days-on-market for RENTAL listings here right now (not sales)? A rising rental-DOM trend means longer vacancies and softer asking-rent achievability than the comps imply.
- What's the recent tenant-quality profile in this submarket — average credit score on applications, eviction rate, late-payment / NSF rate, and stable-employment percentage? A property-management company in the area should have these aggregated.
- How much new apartment / multifamily construction is in the pipeline within 1–3 miles? Heavy new supply (>2% of stock underway) typically softens rents 12–24 months out; light construction supports rent growth.
Investment metrics
- 1% rule
- 0.87% ✗
- Cap rate
- 6.23%
- Cash-on-cash
- -0.21%
- DSCR
- 0.99
- GRM
- 9.6
CMA / ARV
No comps found within radius.
Projected returns pro-forma
-3.0% appreciation · 5.44% rent growth · sell at horizon
- IRR
- -13.9%
- Equity multiple
- 0.49×
- Total profit
- $-30,785
- Equity at exit
- $32,057
- IRR
- -1.6%
- Equity multiple
- 0.88×
- Total profit
- $-7,296
- Equity at exit
- $18,589
Cash invested: $60,200 (down + closing). Projections, not guarantees.
Landlord ↔ Tenant lean methodology
- Overall (STATE)
- 85 Strongly Landlord-Friendly
- State North Carolina
- 85 Strongly Landlord-Friendly · R+3
- County
- — inherits STATE
- City
- — inherits STATE
ZIP-level market 27834
- Rents YoY
- 5.4%
- Active inventory
- 356
- Price-to-rent
- 9.6×
Monthly cashflow live
- Estimated rent
- $1,867 high interval (Pro) →
- Mortgage (P&I)
- −$1,127
- Tax est. 1.5%
- −$269 /mo · $3,225/yr
- Insurance
- −$90
- HOA
- −$0
- Vacancy / Maint / Mgmt
- −$392
- Net cashflow
- $-11
Break-even live
Sensitivity live
| Price | -10% $138 | -5% $64 | +0% $-11 | +5% $-85 | +10% $-159 |
|---|---|---|---|---|---|
| Rent | -10% $-158 | -5% $-84 | +0% $-11 | +5% $63 | +10% $137 |
| Rate | -1.0pp $98 | -0.5pp $44 | base $-11 | +0.5pp $-66 | +1.0pp $-123 |
UW: 25.0% down · 7.5% · 30yr · 1.5% tax · 5.0% vac · 8.0% maint · 8.0% mgmt
Financing live
Cash to close
- Down payment
- $53,750
- Closing costs
- $6,450
- Reserves months
- —
- Total cash needed
- —
Loan-product check · same deal, 3 products live
Conventional
25% down · 7.5% · 30yr
- Down + closing
- —
- Monthly P&I
- —
- Monthly cashflow
- —
- DSCR
- —
- Eligible?
- —
Personal DTI + credit; lowest rate.
DSCR
20% down · 8.5% · 30yr
- Down + closing
- —
- Monthly P&I
- —
- Monthly cashflow
- —
- DSCR
- —
- Eligible?
- —
No personal income docs; deal must DSCR.
Hard money
10% down · 12.0% · 12mo
- Down + closing
- —
- Monthly P&I
- —
- Monthly cashflow
- —
- DSCR
- —
- Eligible?
- —
Short-term bridge; refi at stabilization.
Rent comps 12 comps
| Address | Beds | Baths | Sqft | Rent | $/sqft | DOM | Units | Dist |
|---|---|---|---|---|---|---|---|---|
| 3536 Lena Ln Greenville, NC | 4.0 | 3.0 | 2450 | $2,250 | $0.92 | 15d | 1 | 0.51mi |
| 207 Belvedere Dr Greenville, NC | 3.0 | 2.0 | 1695 | $2,300 | $1.36 | 23d | 1 | 0.82mi |
| 1951 Cambria Dr Unit B Greenville, NC | 3.0 | 3.0 | 1552 | $1,800 | $1.16 | 23d | 1 | 0.95mi |
| 1632 Cambria Dr Unit B Greenville, NC | 3.0 | 3.0 | 1919 | $2,000 | $1.04 | 23d | 1 | 0.99mi |
| 1151 Cross Creek Cir Greenville, NC | 3.0 | 2.5 | 1338 | $1,600 | $1.20 | 23d | 1 | 1.16mi |
| 1151 Cross Creek Cir Unit D Greenville, NC | 3.0 | 2.5 | 1338 | $1,550 | $1.16 | 15d | 1 | 1.21mi |
| 3278 Colony Ct Greenville, NC | 1.0–3.0 | 1.0–2.0 | 1170 | $1,350 | $1.15 | 23d | 1 | 1.22mi |
| 2221 Brookville Dr Unit B Greenville, NC | 3.0 | 2.0 | 1508 | $1,700 | $1.13 | 23d | 1 | 1.25mi |
| 205 South Pointe Dr Unit B Winterville, NC | 3.0 | 2.5 | 1584 | $1,900 | $1.20 | 23d | 1 | 1.28mi |
| 1015 Spring Forest Rd Unit F5 Greenville, NC | 3.0 | 2.5 | 1453 | $1,200 | $0.83 | 23d | 1 | 1.30mi |
| 2500 Brookville Dr Greenville, NC | 3.0 | 2.0 | 1423 | $1,800 | $1.26 | 15d | 1 | 1.32mi |
| 1035 Spring Forest Rd Greenville, NC | 3.0 | 2.0–2.5 | 1453 | $1,450 | $1.00 | 23d | 2 | 1.33mi |
HOA detail condo
- Monthly dues
- $0 · $0/yr
- Assessments
- None detected in remarks — confirm with the listing agent.
Listing history 22 events
-
2026-06-21days on market $215,000 Active 34 DOM
-
2026-06-19days on market $215,000 Active 32 DOM
-
2026-06-18days on market $215,000 Active 31 DOM
-
2026-06-17days on market $215,000 Active 30 DOM
-
2026-06-16days on market $215,000 Active 29 DOM
-
2026-06-15days on market $215,000 Active 28 DOM
-
2026-06-13days on market $215,000 Active 25 DOM
-
2026-06-10days on market $215,000 Active 23 DOM
-
2026-06-09days on market $215,000 Active 22 DOM
-
2026-06-08days on market $215,000 Active 21 DOM
-
2026-06-07days on market $215,000 Active 20 DOM
-
2026-06-05days on market $215,000 Active 17 DOM
-
2026-06-03days on market $215,000 Active 16 DOM
-
2026-06-02days on market $215,000 Active 15 DOM
-
2026-06-01days on market $215,000 Active 14 DOM
-
2026-05-31days on market $215,000 Active 13 DOM
-
2026-05-30days on market $215,000 Active 12 DOM
-
2026-05-16$215,000 Active
-
2011-10-06soldstatus $15,000 208-char remark
Show marketing remark (212 chars)
Investors take note! 2 BR, 1 BA duplex. Located in quiet cul-de-sac area, No HOA. Priced to sell quickly. Selling as-is, where-is. Needs work. Can close ASAP, BRING ALL OFFERS!! Submit proof financing with offer.
-
2011-10-06soldstatus $15,000 212-char remark
Show marketing remark (212 chars)
Investors take note! 2 BR, 1 BA duplex. Located in quiet cul-de-sac area, No HOA. Priced to sell quickly. Selling as-is, where-is. Needs work. Can close ASAP, BRING ALL OFFERS!! Submit proof financing with offer.
-
2011-05-10$17,900 208-char remark
Show marketing remark (212 chars)
Investors take note! 2 BR, 1 BA duplex. Located in quiet cul-de-sac area, No HOA. Priced to sell quickly. Selling as-is, where-is. Needs work. Can close ASAP, BRING ALL OFFERS!! Submit proof financing with offer.
-
2011-05-10$17,900 212-char remark
Show marketing remark (212 chars)
Investors take note! 2 BR, 1 BA duplex. Located in quiet cul-de-sac area, No HOA. Priced to sell quickly. Selling as-is, where-is. Needs work. Can close ASAP, BRING ALL OFFERS!! Submit proof financing with offer.
ⓘ Source: listings_history table (triggers on properties + properties_extension) + one-shot
backfill from property_details.listing_events for pre-trigger history.
Climate risk First Street
- Flood 1/10 Low FEMA zone X (unshaded) · 0% chance over 30 yrs
- Wildfire 3/10 Moderate
- Heat 8/10 Severe 7 d/yr ≥106°F today · 17 d/yr by 30 yrs out
- Wind 8/10 Severe 80% chance of damaging wind over 30 yrs
- Air quality 3/10 Moderate 3 unhealthy d/yr today · 3 by 30 yrs out
Nearby sold comps map
Loading sold comps map…
Walkable amenities ~0.75 mi
Loading nearby amenities…
Taxation est. · year 1
- Rental income
- $22,410
- − Mortgage interest
- −$12,043
- − Property taxes
- −$3,225
- − Insurance
- −$1,075
- − Repairs & maintenance
- −$1,793
- − Management
- −$1,793
- − Depreciation
- −$6,255
- Taxable loss
- −$3,774
- Est. tax savings @ 24.0%
- +$906
- After-tax cash flow
- $779/yr
For passive investors: Depreciation is non-cash, so a rental often shows a tax loss while cash-flowing — sheltering income. Rental losses are passive: they offset passive income freely, and up to $25,000/yr can offset ordinary (W-2) income if you actively participate and your MAGI is under $100k (phasing out to $0 by $150k); unused losses carry forward. On sale, claimed depreciation is recaptured at up to 25%, and gains may owe capital-gains tax (a 1031 exchange can defer both). Figures are a year-1 estimate at your 24.0% rate — not tax advice; consult a CPA.
Condition & rehab AI · 1 photo
This multi-family property requires extensive repairs and updates to bring it up to market standards, significantly impacting its resale and rental value.
Repairs flagged
- Major exterior siding — Significant wear and tear
- Major roof — No visible damage, but age is unknown
- Major interior walls/paint — No visible interior, but age is unknown
- Major bathrooms — No visible bathrooms, but age is unknown
- Major kitchen — No visible kitchen, but age is unknown
- Major HVAC/mechanicals — No visible HVAC/mechanicals, but age is unknown
- Major windows — No visible windows, but age is unknown
- Major foundation/structure — No visible foundation/structure, but age is unknown
Value-add opportunities
- Both exterior siding replacement — Improves curb appeal and value
- Both roof replacement — Essential for long-term value
- Both interior painting — Enhances interior aesthetics and value
- Both bathroom updates — Modernizes and increases rental value
- Both kitchen updates — Modernizes and increases rental value
- Both HVAC/mechanical upgrades — Improves comfort and energy efficiency
- Both window replacements — Enhances energy efficiency and curb appeal
- Both foundation/structure repairs — Ensures structural integrity and value
Renovation cost estimate screening
| Repair item | Severity | Est. cost |
|---|---|---|
| exterior siding · Significant wear and tear | Major | $15,000–50,000 |
| roof · No visible damage, but age is unknown | Major | $15,000–50,000 |
| interior walls/paint · No visible interior, but age is unknown | Major | $15,000–50,000 |
| bathrooms · No visible bathrooms, but age is unknown | Major | $15,000–50,000 |
| kitchen · No visible kitchen, but age is unknown | Major | $15,000–50,000 |
| HVAC/mechanicals · No visible HVAC/mechanicals, but age is unknown | Major | $15,000–50,000 |
| windows · No visible windows, but age is unknown | Major | $15,000–50,000 |
| foundation/structure · No visible foundation/structure, but age is unknown | Major | $15,000–50,000 |
| Total estimated repair cost · 8 items | $120,000–400,000 |
Value-add ROI direction
- Both exterior siding replacement — Improves curb appeal and value ↑
- Both roof replacement — Essential for long-term value ↑
- Both interior painting — Enhances interior aesthetics and value ↑
- Both bathroom updates — Modernizes and increases rental value ↑
- Both kitchen updates — Modernizes and increases rental value ↑
- Both HVAC/mechanical upgrades — Improves comfort and energy efficiency ↑
- Both window replacements — Enhances energy efficiency and curb appeal ↑
- Both foundation/structure repairs — Ensures structural integrity and value ↑
ⓘ Cost ranges are severity-bucket heuristics (US national rule-of-thumb). Get contractor quotes + a written scope before underwriting a rehab budget.
Schools (NCES district)
- District
- Pitt County Schools
- NCES district ID
- 3700012
- Math proficiency
- 41% ▬ 0.00%
- Reading proficiency
- 44% ▲ 2.00%
- Median HH income
- $40,631
- Composite
- 35.67/100
- National rank
- #4877
- State rank
- #100 of 178 in NC
Livability — Greenville
- Score
- 77/100
- State rank
- #30
- US rank
- #2977
Category grades
Schools grade is shown separately in the Schools card above.
Census & demographics
- Census place
- Greenville, NC
- County
- Pitt County · 142,592 people
- City population
- 115,121
- Metro
- Greenville, NC
- Population (ZIP)
- 56,347
- Household income
- $48,935
- Rent vs Own
- Severe rent burden
- 3319.0
Population outlook (Pitt County) Hauer SSP2
- Today (2025)
- 194,585 people
- By 2030
- 203,756 · +4.7%
- By 2040
- 220,807 · +13.5%
- By 2050
- 236,614 · +21.6%
- By 2075
- 275,940 · +41.8%
- By 2100
- 300,058 · +54.2%
Race, ethnicity, and origin ACS 2023
- Neighborhood character
- Diverse neighborhood (Simpson 0.59)
- Race & ethnicity
- Black 54% White 33% Hispanic / Latino 8% Two or more races 3% Asian 2%
- Hispanic origin (detail)
- Mexican 7%
- Common ancestry
- Lithuanian 1% Slovak 1% Romanian 1%
- Foreign-born
- 7% · Canada, China
- Languages at home
- 91% English-only · Spanish 6% Other Asian/Pacific 1%
Political lean MEDSL · Pitt
- 2024 margin
- Lean D (+6.0) · D 52.5% · R 46.5% · Other 1.1%
- 2008→2024 swing
- -2.8pp toward R · 2008: 8.8pp · 2024: 6.0pp
- All cycles
- 2024: D+6.0 2020: D+9.4 2016: D+7.4 2012: D+6.7 2008: D+8.8
Not yet ingested
- Civics
- —
Market trends
- HPI YoY
- ▼ -187.99%
- Current HPI
- 190.6869
- Rent YoY
- ▲ 5.44%
- Metro
- Greenville, NC
- State GDP YoY
- ▲ 3.28%
- F500 in state
- 26
Industry mix (Fortune 500 HQ in NC)
| Industry | F500 HQs | Revenue |
|---|---|---|
| Financial Services | 2 | $213B |
|
||
| Retail | 2 | $95B |
|
||
| Industrial Conglomerate | 1 | $38B |
|
||
| Metals / Steel | 1 | $35B |
|
||
| Utilities | 1 | $30B |
|
||
| Industrial Machinery | 1 | $19B |
|
||
Price history
+1101.1% since first listed5 events — show timeline
- 2026-05-16 Listed $215,000 Hive MLS
- 2011-10-06 Sold (MLS) $15,000 Hive MLS
- 2011-10-06 Sold (MLS) $15,000 Hive MLS
- 2011-05-10 Listed $17,900 Hive MLS
- 2011-05-10 Listed $17,900 Hive MLS
Cash-flow waterfall
monthlySold comps — $/sqft
last 12 mo · ≤1 miLoading sold comps…