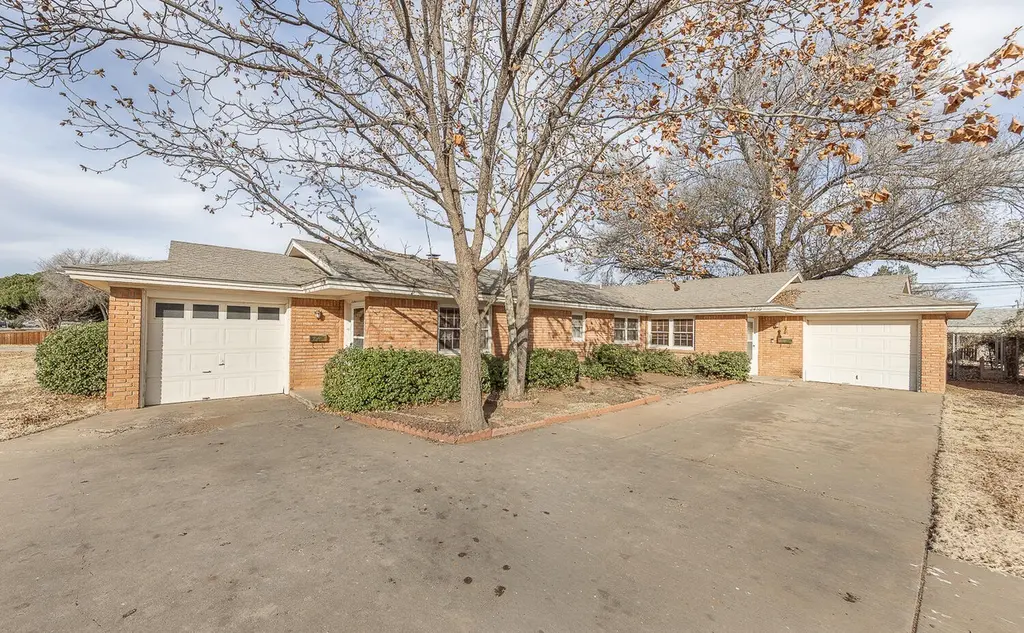
 Duplex
2410 33rd St · Lubbock, TX
Flood risk 1/10 · Minimal
- FEMA flood zone
- X (unshaded)
- Chance of flooding over 30 yrs
- 0.0%
- Est. flood insurance / yr
- $507 – $1,088
Fire risk 1/10 · Minimal
- Est. fire insurance / yr
- $1,222 – $2,270
Heat risk 5/10 · Moderate
- Hot days now (above 99°F)
- 7 days/yr
- Hot days in 30 yrs
- 21 days/yr
Wind risk 2/10 · Minimal
- Chance of severe wind over 30 yrs
- —
Air-quality risk 2/10 · Minimal
- Unhealthy air days now
- 1 days/yr
- Unhealthy air days in 30 yrs
- 1 days/yr
Risk factors via First Street. Map © Google.
Why this score? — see what drove the D+ grade
The composite is a weighted blend of 9 inputs, each scored 0–100. Each bar is that input's sub-score; the figure is the points it added to the 100-point composite (weight × sub-score).
- Cash flow +16.5/30.0
- ARV discount +7.5/15.0
- DSCR +5.1/10.0
- 1% rule +4.7/10.0
- Livability +4.0/5.0
- Schools +3.1/10.0
- Rent growth +3.0/5.0
- Condition / age +2.5/5.0
- Appreciation +0.0/10.0
$230,000
🖨 Deal sheet (PDF) 📄 Offer letter ✓ Due diligence
Multi-family units
County records classify this as Multi-Family (2-4 Unit). Listing-text estimate: 2 units. confirmed
Listing remarks
Discover the perfect addition to your rental portfolio with this well-maintained duplex offering a combined 2,291 sq ft of comfortable living space. Each side features 2 bedrooms and 1 full bath, providing desirable layouts for long-term tenants. Both units are currently leased, generating immediate and stable rental income--ideal for seasoned investors or first-time buyers looking to enter the multi-family market. This duplex is a rare find for anyone seeking dependable returns and minimal vacancy concerns. Don't miss this opportunity to secure a solid income-producing property!
Key facts
- 9,450 sq ft lot
- Garage
- Built 1964
Property features AI
Finance
- Other:
- Financial info:
- HOA & community:
Exterior
- Parking: Attached garage (1 garage space); Driveway parking; Off-street paved parking
- Security:
- Utilities: Public water; Public sewer
- Home design: Residential income property — duplex
- Construction: Brick veneer exterior; Composition roof; Slab foundation; Built area approximately 2,291 above-grade finished square feet
- Exterior features: Fenced backyard; Front yard; Asphalt road frontage on a city street; Publicly maintained road
Interior
- Kitchen:
- Bedrooms:
- Flooring:
- Bathrooms: 2 full bathrooms
- Heating & cooling: Central heating; Central air
- Interior features: Dual-unit cooling with separate meters; Ceiling fans
- Laundry & utility:
Neighborhood map
What this means for you Summary
Snapshot
- This is a 2 × 3-bed/?-bath units multifamily listed at $230k.
Deal economics
- At list price, monthly cash flow is $134 ($2k/yr) — positive. Per door: $67/mo.
- The deal already cash-flows at list — no discount required.
- To meet the 1% rule (rent ≥ 1% of price), the offer needs to be $222k (3.3% below list).
- Recommended offer: $222k (3.3% below list) — sets the bar for 1% rule.
Location & tenants
- Location reads 80/100 on livability (#37 in TX, #1,749 nationally) — a professional / high-income tenant draw. Strengths: commute A+, cost of living A+, housing A+; Watch: employment C-, crime F.
- Lubbock ISD (urban): math 36% / reading 39% proficiency, ranked #481 of 826 in TX (top 58%) — families likely to look elsewhere, expect single-tenant / working-renter base with shorter leases; 60% free/reduced lunch — lower-income household profile, screen leases tightly.
- Zoned schools: Brown El Gr Pk To 01 (188 students, 94% FRL); Slaton Middle (math 13% / reading 16%, grade F, #1,583 of 1,662 statewide, top 96%, 355 students, 96% FRL); Monterey H S (math 28% / reading 37%, grade F, #1,029 of 1,632 statewide, top 64%, 2,114 students, 72% FRL) — zoned schools average 87% FRL vs 60% district-wide (27 pts higher); higher-poverty schools than district average — tighter screening recommended.
- Zoned-school proficiency averages 24% at this address vs 38% district-wide (-14 pts) — the specific schools serving this property underperform the Lubbock ISD average; the district grade overstates school quality for this exact location.
- Market conditions: Rents rising (+1.9%/yr); 97 active listings in the ZIP; 2 comparable units currently listed for rent nearby; 2,219 units permitted in Lubbock County in 2024 (252 in 5+ unit buildings).
- At $2,224/mo this rent would consume 56% of the median local household income ($48k/yr) (locally 777% of renters already pay >50% of income on rent) — very limited rent-growth headroom before tenants either downsize or default.
Forward outlook
- Local home prices are declining (-3.0%/yr); year-one equity from $2k of loan paydown is wiped out by about $7k of value loss. Plan a longer hold.
- Lubbock County population projected at +39% by 2050 — long-run rental-demand tailwind backs the buy-and-hold thesis.
Negotiation context
- It's been on market 17 days — a 2% lower offer ($227k) is reasonable based on typical stale-listing flexibility.
Risks & watch-outs
- Climate carrying-cost: extreme-heat days projected 7→21/yr by 2055 (HVAC capex compounding) — expect insurance premiums to compound above CPI over the hold.
Questions for the listing agent
- Can we see the unit-by-unit rent roll, current vacancy, and any below-market leases? What's the average tenancy length?
- What capital expenditures (roof, boiler, parking lot, exteriors) have been made in the last 5 years, and what's planned in the next 2?
- Built in 1964 — when were the roof, HVAC, electrical panel, plumbing, and water heater last replaced?
- Is there a deadline driving the sale (1031 exchange, divorce, estate, relocation)? That informs how much negotiation room exists.
- Schools are D-rated, which usually means shorter tenancies and higher turnover. Who's the typical renter profile here, and what's been the actual vacancy rate?
- Crime grade is F in this area — have there been break-ins, vandalism, or insurance claims at this property in the last 3 years? What carrier currently insures it and at what premium?
- The area grade is low — what's the realistic commute time and amenity access for the typical tenant pool here? Any planned neighborhood developments (good or bad) we should know about?
- What's the average days-on-market for RENTAL listings here right now (not sales)? A rising rental-DOM trend means longer vacancies and softer asking-rent achievability than the comps imply.
- What's the recent tenant-quality profile in this submarket — average credit score on applications, eviction rate, late-payment / NSF rate, and stable-employment percentage? A property-management company in the area should have these aggregated.
- How much new apartment / multifamily construction is in the pipeline within 1–3 miles? Heavy new supply (>2% of stock underway) typically softens rents 12–24 months out; light construction supports rent growth.
Investment metrics
- 1% rule
- 0.97% ✗
- Cap rate
- 6.99%
- Cash-on-cash
- 2.50%
- DSCR
- 1.11
- GRM
- 8.6
CMA / ARV
No comps found within radius.
Projected returns pro-forma
-3.0% appreciation · 1.87% rent growth · sell at horizon
- IRR
- -13.6%
- Equity multiple
- 0.52×
- Total profit
- $-31,171
- Equity at exit
- $34,294
- IRR
- -6.6%
- Equity multiple
- 0.60×
- Total profit
- $-25,951
- Equity at exit
- $19,886
Cash invested: $64,400 (down + closing). Projections, not guarantees.
Landlord ↔ Tenant lean methodology
- Overall (STATE)
- 87 Strongly Landlord-Friendly
- State Texas
- 87 Strongly Landlord-Friendly · R+5
- County
- — inherits STATE
- City
- — inherits STATE
ZIP-level market 79411
- Home prices YoY
- -10.5%
- Rents YoY
- 1.9%
- Active inventory
- 97
- Price-to-rent
- 17.2×
Monthly cashflow live
- Estimated rent
- $2,224 high interval (Pro) →
- Mortgage (P&I)
- −$1,206
- Tax from tax record
- −$321 /mo · $3,850/yr
- Insurance
- −$96
- HOA
- −$0
- Vacancy / Maint / Mgmt
- −$467
- Net cashflow
- $134
Break-even live
Sensitivity live
| Price | -10% $264 | -5% $199 | +0% $134 | +5% $69 | +10% $4 |
|---|---|---|---|---|---|
| Rent | -10% $-42 | -5% $46 | +0% $134 | +5% $222 | +10% $310 |
| Rate | -1.0pp $250 | -0.5pp $193 | base $134 | +0.5pp $75 | +1.0pp $14 |
2-unit breakdown (identical units grouped — click to expand)
| Units | Beds | Baths | Est. rent |
|---|---|---|---|
| 2× units | 3 | — | $2,224 |
| #1 | 3 | — | $1,112 |
| #2 | 3 | — | $1,112 |
| Total (2 units) | $2,224 | ||
UW: 25.0% down · 7.5% · 30yr · 1.5% tax · 5.0% vac · 8.0% maint · 8.0% mgmt
Financing live
Cash to close
- Down payment
- $57,500
- Closing costs
- $6,900
- Reserves months
- —
- Total cash needed
- —
Loan-product check · same deal, 3 products live
Conventional
25% down · 7.5% · 30yr
- Down + closing
- —
- Monthly P&I
- —
- Monthly cashflow
- —
- DSCR
- —
- Eligible?
- —
Personal DTI + credit; lowest rate.
DSCR
20% down · 8.5% · 30yr
- Down + closing
- —
- Monthly P&I
- —
- Monthly cashflow
- —
- DSCR
- —
- Eligible?
- —
No personal income docs; deal must DSCR.
Hard money
10% down · 12.0% · 12mo
- Down + closing
- —
- Monthly P&I
- —
- Monthly cashflow
- —
- DSCR
- —
- Eligible?
- —
Short-term bridge; refi at stabilization.
Rent comps 2 comps
| Address | Beds | Baths | Sqft | Rent | $/sqft | DOM | Units | Dist |
|---|---|---|---|---|---|---|---|---|
| 2629 22nd St Lubbock, TX | 5.0 | 2.0 | 2218 | $1,399 | $0.63 | 45d | 1 | 0.76mi |
| 2703 54th St Lubbock, TX | 5.0 | 2.0 | 2116 | $2,000 | $0.95 | 45d | 1 | 1.44mi |
Listing history 22 events
-
2026-06-22days on market $230,000 Active 17 DOM
-
2026-06-18days on market $230,000 Active 14 DOM
-
2026-06-17days on market $230,000 Active 13 DOM
-
2026-06-16days on market $230,000 Active 12 DOM
-
2026-06-15days on market $230,000 Active 11 DOM
-
2026-06-14days on market $230,000 Active 9 DOM
-
2026-06-13days on market $230,000 Active 8 DOM
-
2026-06-10days on market $230,000 Active 6 DOM
-
2026-06-09days on market $230,000 Active 5 DOM
-
2026-06-08days on market $230,000 Active 4 DOM
-
2026-06-07days on market $230,000 Active 3 DOM
-
2026-06-05remarks 586-char remark
-
2026-06-05pricedays on market $230,000 Active 1 DOM
-
2026-06-03days on market $245,000 Active 173 DOM
-
2026-06-02days on market $245,000 Active 172 DOM
-
2026-06-01days on market $245,000 Active 171 DOM
-
2026-05-31days on market $245,000 Active 170 DOM
-
2026-05-30days on market $245,000 Active 169 DOM
-
2025-12-12$245,000 Active 591-char remark
-
2023-10-10soldstatus
-
2007-12-14soldstatus
-
1993-10-01soldstatus
ⓘ Source: listings_history table (triggers on properties + properties_extension) + one-shot
backfill from property_details.listing_events for pre-trigger history.
Tax reassessment forecast TX · Resets to sale price
- Current annual tax
- $3,850 · $321/mo
- Projected year-2 tax
- $4,209 · $351/mo
- Expected delta
- +$359/yr (+$30/mo · 9.3%)
ⓘ Screening estimate from a state-policy table — verify with the county assessor before closing.
Climate risk First Street
- Flood 1/10 Low FEMA zone X (unshaded) · 0% chance over 30 yrs
- Wildfire 1/10 Low
- Heat 5/10 Major 7 d/yr ≥99°F today · 21 d/yr by 30 yrs out
- Wind 2/10 Low
- Air quality 2/10 Low 1 unhealthy d/yr today · 1 by 30 yrs out
Nearby sold comps map
Loading sold comps map…
Walkable amenities ~0.75 mi
Loading nearby amenities…
Taxation est. · year 1
- Rental income
- $26,688
- − Mortgage interest
- −$12,884
- − Property taxes
- −$3,850
- − Insurance
- −$1,150
- − Repairs & maintenance
- −$2,135
- − Management
- −$2,135
- − Depreciation
- −$6,691
- Taxable loss
- −$2,156
- Est. tax savings @ 24.0%
- +$518
- After-tax cash flow
- $2,127/yr
For passive investors: Depreciation is non-cash, so a rental often shows a tax loss while cash-flowing — sheltering income. Rental losses are passive: they offset passive income freely, and up to $25,000/yr can offset ordinary (W-2) income if you actively participate and your MAGI is under $100k (phasing out to $0 by $150k); unused losses carry forward. On sale, claimed depreciation is recaptured at up to 25%, and gains may owe capital-gains tax (a 1031 exchange can defer both). Figures are a year-1 estimate at your 24.0% rate — not tax advice; consult a CPA.
Schools (NCES district)
- District
- Lubbock ISD
- NCES district ID
- 4828500
- Math proficiency
- 36% ▼ -8.00%
- Reading proficiency
- 39% ▼ -1.00%
- Median HH income
- $39,820
- Composite
- 31.44/100
- National rank
- #5984
- State rank
- #481 of 826 in TX
Livability — Lubbock
- Score
- 80/100
- State rank
- #37
- US rank
- #1749
Category grades
Schools grade is shown separately in the Schools card above.
Census & demographics
- Census place
- Lubbock, TX
- County
- Lubbock County · 293,542 people
- City population
- 283,030
- Metro
- Lubbock, TX
- Population (ZIP)
- 6,865
- Household income
- $47,634
- Rent vs Own
- Severe rent burden
- 777.0
Population outlook (Lubbock County) Hauer SSP2
- Today (2025)
- 345,960 people
- By 2030
- 371,449 · +7.4%
- By 2040
- 424,539 · +22.7%
- By 2050
- 481,150 · +39.1%
- By 2075
- 633,467 · +83.1%
- By 2100
- 746,853 · +115.9%
Race, ethnicity, and origin ACS 2023
- Neighborhood character
- Diverse neighborhood (Simpson 0.59)
- Race & ethnicity
- Hispanic / Latino 50% White 39% Two or more races 10% Black 9% Native American 2%
- Hispanic origin (detail)
- Mexican 37% Cuban 2%
- Common ancestry
- Slovak 3% Italian 2% Portuguese 2%
- Foreign-born
- 8% · Canada
- Languages at home
- 64% English-only · Spanish 35%
Political lean MEDSL · Lubbock
- 2024 margin
- Solid R (+39.5) · D 29.7% · R 69.2% · Other 1.0%
- 2008→2024 swing
- -2.8pp toward R · 2008: -36.7pp · 2024: -39.5pp
- All cycles
- 2024: R+39.5 2020: R+32.2 2016: R+38.4 2012: R+40.9 2008: R+36.7
Not yet ingested
- Civics
- —
Market trends
- HPI YoY
- ▼ -24.58%
- Current HPI
- 210.495
- Rent YoY
- ▲ 1.87%
- Metro
- Lubbock, TX
- State GDP YoY
- ▲ 3.95%
- F500 in state
- 110
Industry mix (Fortune 500 HQ in TX)
| Industry | F500 HQs | Revenue |
|---|---|---|
| Energy | 16 | $1,198B |
|
||
| Technology | 5 | $198B |
|
||
| Engineering / Construction | 4 | $72B |
|
||
| Energy Services | 3 | $60B |
|
||
| Utilities | 3 | $41B |
|
||
| Healthcare | 2 | $330B |
|
||
Price history
+0.0% since first listed5 events — show timeline
- 2026-06-04 Price Changed $230,000 LARMLS
- 2026-06-04 Listed $230,000 LARMLS
- 2023-10-10 Sold (Public Records) — Public Records
- 2007-12-14 Sold (Public Records) — Public Records
- 1993-10-01 Sold (Public Records) — Public Records
Property tax history
+4.5%/yrLatest (2025): $3,850 · -14.9% YoY. Source: county tax records.
Cash-flow waterfall
monthlySold comps — $/sqft
last 12 mo · ≤1 miLoading sold comps…