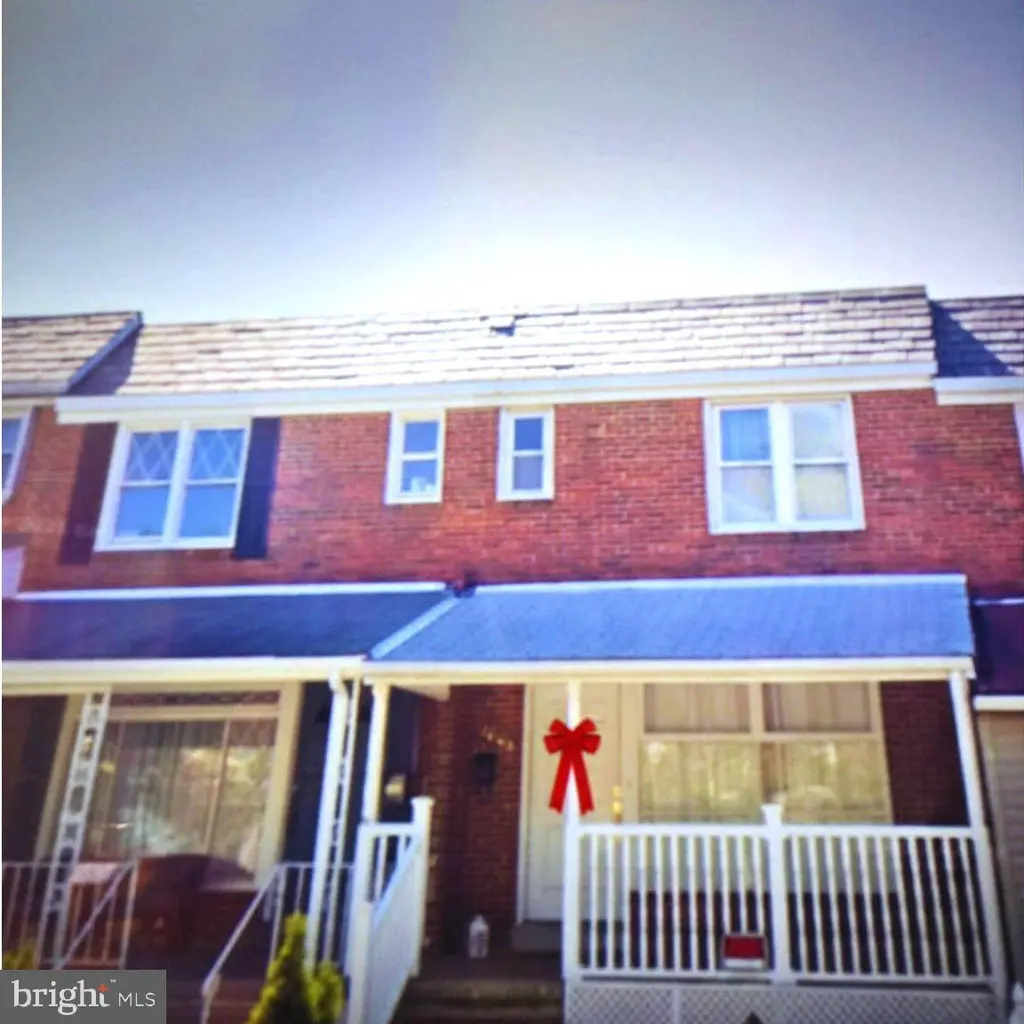
1004 Iris Ave · Baltimore, MD
Flood risk 1/10 · Minimal
- FEMA flood zone
- X (unshaded)
- Chance of flooding over 30 yrs
- 0.0%
- Est. flood insurance / yr
- $473 – $860
Fire risk 1/10 · Minimal
- Est. fire insurance / yr
- $755 – $1,403
Heat risk 8/10 · Major
- Hot days now (above 103°F)
- 7 days/yr
- Hot days in 30 yrs
- 15 days/yr
Wind risk 6/10 · Moderate
- Chance of severe wind over 30 yrs
- 27.0%
Air-quality risk 4/10 · Minor
- Unhealthy air days now
- 6 days/yr
- Unhealthy air days in 30 yrs
- 7 days/yr
Risk factors via First Street. Map © Google.
Why this score? — see what drove the C- grade
The composite is a weighted blend of 9 inputs, each scored 0–100. Each bar is that input's sub-score; the figure is the points it added to the 100-point composite (weight × sub-score).
- Cash flow +20.4/30.0
- ARV discount +7.5/15.0
- DSCR +6.5/10.0
- Rent growth +5.0/5.0
- 1% rule +4.8/10.0
- Livability +3.8/5.0
- Condition / age +2.5/5.0
- Schools +1.0/10.0
- Appreciation +0.0/10.0
$200,000
🖨 Deal sheet 📄 Offer letter ✓ Due diligence
Listing remarks MLS
Great opportunity to buy a beautifully renov/remod. townhome which includes, great front porch, New (kitchen, heating/ac unit, Hardwood floors, Deck), patio, All appliances convey. Great rec. /FR room w/ space for rooms, outside entrance & much more! Ground Rent Approx. Great financing available.
Key facts
- Built 1953
- Listed 14 days
Property features AI
Finance
- Financial info: Property condition listed as good; Ground rent charged (payment semi-annually)
Exterior
- Parking: Alley access; On-street parking
- Utilities: Public water; Public sewer; Electric cooling fuel; Natural gas for heating and hot water
- Home design: Interior townhouse/rowhouse; Ground rent ownership (semi-annual payment)
- Construction: Brick construction; Block foundation; Slate roof; Pets allowed with no restrictions; Year built estimated
- Exterior features: Chain link fencing; Not in a federal flood zone; Finished space below grade
Interior
- Kitchen: Dishwasher; Gas oven/range; Microwave; Refrigerator
- Bedrooms: Three bedrooms on the main level
- Flooring: Hardwood floors
- Bathrooms: Two full bathrooms on the main level; Two full bathrooms total
- Heating & cooling: Forced air heating (natural gas); Central air conditioning; Ceiling fan(s)
- Interior features: Traditional floor plan with a dedicated dining area; Finished basement with connecting stairway and walkout stairs
- Laundry & utility: Washer; Dryer; Natural gas water heater
Neighborhood map
What this means for you Summary
Snapshot
- This is a 3-bed/1.5-bath townhouse listed at $200k.
Deal economics
- At list price, monthly cash flow is $259 ($3k/yr) — positive.
- The deal already cash-flows at list — no discount required.
- To meet the 1% rule (rent ≥ 1% of price), the offer needs to be $196k (2.2% below list).
- Recommended offer: $196k (2.2% below list) — sets the bar for 1% rule.
- Cap rate 7.8% vs local median 6.0% in Baltimore — top-decile yield for the area; either an underpriced asset or a hidden risk that comps aren't pricing in. Stress-test before assuming the spread holds.
Location & tenants
- Location reads 76/100 on livability (#90 in MD, #3,396 nationally) — a middle-class / working-renter tenant base. Strengths: amenities A+, commute A+, housing A+; Watch: schools D, crime F.
- Baltimore City Public Schools (urban): math 7% / reading 16% proficiency, ranked #24 of 24 in MD (top 100%) — low school quality limits family demand, transient renter base, plan for 1-2y turnover; 79% free/reduced lunch — lower-income household profile, screen leases tightly.
- Market conditions: Rents rising fast (+9.9%/yr); 143 active listings in the ZIP; 40 comparable units currently listed for rent nearby; rentals at typical pace (median 24d on market — plan ~3-4 weeks tenant-placement turnaround); lower-income renter base — watch delinquency; 1,273 units permitted in Baltimore city in 2024 (1,104 in 5+ unit buildings).
- At $1,956/mo this rent would consume 54% of the median local household income ($43k/yr) (locally 966% of renters already pay >50% of income on rent) — very limited rent-growth headroom before tenants either downsize or default.
Forward outlook
- Local home prices are declining (-3.0%/yr); year-one equity from $1k of loan paydown is wiped out by about $6k of value loss. Plan a longer hold.
- Baltimore County population projected to shrink 4% by 2050 — rents likely to lag national; underwrite the cash flow, not the appreciation.
- At projected returns (-3.0% appreciation + 8.0% rent growth), your $56k cash investment doubles in ~9 years — after that, you're playing with house money.
Negotiation context
- Only 14 days on market — expect competitive offers; lowballing is unlikely to land.
- Current owner paid $100k; list at $200k implies a 100% gain — meaningful room to come down on a strong offer.
Risks & watch-outs
- Watch-outs: built in 1953 — expect roof / HVAC / electrical / plumbing capex.
- Climate carrying-cost: major wind risk, 27% chance of damaging wind over 30y; extreme-heat days projected 7→15/yr by 2055 (HVAC capex compounding) — expect insurance premiums to compound above CPI over the hold.
Questions for the listing agent
- Built in 1953 — when were the roof, HVAC, electrical panel, plumbing, and water heater last replaced?
- Is there a deadline driving the sale (1031 exchange, divorce, estate, relocation)? That informs how much negotiation room exists.
- Schools are D-rated, which usually means shorter tenancies and higher turnover. Who's the typical renter profile here, and what's been the actual vacancy rate?
- Crime grade is F in this area — have there been break-ins, vandalism, or insurance claims at this property in the last 3 years? What carrier currently insures it and at what premium?
- What's the average days-on-market for RENTAL listings here right now (not sales)? A rising rental-DOM trend means longer vacancies and softer asking-rent achievability than the comps imply.
- What's the recent tenant-quality profile in this submarket — average credit score on applications, eviction rate, late-payment / NSF rate, and stable-employment percentage? A property-management company in the area should have these aggregated.
- How much new for-sale + rental construction is in the pipeline within 1–3 miles? Heavy new supply typically softens prices + rents 12–24 months out; constrained supply supports both.
Investment metrics
- 1% rule
- 0.98% ✗
- Cap rate
- 7.85%
- Cash-on-cash
- 5.55%
- DSCR
- 1.25
- GRM
- 8.5
CMA / ARV
- ARV (on-the-fly)
- $122,286
- Comps found
- 12
Show comp detail 12 sales within ~0.75 mi
| Address | Dist | Beds/Ba | Sqft | Sold | Price | $/sf | Match |
|---|---|---|---|---|---|---|---|
| 33 N Kresson St | 0.67mi | 3/1.0 | 1,372 (-0%) | 3mo | $79,000 | $58 | 64 |
| 3609 Fayette St E | 0.64mi | 2/1.5 (-1) | 1,390 (+1%) | 2mo | $119,900 | $86 | 62 |
| 1403 N Decker Ave | 0.69mi | 3/2.0 | 1,420 (+3%) | 4mo | $94,500 | $67 | 57 |
| 443 Robinson St N | 0.70mi | 3/2.0 | 1,440 (+5%) | 3mo | $165,000 | $115 | 55 |
| 601 N Decker Ave | 0.70mi | 2/1.0 (-1) | 1,344 (-2%) | 4mo | $120,000 | $89 | 53 |
| 522 N Ellwood Ave | 0.71mi | 3/1.0 | 1,296 (-6%) | 3mo | $85,000 | $66 | 53 |
| 3135 Mcelderry St | 0.63mi | 3/2.0 | 1,224 (-11%) | 1mo | $234,000 | $191 | 49 |
| 1214 N Potomac St | 0.71mi | 3/2.0 | 1,268 (-8%) | 4mo | $72,000 | $57 | 48 |
| 111 N Highland Ave | 0.74mi | 3/1.5 | 1,170 (-15%) | 1mo | $105,000 | $90 | 40 |
| 4117 Eastmont Ave | 0.75mi | 3/2.0 | 1,176 (-14%) | 1mo | $224,900 | $191 | 38 |
| 149 N Highland Ave | 0.69mi | 2/1.0 (-1) | 1,170 (-15%) | 1mo | $75,000 | $64 | 35 |
| 626 N Decker Ave | 0.71mi | 4/1.0 (+1) | 1,170 (-15%) | 5mo | $135,000 | $115 | 31 |
Match score weights: distance 35% · size 25% · config 20% · recency 20%. Top-matched comps best support the ARV.
Projected returns pro-forma
-3.0% appreciation · 8.0% rent growth · sell at horizon
- IRR
- -2.5%
- Equity multiple
- 0.90×
- Total profit
- $-5,593
- Equity at exit
- $29,821
- IRR
- 11.8%
- Equity multiple
- 2.13×
- Total profit
- $63,319
- Equity at exit
- $17,292
Cash invested: $56,000 (down + closing). Projections, not guarantees.
Landlord ↔ Tenant lean methodology
- Overall (CITY)
- 12 Strongly Tenant-Friendly
- State Maryland
- 27 Tenant-Leaning · D+14
- County
- — inherits STATE
- City Baltimore
- 12 Strongly Tenant-Friendly · D+58
ZIP-level market 21205
- Home prices YoY
- -5.8%
- Rents YoY
- 9.9%
- Active inventory
- 143
- Price-to-rent
- 8.5×
Monthly cashflow live
- Estimated rent
- $1,956 high interval (Pro) →
- Mortgage (P&I)
- −$1,049
- Tax from tax record
- −$154 /mo · $1,849/yr
- Insurance
- −$83
- HOA
- −$0
- Vacancy / Maint / Mgmt
- −$411
- Net cashflow
- $259
Break-even live
UW: 25.0% down · 7.5% · 30yr · 1.5% tax · 5.0% vac · 8.0% maint · 8.0% mgmt
Financing live
Cash to close
- Down payment
- $50,000
- Closing costs
- $6,000
- Reserves months
- —
- Total cash needed
- —
Loan-product check · same deal, 3 products live
Conventional
25% down · 7.5% · 30yr
- Down + closing
- —
- Monthly P&I
- —
- Monthly cashflow
- —
- DSCR
- —
- Eligible?
- —
Personal DTI + credit; lowest rate.
DSCR
20% down · 8.5% · 30yr
- Down + closing
- —
- Monthly P&I
- —
- Monthly cashflow
- —
- DSCR
- —
- Eligible?
- —
No personal income docs; deal must DSCR.
Hard money
10% down · 12.0% · 12mo
- Down + closing
- —
- Monthly P&I
- —
- Monthly cashflow
- —
- DSCR
- —
- Eligible?
- —
Short-term bridge; refi at stabilization.
Rent comps 40 comps
| Address | Beds | Baths | Sqft | Rent | $/sqft | DOM | Units | Dist |
|---|---|---|---|---|---|---|---|---|
| 3304 McElderry St Baltimore, MD | 3.0 | 2.0 | 1413 | $1,900 | $1.34 | 43d | 1 | 0.55mi |
| 1215 N Ellwood Ave Baltimore, MD | 3.0 | 1.0 | 1128 | $1,795 | $1.59 | 23d | 1 | 0.62mi |
| 1310 N Ellwood Ave #1 Baltimore, MD | 2.0 | 1.0 | 1000 | $1,550 | $1.55 | 21d | 1 | 0.64mi |
| 1310 N Ellwood Ave Baltimore, MD | 2.0 | 1.0 | 1000 | $1,450 | $1.45 | 12d | 1 | 0.64mi |
| 4300 Orchard Ridge Blvd Baltimore, MD | 1.0–3.0 | 1.0–2.0 | 1021 | $1,809 | $1.77 | 43d | 1 | 0.69mi |
| 809 N Curley St Baltimore, MD | 3.0 | 1.0 | 1746 | $1,400 | $0.80 | 21d | 1 | 0.71mi |
| 404 N Robinson St Baltimore, MD | 3.0 | 3.0 | 1320 | $2,100 | $1.59 | 16d | 1 | 0.72mi |
| 404 N Robinson St Baltimore, MD | 3.0 | 3.0 | 1320 | $2,200 | $1.67 | 23d | 1 | 0.72mi |
| 2934 E Monument St Baltimore, MD | 2.0 | 1.0 | 1200 | $1,499 | $1.25 | 43d | 1 | 0.72mi |
| 520 N Decker Ave Baltimore, MD | 2.0 | 1.0 | 1000 | $1,650 | $1.65 | 43d | 1 | 0.73mi |
| 724 N Curley St Baltimore, MD | 3.0 | 3.0 | 1500 | $2,200 | $1.47 | 4d | 1 | 0.74mi |
| 718 N Curley St Baltimore, MD | 3.0 | 3.0 | 1500 | $2,000 | $1.33 | 4d | 1 | 0.74mi |
| 113 N Clinton St Baltimore, MD | 2.0 | 1.0 | 1300 | $1,995 | $1.53 | 43d | 1 | 0.76mi |
| 3430 E Baltimore St Baltimore, MD | 3.0 | 2.5 | 1316 | $2,250 | $1.71 | 23d | 1 | 0.77mi |
| 1403 N Linwood Ave Baltimore, MD | 3.0 | 2.0 | 1660 | $1,995 | $1.20 | 43d | 1 | 0.78mi |
| 3205 Esther Pl Baltimore, MD | 2.0 | 2.0 | 960 | $1,850 | $1.93 | 23d | 1 | 0.78mi |
| 203 N Ellwood Ave Unit Main Baltimore, MD | 2.0 | 2.0 | 880 | $2,200 | $2.50 | 23d | 1 | 0.79mi |
| 4104 Erdman Ave Unit 2 Baltimore, MD | 2.0 | 1.0 | 1566 | $1,075 | $0.69 | 4d | 1 | 0.79mi |
| 3436 Leverton Ave Baltimore, MD | 3.0 | 3.5 | 1500 | $2,350 | $1.57 | 23d | 1 | 0.81mi |
| 2815 E Madison St Baltimore, MD | 4.0 | 2.0 | 1300 | $2,500 | $1.92 | 43d | 1 | 0.81mi |
| 2903 Jefferson St Baltimore, MD | 3.0 | 3.0 | 1609 | $1,850 | $1.15 | 43d | 1 | 0.82mi |
| 1 N Clinton St Baltimore, MD | 4.0 | 1.5 | 1200 | $1,700 | $1.42 | 20d | 1 | 0.82mi |
| 3304 E Baltimore St Baltimore, MD | 3.0 | 1.5 | 1514 | $1,875 | $1.24 | 43d | 1 | 0.83mi |
| 115 S Eaton St Baltimore, MD | 3.0 | 2.5 | 1393 | $1,800 | $1.29 | 16d | 1 | 0.83mi |
| 3502 E Lombard St Baltimore, MD | 3.0 | 2.0 | 1522 | $1,870 | $1.23 | 43d | 1 | 0.84mi |
| 17 N East Ave Baltimore, MD | 2.0 | 2.0 | 1326 | $2,550 | $1.92 | 23d | 1 | 0.84mi |
| 2729 Ashland Ave Baltimore, MD | 3.0 | 1.0 | 1000 | $1,350 | $1.35 | 2d | 1 | 0.85mi |
| 3914 Erdman Ave #1 Baltimore, MD | 3.0 | 1.0 | 1200 | $1,319 | $1.10 | 17d | 1 | 0.85mi |
| 1323 N Kenwood Ave Unit 1 Baltimore, MD | 2.0 | 1.5 | 1060 | $1,350 | $1.27 | 23d | 1 | 0.86mi |
| 3902 Erdman Ave Unit 1 Baltimore, MD | 2.0 | 1.0 | 1000 | $1,275 | $1.27 | 23d | 1 | 0.87mi |
| 3603 Ravenwood Ave Unit 1 Baltimore, MD | 4.0 | 1.0 | 1566 | $1,600 | $1.02 | 43d | 1 | 0.87mi |
| 113 N Decker Ave Baltimore, MD | 3.0 | 3.5 | 1800 | $2,850 | $1.58 | 23d | 1 | 0.87mi |
| 29 N Ellwood Ave Baltimore, MD | 3.0 | 1.5 | 1100 | $2,395 | $2.18 | 23d | 1 | 0.87mi |
| 3710 E Pratt St Baltimore, MD | 2.0 | 3.5 | 1230 | $1,900 | $1.54 | 23d | 1 | 0.88mi |
| 133 S Macon St Baltimore, MD | 2.0 | 2.5 | 1440 | $2,400 | $1.67 | 17d | 1 | 0.89mi |
| 2706 E Biddle St Baltimore, MD | 3.0 | 2.0 | 1577 | $1,395 | $0.88 | 43d | 1 | 0.90mi |
| 2815 Orleans St Baltimore, MD | 2.0 | 1.0 | 1204 | $1,600 | $1.33 | 2d | 1 | 0.90mi |
| 10 N Ellwood Ave Baltimore, MD | 4.0 | 2.5 | 1768 | $2,500 | $1.41 | 43d | 1 | 0.90mi |
| 531 N Belnord Ave Baltimore, MD | 2.0 | 1.5 | 1100 | $1,700 | $1.55 | 23d | 1 | 0.91mi |
| 150 N Curley St Baltimore, MD | 2.0 | 2.5 | 1266 | $1,850 | $1.46 | 17d | 1 | 0.91mi |
Listing history 19 events
-
2026-06-18days on market $200,000 Active 14 DOM
-
2026-06-17days on market $200,000 Active 13 DOM
-
2026-06-16days on market $200,000 Active 12 DOM
-
2026-06-15days on market $200,000 Active 11 DOM
-
2026-06-13days on market $200,000 Active 9 DOM
-
2026-06-09days on market $200,000 Active 5 DOM
-
2026-06-08days on market $200,000 Active 4 DOM
-
2026-06-07pricedays on market $200,000 Active 3 DOM
-
2026-06-04remarks 699-char remark
-
2026-06-04pricestatusdays on market $199,900 Active 1 DOM
-
2026-06-03days on market $200,000 Coming Soon 13 DOM
-
2026-06-02days on market $200,000 Coming Soon 12 DOM
-
2026-06-01days on market $200,000 Coming Soon 11 DOM
-
2026-05-31days on market $200,000 Coming Soon 10 DOM
-
2026-05-21historical $200,000
-
2006-04-04soldstatus $100,000
-
2006-03-24soldstatus $100,000 303-char remark
Show marketing remark (303 chars)
Great opportunity to buy a beautifully renov/remod. townhome which includes, great front porch, New (kitchen, heating/ac unit, Hardwood floors, Deck), patio, All appliances convey. Great rec. /FR room w/ space for rooms, outside entrance & much more! Ground Rent Approx. Great financing available.
-
2006-02-23historical 303-char remark
Show marketing remark (303 chars)
Great opportunity to buy a beautifully renov/remod. townhome which includes, great front porch, New (kitchen, heating/ac unit, Hardwood floors, Deck), patio, All appliances convey. Great rec. /FR room w/ space for rooms, outside entrance & much more! Ground Rent Approx. Great financing available.
-
2006-01-26$134,900 303-char remark
Show marketing remark (303 chars)
Great opportunity to buy a beautifully renov/remod. townhome which includes, great front porch, New (kitchen, heating/ac unit, Hardwood floors, Deck), patio, All appliances convey. Great rec. /FR room w/ space for rooms, outside entrance & much more! Ground Rent Approx. Great financing available.
ⓘ Source: listings_history table (triggers on properties + properties_extension) + one-shot
backfill from property_details.listing_events for pre-trigger history.
Tax reassessment forecast MD · Partial reset (capped growth)
- Current annual tax
- $1,849 · $154/mo
- Projected year-2 tax
- $2,014 · $168/mo
- Expected delta
- +$166/yr (+$14/mo · 9.0%)
ⓘ Screening estimate from a state-policy table — verify with the county assessor before closing.
Climate risk First Street
- Flood 1/10 Low FEMA zone X (unshaded) · 0% chance over 30 yrs
- Wildfire 1/10 Low
- Heat 8/10 Severe 7 d/yr ≥103°F today · 15 d/yr by 30 yrs out
- Wind 6/10 Major 27% chance of damaging wind over 30 yrs
- Air quality 4/10 Moderate 6 unhealthy d/yr today · 7 by 30 yrs out
Nearby sold comps map
Loading sold comps map…
Walkable amenities ~0.75 mi
Loading nearby amenities…
Taxation est. · year 1
- Rental income
- $23,475
- − Mortgage interest
- −$11,203
- − Property taxes
- −$1,849
- − Insurance
- −$1,000
- − Repairs & maintenance
- −$1,878
- − Management
- −$1,878
- − Depreciation
- −$5,818
- Taxable loss
- −$152
- Est. tax savings @ 24.0%
- +$36
- After-tax cash flow
- $3,147/yr
For passive investors: Depreciation is non-cash, so a rental often shows a tax loss while cash-flowing — sheltering income. Rental losses are passive: they offset passive income freely, and up to $25,000/yr can offset ordinary (W-2) income if you actively participate and your MAGI is under $100k (phasing out to $0 by $150k); unused losses carry forward. On sale, claimed depreciation is recaptured at up to 25%, and gains may owe capital-gains tax (a 1031 exchange can defer both). Figures are a year-1 estimate at your 24.0% rate — not tax advice; consult a CPA.
Schools (NCES district)
- District
- Baltimore City Public Schools
- NCES district ID
- 2400090
- Math proficiency
- 7% ▼ -9.00%
- Reading proficiency
- 16% ▼ -5.00%
- Median HH income
- $42,108
- Composite
- 10.08/100
- National rank
- #9805
- State rank
- #24 of 24 in MD
Livability — Baltimore
- Score
- 76/100
- State rank
- #90
- US rank
- #3396
Category grades
Schools grade is shown separately in the Schools card above.
Census & demographics
- Census place
- Baltimore, MD
- County
- Baltimore City · 558,601 people
- City population
- 588,727
- Metro
- Baltimore-Columbia-Towson, MD
- Population (ZIP)
- 13,013
- Household income
- $43,176
- Rent vs Own
- Severe rent burden
- 966.0
Population outlook (Baltimore County) Hauer SSP2
- Today (2025)
- 624,249 people
- By 2030
- 621,541 · -0.4%
- By 2040
- 609,756 · -2.3%
- By 2050
- 597,249 · -4.3%
- By 2075
- 552,236 · -11.5%
- By 2100
- 513,934 · -17.7%
Race, ethnicity, and origin ACS 2023
- Neighborhood character
- Diverse neighborhood (Simpson 0.60)
- Race & ethnicity
- Black 60% Hispanic / Latino 16% White 14% Two or more races 11% Asian 3%
- Hispanic origin (detail)
- Mexican 1% Cuban 1% Dominican 4%
- Common ancestry
- Slovak 3% Romanian 1%
- Foreign-born
- 16% · Canada, China
- Languages at home
- 79% English-only · Spanish 11% Arabic 4% Chinese 1%
Political lean MEDSL · Baltimore
- 2024 margin
- Solid D (+73.0) · D 85.2% · R 12.2% · Other 2.6%
- 2008→2024 swing
- -2.5pp toward R · 2008: 75.5pp · 2024: 73.0pp
- All cycles
- 2024: D+73.0 2020: D+76.6 2016: D+74.6 2012: D+76.4 2008: D+75.5
Not yet ingested
- Civics
- —
Market trends
- HPI YoY
- ▼ -15.03%
- Current HPI
- 244.1345
- Rent YoY
- ▲ 9.88%
- Metro
- Baltimore-Columbia-Towson, MD
- State GDP YoY
- ▲ 2.97%
- F500 in state
- 12
Industry mix (Fortune 500 HQ in MD)
| Industry | F500 HQs | Revenue |
|---|---|---|
| Aerospace / Defense | 1 | $71B |
|
||
| Utilities | 1 | $25B |
|
||
| Hotels | 1 | $24B |
|
||
| Consumer Goods | 1 | $7B |
|
||
| Real Estate | 1 | $6B |
|
||
| Chemicals | 1 | $2B |
|
||
Price history
+48.3% since first listed5 events — show timeline
- 2026-05-21 Coming Soon $200,000 BRIGHT MLS
- 2006-04-04 Sold (Public Records) $100,000 Public Records
- 2006-03-24 Sold (MLS) $100,000 MRIS
- 2006-02-23 Delisted — MRIS
- 2006-01-26 Listed $134,900 MRIS
Property tax history
-1.6%/yrLatest (2025): $1,849 · +1.4% YoY. Source: county tax records.
Cash-flow waterfall
monthlySold comps — $/sqft
last 12 mo · ≤1 miLoading sold comps…