 🏗️ New Construction
Cognac V A Plan · Hammond, LA
Flood risk No data
- FEMA flood zone
- —
- Chance of flooding over 30 yrs
- —
- Est. flood insurance / yr
- —
Fire risk No data
- Est. fire insurance / yr
- —
Heat risk No data
- Hot days now (above threshold)
- —
- Hot days in 30 yrs
- —
Wind risk No data
- Chance of severe wind over 30 yrs
- —
Air-quality risk No data
- Unhealthy air days now
- —
- Unhealthy air days in 30 yrs
- —
Risk factors via First Street. Map © Google.
Why this score? — see what drove the F grade
The composite is a weighted blend of 9 inputs, each scored 0–100. Each bar is that input's sub-score; the figure is the points it added to the 100-point composite (weight × sub-score).
- ARV discount +7.5/15.0
- Cash flow +6.7/30.0
- Condition / age +4.8/5.0
- Livability +3.5/5.0
- Rent growth +2.6/5.0
- Schools +2.0/10.0
- 1% rule +1.7/10.0
- DSCR +0.9/10.0
- Appreciation +0.0/10.0
$285,990
🖨 Deal sheet 📄 Offer letter ✓ Due diligence
Listing remarks MLS
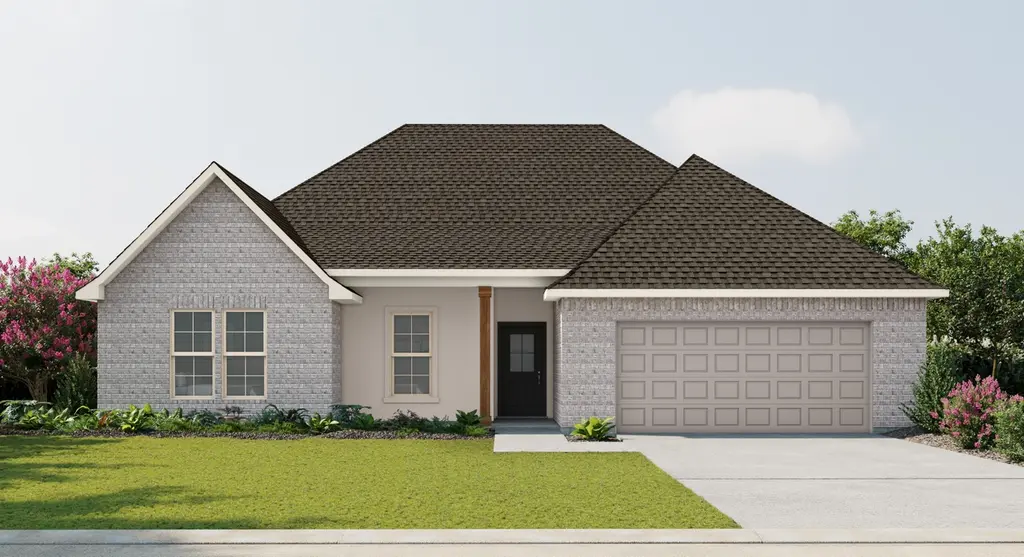
Introducing the Cognac V A floor plan by DSLD Homes, an energy-efficient home designed to offer the perfect blend of style, functionality, and sustainability. With 2,171 square feet of living space and a total area of 2,922 square feet, this home provides ample space for families who seek modern comfort and energy savings. The open floor plan creates an expansive and inviting atmosphere that connects the kitchen, living room, and dining areas, ideal for both everyday living and entertaining. Featuring four bedrooms and two bathrooms, the Cognac V A offers generous space to accommodate growing families, while ensuring privacy and comfort for everyone. The kitchen is thoughtfully designed with recessed can lighting and includes a walk-in pantry for ample storage. The boot bench offers added convenience in the mudroom, keeping your home organized and clutter-free. The living room is bright and welcoming, providing a space for relaxation and family gatherings. The master suite is a luxurious retreat, complete with a double vanity, garden tub, separate master shower, and a walk-in master closet that offers plenty of storage. The home's stucco, brick, and siding exterior provides both durability and curb appeal, while the covered patio allows for outdoor enjoyment year-round. The two-car garage adds practical storage and parking options, while the Cognac V A floor plan is designed with energy-efficient features that help reduce utility costs, making this home both affordable an
Key facts
- <open floor plan>
- <pocket office>
- 2 garage spots
Tags
Neighborhood map
What this means for you Summary
Snapshot
- This is a 4-bed/2.0-bath single-family listed at $286k. Condition is rated excellent.
Deal economics
- At list price, monthly cash flow is $-548 ($-7k/yr) — negative.
- To cash-flow at today's rent, offer at most $262k (8.5% below list).
- To meet the 1% rule (rent ≥ 1% of price), the offer needs to be $229k (20.0% below list).
- Recommended offer: $229k (20.0% below list) — sets the bar for 1% rule.
Location & tenants
- Location reads 69/100 on livability (#77 in LA) — a middle-class / working-renter tenant base. Strengths: cost of living A+, health & safety A+; Watch: amenities C-, commute D+, schools D.
- Tangipahoa Parish (rural): math 18% / reading 29% proficiency, ranked #63 of 98 in LA (top 64%) — low school quality limits family demand, transient renter base, plan for 1-2y turnover; 73% free/reduced lunch — lower-income household profile, screen leases tightly.
- Market conditions: Rents flat; 329 active listings in the ZIP; 3 comparable units currently listed for rent nearby; rentals lingering (median 44d on market — plan ~5-8 weeks vacancy on turnover, expect pricing pressure); 100% of comp listings sitting > 30 days — soft ceiling on asking rent; 1,085 units permitted in Tangipahoa Parish in 2024 (378 in 5+ unit buildings).
- At $2,288/mo this rent would consume 54% of the median local household income ($51k/yr) (locally 1201% of renters already pay >50% of income on rent) — very limited rent-growth headroom before tenants either downsize or default.
Forward outlook
- Local home prices are declining (-3.0%/yr); year-one equity from $2k of loan paydown is wiped out by about $10k of value loss. Plan a longer hold.
- Tangipahoa County population projected at +22% by 2050 — long-run rental-demand tailwind backs the buy-and-hold thesis.
Negotiation context
- It's been on market 805 days — a 12% lower offer ($252k) is reasonable based on typical stale-listing flexibility.
Questions for the listing agent
- What do current leases actually rent for vs. the listed asking? Can we see a recent rent roll and the last 12 months of T-12 income?
- It's been on market 805 days. Have you received any prior offers? Is the seller open to a 20% concession, seller financing, or rate buy-down credit?
- Why hasn't it sold? Are there any deal-killer items the seller is aware of (foundation, flood, title, zoning, code violations)?
- Is there a deadline driving the sale (1031 exchange, divorce, estate, relocation)? That informs how much negotiation room exists.
- Schools are D-rated, which usually means shorter tenancies and higher turnover. Who's the typical renter profile here, and what's been the actual vacancy rate?
- Crime grade is F in this area — have there been break-ins, vandalism, or insurance claims at this property in the last 3 years? What carrier currently insures it and at what premium?
- The area grade is low — what's the realistic commute time and amenity access for the typical tenant pool here? Any planned neighborhood developments (good or bad) we should know about?
- What's the average days-on-market for RENTAL listings here right now (not sales)? A rising rental-DOM trend means longer vacancies and softer asking-rent achievability than the comps imply.
- What's the recent tenant-quality profile in this submarket — average credit score on applications, eviction rate, late-payment / NSF rate, and stable-employment percentage? A property-management company in the area should have these aggregated.
- How much new for-sale + rental construction is in the pipeline within 1–3 miles? Heavy new supply typically softens prices + rents 12–24 months out; constrained supply supports both.
Investment metrics
- 1% rule
- 0.67% ✗
- Cap rate
- 4.36%
- Cash-on-cash
- -6.89%
- DSCR
- 0.69
- GRM
- 12.4
CMA / ARV
- ARV (median comp)
- $340,824
- List price
- $285,990
- Delta
- -16.09%
- Verdict
- UNDERPRICED
- Comps
- 20 within 1.0 mi
Show comp detail 12 sales within ~0.75 mi
| Address | Dist | Beds/Ba | Sqft | Sold | Price | $/sf | Match |
|---|---|---|---|---|---|---|---|
| 44368 Lake Wind Dr | 0.03mi | 4/3.0 | 2,175 (+0%) | 1mo | $349,865 | $161 | 94 |
| 44312 Lake Wind Dr | 0.09mi | 4/3.0 | 2,175 (+0%) | 0mo | $337,710 | $155 | 91 |
| 44262 Lake Wind Dr | 0.03mi | 4/3.0 | 2,175 (+0%) | 4mo | $338,644 | $156 | 91 |
| 44404 Lake Wind Dr | 0.24mi | 4/2.0 | 1,935 (-11%) | 1mo | $300,954 | $156 | 70 |
| 44328 Lake Wind Dr | 0.24mi | 4/3.0 | 2,375 (+9%) | 1mo | $348,234 | $147 | 68 |
| 44202 Shadowpoint Dr | 0.21mi | 4/2.0 | 1,858 (-14%) | 2mo | $299,000 | $161 | 65 |
| 19406 Chelwood Ct | 0.22mi | 4/2.0 | 1,858 (-14%) | 3mo | $284,790 | $153 | 63 |
| 44250 Lake Willow Rd | 0.35mi | 3/2.0 (-1) | 1,887 (-13%) | 0mo | $277,810 | $147 | 56 |
| 19318 Chelwood Ct | 0.46mi | 4/2.0 | 1,858 (-14%) | 2mo | $286,565 | $154 | 52 |
| 43449 Denali Dr | 0.59mi | 3/2.0 (-1) | 1,951 (-10%) | 1mo | $339,000 | $174 | 50 |
| 43460 Denali Dr | 0.61mi | 4/2.0 | 1,896 (-13%) | 2mo | $297,500 | $157 | 49 |
| 43421 Biscayne Dr | 0.71mi | 4/2.0 | 1,900 (-12%) | 2mo | $299,000 | $157 | 44 |
Match score weights: distance 35% · size 25% · config 20% · recency 20%. Top-matched comps best support the ARV.
Projected returns pro-forma
-3.0% appreciation · 0.33% rent growth · sell at horizon
- IRR
- -31.2%
- Equity multiple
- -0.01×
- Total profit
- $-96,061
- Equity at exit
- $50,818
- IRR
- -52.3%
- Equity multiple
- -0.59×
- Total profit
- $-151,712
- Equity at exit
- $29,468
Cash invested: $95,431 (down + closing). Projections, not guarantees.
Landlord ↔ Tenant lean methodology
- Overall (STATE)
- 90 Strongly Landlord-Friendly
- State Louisiana
- 90 Strongly Landlord-Friendly · R+12
- County
- — inherits STATE
- City
- — inherits STATE
ZIP-level market 70403
- Home prices YoY
- -34.1%
- Rents YoY
- 0.3%
- Active inventory
- 329
- Price-to-rent
- 10.4×
Monthly cashflow live
- Estimated rent
- $2,288 medium interval (Pro) →
- Mortgage (P&I)
- −$1,787
- Tax est. 1.5%
- −$426 /mo · $5,112/yr
- Insurance
- −$142
- HOA
- −$0
- Vacancy / Maint / Mgmt
- −$481
- Net cashflow
- $-548
Break-even live
UW: 25.0% down · 7.5% · 30yr · 1.5% tax · 5.0% vac · 8.0% maint · 8.0% mgmt
Financing live
Cash to close
- Down payment
- $85,206
- Closing costs
- $10,225
- Reserves months
- —
- Total cash needed
- —
Loan-product check · same deal, 3 products live
Conventional
25% down · 7.5% · 30yr
- Down + closing
- —
- Monthly P&I
- —
- Monthly cashflow
- —
- DSCR
- —
- Eligible?
- —
Personal DTI + credit; lowest rate.
DSCR
20% down · 8.5% · 30yr
- Down + closing
- —
- Monthly P&I
- —
- Monthly cashflow
- —
- DSCR
- —
- Eligible?
- —
No personal income docs; deal must DSCR.
Hard money
10% down · 12.0% · 12mo
- Down + closing
- —
- Monthly P&I
- —
- Monthly cashflow
- —
- DSCR
- —
- Eligible?
- —
Short-term bridge; refi at stabilization.
Rent comps 3 comps
| Address | Beds | Baths | Sqft | Rent | $/sqft | DOM | Units | Dist |
|---|---|---|---|---|---|---|---|---|
| 44243 Kendalwood Dr Hammond, LA | 3.0 | 2.0 | 1826 | $2,200 | $1.20 | 43d | 1 | 0.20mi |
| 20175 Kingland Dr Hammond, LA | 3.0 | 2.5 | 2300 | $2,300 | $1.00 | 43d | 1 | 0.60mi |
| 43293 Quiet Lake Dr Hammond, LA | 4.0 | 2.0 | 1850 | $3,840 | $2.08 | 43d | 1 | 1.01mi |
Listing history 18 events
-
2026-06-19days on market $285,990 Active 805 DOM
-
2026-06-18days on market $285,990 Active 804 DOM
-
2026-06-17days on market $285,990 Active 803 DOM
-
2026-06-16days on market $285,990 Active 802 DOM
-
2026-06-15days on market $285,990 Active 801 DOM
-
2026-06-14days on market $285,990 Active 799 DOM
-
2026-06-13days on market $285,990 Active 798 DOM
-
2026-06-10days on market $285,990 Active 796 DOM
-
2026-06-09days on market $285,990 Active 795 DOM
-
2026-06-08days on market $285,990 Active 794 DOM
-
2026-06-07days on market $285,990 Active 793 DOM
-
2026-06-05days on market $285,990 Active 790 DOM
-
2026-06-03days on market $285,990 Active 789 DOM
-
2026-06-02days on market $285,990 Active 788 DOM
-
2026-06-01days on market $285,990 Active 787 DOM
-
2026-05-31days on market $285,990 Active 786 DOM
-
2026-05-30days on market $285,990 Active 785 DOM
-
2024-04-05$285,990 Active 1496-char remark
Show marketing remark (1496 chars)
Introducing the Cognac V A floor plan by DSLD Homes, an energy-efficient home designed to offer the perfect blend of style, functionality, and sustainability. With 2,171 square feet of living space and a total area of 2,922 square feet, this home provides ample space for families who seek modern comfort and energy savings. The open floor plan creates an expansive and inviting atmosphere that connects the kitchen, living room, and dining areas, ideal for both everyday living and entertaining. Featuring four bedrooms and two bathrooms, the Cognac V A offers generous space to accommodate growing families, while ensuring privacy and comfort for everyone. The kitchen is thoughtfully designed with recessed can lighting and includes a walk-in pantry for ample storage. The boot bench offers added convenience in the mudroom, keeping your home organized and clutter-free. The living room is bright and welcoming, providing a space for relaxation and family gatherings. The master suite is a luxurious retreat, complete with a double vanity, garden tub, separate master shower, and a walk-in master closet that offers plenty of storage. The home's stucco, brick, and siding exterior provides both durability and curb appeal, while the covered patio allows for outdoor enjoyment year-round. The two-car garage adds practical storage and parking options, while the Cognac V A floor plan is designed with energy-efficient features that help reduce utility costs, making this home both affordable an
ⓘ Source: listings_history table (triggers on properties + properties_extension) + one-shot
backfill from property_details.listing_events for pre-trigger history.
Nearby sold comps map
Loading sold comps map…
Walkable amenities ~0.75 mi
Loading nearby amenities…
Taxation est. · year 1
- Rental income
- $27,459
- − Mortgage interest
- −$19,091
- − Property taxes
- −$5,112
- − Insurance
- −$1,704
- − Repairs & maintenance
- −$2,197
- − Management
- −$2,197
- − Depreciation
- −$9,915
- Taxable loss
- −$12,757
- Est. tax savings @ 24.0%
- +$3,062
- After-tax cash flow
- $-3,510/yr
For passive investors: Depreciation is non-cash, so a rental often shows a tax loss while cash-flowing — sheltering income. Rental losses are passive: they offset passive income freely, and up to $25,000/yr can offset ordinary (W-2) income if you actively participate and your MAGI is under $100k (phasing out to $0 by $150k); unused losses carry forward. On sale, claimed depreciation is recaptured at up to 25%, and gains may owe capital-gains tax (a 1031 exchange can defer both). Figures are a year-1 estimate at your 24.0% rate — not tax advice; consult a CPA.
Condition & rehab AI · 2 photos
This single-family home in Hammond, LA, is in excellent condition with no visible repairs or maintenance needed. It offers a spacious floor plan and is ready for immediate move-in. Potential buyers and renters will appreciate the curb appeal and interior updates that can be made to further enhance its value.
Value-add opportunities
- Both Painting exterior and interior walls — Enhances curb appeal and interior aesthetics
- Both Landscaping improvements — Enhances curb appeal and adds value
- Both New flooring in bathrooms and kitchen — Improves functionality and aesthetics
- Both New kitchen appliances — Enhances functionality and aesthetics
- Both New bathroom fixtures — Enhances functionality and aesthetics
Renovation cost estimate screening
Value-add ROI direction
- Both Painting exterior and interior walls — Enhances curb appeal and interior aesthetics ↑
- Both Landscaping improvements — Enhances curb appeal and adds value ↑
- Both New flooring in bathrooms and kitchen — Improves functionality and aesthetics ↑
- Both New kitchen appliances — Enhances functionality and aesthetics ↑
- Both New bathroom fixtures — Enhances functionality and aesthetics ↑
ⓘ Cost ranges are severity-bucket heuristics (US national rule-of-thumb). Get contractor quotes + a written scope before underwriting a rehab budget.
Schools (NCES district)
- District
- Tangipahoa Parish
- NCES district ID
- 2201680
- Math proficiency
- 18% ▼ -32.00%
- Reading proficiency
- 29% ▼ -31.00%
- Median HH income
- $41,283
- Composite
- 19.94/100
- National rank
- #8676
- State rank
- #63 of 98 in LA
Livability — Hammond
- Score
- 69/100
- State rank
- #77
- US rank
- #8868
Category grades
Schools grade is shown separately in the Schools card above.
Census & demographics
- County
- Tangipahoa Parish · 85,958 people
- City population
- 51,394
- Metro
- Hammond, LA
- Population (ZIP)
- 30,173
- Household income
- $50,976
- Rent vs Own
- Severe rent burden
- 1201.0
Population outlook (Tangipahoa County) Hauer SSP2
- Today (2025)
- 144,204 people
- By 2030
- 151,413 · +5.0%
- By 2040
- 164,374 · +14.0%
- By 2050
- 175,427 · +21.7%
- By 2075
- 195,165 · +35.3%
- By 2100
- 201,641 · +39.8%
Race, ethnicity, and origin ACS 2023
- Neighborhood character
- Diverse neighborhood (Simpson 0.56)
- Race & ethnicity
- White 55% Black 37% Hispanic / Latino 6% Two or more races 6%
- Hispanic origin (detail)
- Mexican 3%
- Common ancestry
- Lithuanian 9% Serbian 1% Slovak 1%
- Foreign-born
- 3% · Canada
- Languages at home
- 95% English-only · Spanish 4% Arabic 1%
Political lean MEDSL · Tangipahoa
- 2024 margin
- Solid R (+37.4) · D 30.6% · R 68.0% · Other 1.3%
- 2008→2024 swing
- -6.5pp toward R · 2008: -30.9pp · 2024: -37.4pp
- All cycles
- 2024: R+37.4 2020: R+32.8 2016: R+32.6 2012: R+27.7 2008: R+30.9
Not yet ingested
- Civics
- —
Market trends
- HPI YoY
- ▼ -66.04%
- Current HPI
- 127.4535
- Rent YoY
- ▲ 0.33%
- Metro
- Hammond, LA
- State GDP YoY
- ▲ 3.29%
- F500 in state
- 10
Industry mix (Fortune 500 HQ in LA)
| Industry | F500 HQs | Revenue |
|---|---|---|
| Telecommunications | 2 | $23B |
|
||
| Utilities | 1 | $12B |
|
||
| Wholesale / Distribution | 1 | $5B |
|
||
| Advertising | 1 | $2B |
|
||
Price history
1 event — show timeline
- 2024-04-05 Listed $285,990 Zillow
Cash-flow waterfall
monthlySold comps — $/sqft
last 12 mo · ≤1 miLoading sold comps…