 Duplex
412 S Pearl St · Rocky Mount, NC
Flood risk 1/10 · Minimal
- FEMA flood zone
- X (unshaded)
- Chance of flooding over 30 yrs
- 0.0%
- Est. flood insurance / yr
- $507 – $1,088
Fire risk 3/10 · Minor
- Est. fire insurance / yr
- $906 – $1,684
Heat risk 8/10 · Major
- Hot days now (above 107°F)
- 7 days/yr
- Hot days in 30 yrs
- 16 days/yr
Wind risk 6/10 · Moderate
- Chance of severe wind over 30 yrs
- 72.0%
Air-quality risk 2/10 · Minimal
- Unhealthy air days now
- 1 days/yr
- Unhealthy air days in 30 yrs
- 2 days/yr
Risk factors via First Street. Map © Google.
Why this score? — see what drove the D- grade
The composite is a weighted blend of 9 inputs, each scored 0–100. Each bar is that input's sub-score; the figure is the points it added to the 100-point composite (weight × sub-score).
- Cash flow +15.0/30.0
- 1% rule +5.0/10.0
- DSCR +5.0/10.0
- Livability +3.5/5.0
- Rent growth +2.5/5.0
- Schools +2.2/10.0
- ARV discount +1.4/15.0
- Condition / age +1.0/5.0
- Appreciation +0.0/10.0
$55,555
🖨 Deal sheet (PDF) 📄 Offer letter ✓ Due diligence
Multi-family units
County records classify this as Multi-Family (2-4 Unit). Listing-text estimate: 2 units. confirmed
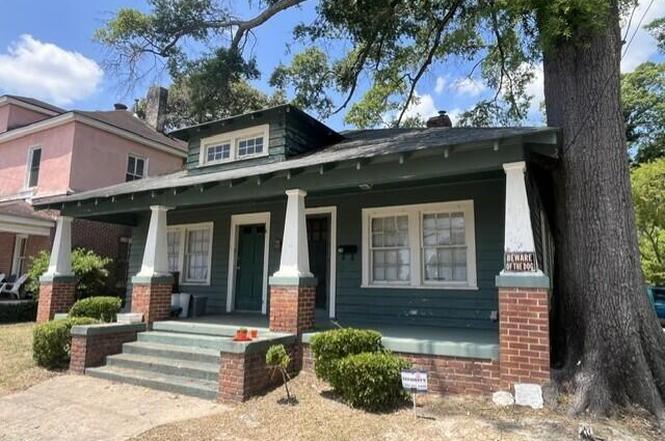
Listing remarks
Vintage 1910 Craftsman Duplex on a . 13 Acre lot. Many original features: lap siding, divided light windows, hardwood floors, doors, casings, plaster walls etc. Efficient 2 Bedroom, 1 Bathroom layout in each of the vertical-split units. Shared, covered, gabled front porch. Each unit has rare, private side porch. Behind each rear porch is a fenced, outside storage area, Both sides renovated in 2005 with 2 New Electric panels & 2 HVAC units. Roof from +/- 2014. 2 short blocks to the RR Station & Downtown Rocky Mount, just beyond that.
Key facts
- Plaster walls
- Lap siding
- Craftsman duplex
Tags
Property features AI
Finance
- Other: Lot dimensions approximately 75 x 80; Lot roughly 0.14 acres; No pool; No other structures
- Financial info: Multi-family with 2 total units; Owner pays exterior maintenance; Tenants pay all utilities and trash collection
- HOA & community: No association; Community features include curbs, sidewalks, street lights, historic area, suburban setting
Exterior
- Parking: 6 open parking spaces; Off-street, side-by-side unassigned parking; Street parking available
- Utilities: Public water; Public sewer; Electricity connected; Natural gas connected; Cable available; Phone available; Water connected
- Home design: Duplex, site-built; One story; Faces east; Named building: THE LITTLE GREEN HOUSE
- Construction: Wood siding exterior; Brick/mortar foundation; Asphalt roof; One building; Built as a duplex
- Exterior features: Covered front and rear porches; Porch; Back yard fencing (wood); Garden
Interior
- Kitchen: No appliances listed
- Bedrooms: 4 bedrooms
- Flooring: Wood flooring; Linoleum flooring
- Bathrooms: 2 full bathrooms
- Heating & cooling: Central heating (electric, natural gas) — forced air and heat pump listed; No central heating currently flagged; Central air and heat pump cooling; Ceiling fans; Separate meters for heating/cooling (multi-unit)
- Interior features: Wood-frame windows; Crawl space basement; Garden on the property; Fixer condition
- Laundry & utility: Separate utility meters (multi-unit)
Neighborhood map
What this means for you Summary
Snapshot
- This is a 2 × 2-bed/1.0-bath units multifamily listed at $56k. Condition is rated poor.
Deal economics
- At list price, monthly cash flow is $2k ($20k/yr) — positive. Per door: $817/mo.
- The deal already cash-flows at list — no discount required.
- Meets the 1% rule at list price ($3k rent vs $56k).
- Cap rate 41.6% vs local median 4.5% in Rocky Mount — top-decile yield for the area; either an underpriced asset or a hidden risk that comps aren't pricing in. Stress-test before assuming the spread holds.
Location & tenants
- Location reads 70/100 on livability (#134 in NC) — a middle-class / working-renter tenant base. Strengths: cost of living A+, housing A+, health & safety A+; Watch: crime F, amenities F, employment F.
- Nash-Rocky Mount Schools (rural): math 20% / reading 32% proficiency, ranked #155 of 178 in NC (top 87%) — low school quality limits family demand, transient renter base, plan for 1-2y turnover.
- Zoned schools: D S Johnson Elementary (math 3% / reading 13%, grade F, #1,396 of 1,410 statewide, top 99%, 362 students, 95% FRL); Rocky Mount Middle (math 7% / reading 26%, grade F, #449 of 475 statewide, top 96%, 407 students, 97% FRL); Rocky Mount High (math 27% / reading 36%, grade F, #449 of 535 statewide, top 85%, 1,072 students, 76% FRL) — zoned schools average 89% FRL vs 59% district-wide (30 pts higher); higher-poverty schools than district average — tighter screening recommended.
- Market conditions: Rents soft (-0.2%/yr); 392 active listings in the ZIP; 500 units permitted in Nash County in 2024 (0 in 5+ unit buildings).
- At $2,554/mo this rent would consume 50% of the median local household income ($61k/yr) (locally 710% of renters already pay >50% of income on rent) — very limited rent-growth headroom before tenants either downsize or default.
Forward outlook
- Local home prices are declining (-3.0%/yr); year-one equity from $384 of loan paydown is wiped out by about $2k of value loss. Plan a longer hold.
- Nash County population projected at -12% by 2050 — secular population decline; favor cash flow + early exit over multi-decade hold.
- At projected returns (-3.0% appreciation + 0.0% rent growth), your $16k cash investment doubles in ~1 year — after that, you're playing with house money.
Negotiation context
- Only 3 days on market — expect competitive offers; lowballing is unlikely to land.
Risks & watch-outs
- Watch-outs: built in 1910 — expect roof / HVAC / electrical / plumbing capex.
- Climate carrying-cost: major wind risk, 72% chance of damaging wind over 30y; extreme-heat days projected 7→16/yr by 2055 (HVAC capex compounding) — expect insurance premiums to compound above CPI over the hold.
Questions for the listing agent
- Can we see the unit-by-unit rent roll, current vacancy, and any below-market leases? What's the average tenancy length?
- What capital expenditures (roof, boiler, parking lot, exteriors) have been made in the last 5 years, and what's planned in the next 2?
- Have any recent inspections been done? Can we get a copy of the seller's disclosures and any deferred-maintenance estimates?
- Built in 1910 — when were the roof, HVAC, electrical panel, plumbing, and water heater last replaced?
- Is there a deadline driving the sale (1031 exchange, divorce, estate, relocation)? That informs how much negotiation room exists.
- Schools are F-rated, which usually means shorter tenancies and higher turnover. Who's the typical renter profile here, and what's been the actual vacancy rate?
- Crime grade is F in this area — have there been break-ins, vandalism, or insurance claims at this property in the last 3 years? What carrier currently insures it and at what premium?
- The area grade is low — what's the realistic commute time and amenity access for the typical tenant pool here? Any planned neighborhood developments (good or bad) we should know about?
- What's the average days-on-market for RENTAL listings here right now (not sales)? A rising rental-DOM trend means longer vacancies and softer asking-rent achievability than the comps imply.
- What's the recent tenant-quality profile in this submarket — average credit score on applications, eviction rate, late-payment / NSF rate, and stable-employment percentage? A property-management company in the area should have these aggregated.
- How much new apartment / multifamily construction is in the pipeline within 1–3 miles? Heavy new supply (>2% of stock underway) typically softens rents 12–24 months out; light construction supports rent growth.
Investment metrics
- 1% rule
- 4.60% ✓
- Cap rate
- 41.58%
- Cash-on-cash
- 126.03%
- DSCR
- 6.61
- GRM
- 1.8
CMA / ARV
- ARV (on-the-fly)
- $48,952
- Comps found
- 1
Show comp detail 1 sale within ~0.75 mi
| Address | Dist | Beds/Ba | Sqft | Sold | Price | $/sf | Match |
|---|---|---|---|---|---|---|---|
| 829 Gay St | 0.67mi | 3/2.0 (-1) | 1,672 (-1%) | 24mo | $49,000 | $29 | 43 |
Match score weights: distance 35% · size 25% · config 20% · recency 20%. Top-matched comps best support the ARV.
Projected returns pro-forma
-3.0% appreciation · 0.0% rent growth · sell at horizon
- IRR
- —
- Equity multiple
- 6.63×
- Total profit
- $87,605
- Equity at exit
- $8,283
- IRR
- —
- Equity multiple
- 12.67×
- Total profit
- $181,501
- Equity at exit
- $4,803
Cash invested: $15,555 (down + closing). Projections, not guarantees.
Landlord ↔ Tenant lean methodology
- Overall (STATE)
- 85 Strongly Landlord-Friendly
- State North Carolina
- 85 Strongly Landlord-Friendly · R+3
- County
- — inherits STATE
- City
- — inherits STATE
ZIP-level market 27804
- Rents YoY
- -0.2%
- Active inventory
- 392
- Price-to-rent
- 3.6×
Monthly cashflow live
- Estimated rent
- $2,554 medium interval (Pro) →
- Mortgage (P&I)
- −$291
- Tax est. 1.5%
- −$69 /mo · $833/yr
- Insurance
- −$23
- HOA
- −$0
- Vacancy / Maint / Mgmt
- −$536
- Net cashflow
- $1,634
Break-even live
Sensitivity live
| Price | -10% $1,672 | -5% $1,653 | +0% $1,634 | +5% $1,615 | +10% $1,595 |
|---|---|---|---|---|---|
| Rent | -10% $1,432 | -5% $1,533 | +0% $1,634 | +5% $1,735 | +10% $1,835 |
| Rate | -1.0pp $1,662 | -0.5pp $1,648 | base $1,634 | +0.5pp $1,619 | +1.0pp $1,605 |
2-unit breakdown (identical units grouped — click to expand)
| Units | Beds | Baths | Est. rent |
|---|---|---|---|
| 2× units | 2 | 1 | $2,554 |
| #1 | 2 | 1 | $1,277 |
| #2 | 2 | 1 | $1,277 |
| Total (2 units) | $2,554 | ||
UW: 25.0% down · 7.5% · 30yr · 1.5% tax · 5.0% vac · 8.0% maint · 8.0% mgmt
Financing live
Cash to close
- Down payment
- $13,889
- Closing costs
- $1,667
- Reserves months
- —
- Total cash needed
- —
Loan-product check · same deal, 3 products live
Conventional
25% down · 7.5% · 30yr
- Down + closing
- —
- Monthly P&I
- —
- Monthly cashflow
- —
- DSCR
- —
- Eligible?
- —
Personal DTI + credit; lowest rate.
DSCR
20% down · 8.5% · 30yr
- Down + closing
- —
- Monthly P&I
- —
- Monthly cashflow
- —
- DSCR
- —
- Eligible?
- —
No personal income docs; deal must DSCR.
Hard money
10% down · 12.0% · 12mo
- Down + closing
- —
- Monthly P&I
- —
- Monthly cashflow
- —
- DSCR
- —
- Eligible?
- —
Short-term bridge; refi at stabilization.
Listing history 3 events
-
2026-06-21days on market $55,555 Active 3 DOM
-
2026-06-18remarks 542-char remark
-
2026-06-18$55,555 Active 1 DOM
ⓘ Source: listings_history table (triggers on properties + properties_extension) + one-shot
backfill from property_details.listing_events for pre-trigger history.
Climate risk First Street
- Flood 1/10 Low FEMA zone X (unshaded) · 0% chance over 30 yrs
- Wildfire 3/10 Moderate
- Heat 8/10 Severe 7 d/yr ≥107°F today · 16 d/yr by 30 yrs out
- Wind 6/10 Major 72% chance of damaging wind over 30 yrs
- Air quality 2/10 Low 1 unhealthy d/yr today · 2 by 30 yrs out
Nearby sold comps map
Loading sold comps map…
Walkable amenities ~0.75 mi
Loading nearby amenities…
Taxation est. · year 1
- Rental income
- $30,648
- − Mortgage interest
- −$3,112
- − Property taxes
- −$833
- − Insurance
- −$278
- − Repairs & maintenance
- −$2,452
- − Management
- −$2,452
- − Depreciation
- −$1,616
- Taxable income
- $19,905
- Est. tax owed @ 24.0%
- −$4,777
- After-tax cash flow
- $14,828/yr
For passive investors: Depreciation is non-cash, so a rental often shows a tax loss while cash-flowing — sheltering income. Rental losses are passive: they offset passive income freely, and up to $25,000/yr can offset ordinary (W-2) income if you actively participate and your MAGI is under $100k (phasing out to $0 by $150k); unused losses carry forward. On sale, claimed depreciation is recaptured at up to 25%, and gains may owe capital-gains tax (a 1031 exchange can defer both). Figures are a year-1 estimate at your 24.0% rate — not tax advice; consult a CPA.
Condition & rehab AI · 13 photos
This property requires extensive repairs and maintenance, including structural repairs, painting, and replacing missing cabinets and countertops. The home's poor condition and lack of updates significantly reduce its value and appeal to potential buyers and renters.
Repairs flagged
- Major Exposed wiring — Safety hazard and potential electrical failure
- Major Missing cabinets — Structural integrity compromised
- Major Damaged countertops — Safety hazard and potential water damage
- Major Peeling paint — Structural integrity compromised
- Major Missing siding — Structural integrity compromised
- Major Damaged windows — Structural integrity compromised
Value-add opportunities
- Both Painting and repainting the exterior and interior — Enhances curb appeal and interior aesthetics, attracting more buyers and renters
- Both Replacing missing cabinets and countertops — Improves functionality and safety, attracting more buyers and renters
- Both Rebuilding the roof — Ensures structural integrity and protects the home from weather damage
- Both Rebuilding the exterior and replacing damaged siding — Enhances curb appeal and structural integrity, attracting more buyers and renters
- Both Rebuilding the windows — Ensures structural integrity and protects the home from weather damage
Renovation cost estimate screening
| Repair item | Severity | Est. cost |
|---|---|---|
| Exposed wiring · Safety hazard and potential electrical failure | Major | $15,000–50,000 |
| Missing cabinets · Structural integrity compromised | Major | $15,000–50,000 |
| Damaged countertops · Safety hazard and potential water damage | Major | $15,000–50,000 |
| Peeling paint · Structural integrity compromised | Major | $15,000–50,000 |
| Missing siding · Structural integrity compromised | Major | $15,000–50,000 |
| Damaged windows · Structural integrity compromised | Major | $15,000–50,000 |
| Total estimated repair cost · 6 items | $90,000–300,000 |
Value-add ROI direction
- Both Painting and repainting the exterior and interior — Enhances curb appeal and interior aesthetics, attracting more buyers and renters ↑
- Both Replacing missing cabinets and countertops — Improves functionality and safety, attracting more buyers and renters ↑
- Both Rebuilding the roof — Ensures structural integrity and protects the home from weather damage ↑
- Both Rebuilding the exterior and replacing damaged siding — Enhances curb appeal and structural integrity, attracting more buyers and renters ↑
- Both Rebuilding the windows — Ensures structural integrity and protects the home from weather damage ↑
ⓘ Cost ranges are severity-bucket heuristics (US national rule-of-thumb). Get contractor quotes + a written scope before underwriting a rehab budget.
Schools (NCES district)
- District
- Nash-Rocky Mount Schools
- NCES district ID
- 3703270
- Math proficiency
- 20% ▼ -3.00%
- Reading proficiency
- 32% ▲ 1.00%
- Median HH income
- $41,553
- Composite
- 22.04/100
- National rank
- #8198
- State rank
- #155 of 178 in NC
Livability — Rocky Mount
- Score
- 70/100
- State rank
- #134
- US rank
- #7692
Category grades
Schools grade is shown separately in the Schools card above.
Census & demographics
- Census place
- Rocky Mount, NC
- County
- Nash County · 50,768 people
- City population
- 70,300
- Metro
- Rocky Mount, NC
- Population (ZIP)
- 30,713
- Household income
- $61,359
- Rent vs Own
- Severe rent burden
- 710.0
Population outlook (Nash County) Hauer SSP2
- Today (2025)
- 91,107 people
- By 2030
- 89,193 · -2.1%
- By 2040
- 84,959 · -6.7%
- By 2050
- 80,517 · -11.6%
- By 2075
- 72,941 · -19.9%
- By 2100
- 63,602 · -30.2%
Race, ethnicity, and origin ACS 2023
- Neighborhood character
- Diverse neighborhood (Simpson 0.59)
- Race & ethnicity
- Black 52% White 38% Hispanic / Latino 6% Two or more races 3% Asian 1%
- Hispanic origin (detail)
- Mexican 2%
- Common ancestry
- Lithuanian 1% Italian 1% Slovak 1%
- Foreign-born
- 4% · Canada
- Languages at home
- 94% English-only · Spanish 5% Other Indo-European 1%
Political lean MEDSL · Nash
- 2024 margin
- Toss-up / Even · D 48.7% · R 50.5%
- 2008→2024 swing
- -0.4pp no change · 2008: -1.3pp · 2024: -1.8pp
- All cycles
- 2024: R+1.8 2020: D+0.2 2016: R+0.2 2012: D+0.9 2008: R+1.3
Not yet ingested
- Civics
- —
Market trends
- HPI YoY
- ▼ -142.83%
- Current HPI
- 183.0082
- Rent YoY
- ▼ -0.17%
- Metro
- Rocky Mount, NC
- State GDP YoY
- ▲ 3.28%
- F500 in state
- 26
Industry mix (Fortune 500 HQ in NC)
| Industry | F500 HQs | Revenue |
|---|---|---|
| Financial Services | 2 | $213B |
|
||
| Retail | 2 | $95B |
|
||
| Industrial Conglomerate | 1 | $38B |
|
||
| Metals / Steel | 1 | $35B |
|
||
| Utilities | 1 | $30B |
|
||
| Industrial Machinery | 1 | $19B |
|
||
Price history
1 event — show timeline
- 2026-06-17 Listed $55,555 TMLS
Cash-flow waterfall
monthlySold comps — $/sqft
last 12 mo · ≤1 miLoading sold comps…