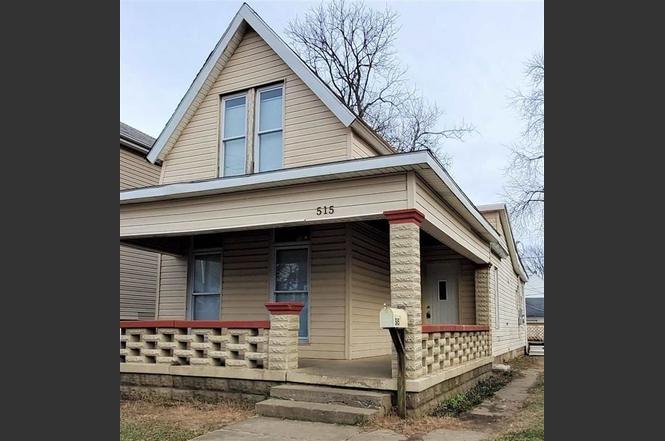
515 N 19th St · Richmond, IN
Flood risk 1/10 · Minimal
- FEMA flood zone
- X (unshaded)
- Chance of flooding over 30 yrs
- 0.0%
- Est. flood insurance / yr
- $473 – $860
Fire risk 1/10 · Minimal
- Est. fire insurance / yr
- $717 – $1,331
Heat risk 3/10 · Minor
- Hot days now (above 100°F)
- 7 days/yr
- Hot days in 30 yrs
- 18 days/yr
Wind risk 2/10 · Minimal
- Chance of severe wind over 30 yrs
- 1.0%
Air-quality risk 3/10 · Minor
- Unhealthy air days now
- 2 days/yr
- Unhealthy air days in 30 yrs
- 3 days/yr
Risk factors via First Street. Map © Google.
Why this score? — see what drove the B grade
The composite is a weighted blend of 9 inputs, each scored 0–100. Each bar is that input's sub-score; the figure is the points it added to the 100-point composite (weight × sub-score).
- Cash flow +30.0/30.0
- ARV discount +15.0/15.0
- DSCR +10.0/10.0
- 1% rule +8.8/10.0
- Livability +4.2/5.0
- Rent growth +2.5/5.0
- Condition / age +2.5/5.0
- Schools +1.9/10.0
- Appreciation +0.0/10.0
$69,900
🖨 Deal sheet 📄 Offer letter ✓ Due diligence
Listing remarks MLS
Don’t miss your opportunity to own this true charmer. Ready for you this super adorable renovated 3 bedroom traditional home is located right in the heart of shopping and dining, but on a quiet and low traffic street. Nicely appointed, this home is move-in ready and features beautiful new solid surface flooring and fresh paint throughout, a new ultra-custom kitchen, beautiful countertops, a recently updated bathroom with walk-in shower, a covered front porch, a newer furnace, and much more. You can also relax, get some fresh air or entertain on your large rear deck. Your family or four-legged friends will love the partially fenced-in backyard, and you can keep your vehicle in rear with off street parking. Call or text Kyle Tom today @ 765.220.0199 for your private tour or visit kyletom.com for additional details.
Key facts
- Covered front porch
- Off street parking
- Ultra-custom kitchen
Tags
Neighborhood map
What this means for you Summary
Snapshot
- This is a 3-bed/1.0-bath single-family listed at $70k.
Deal economics
- At list price, monthly cash flow is $312 ($4k/yr) — positive.
- The deal already cash-flows at list — no discount required.
- Meets the 1% rule at list price ($963 rent vs $70k).
- Recommended offer: $62k (12.0% below list) — sets the bar for market timing.
- Cap rate 11.7% vs local median 5.2% in Richmond — top-decile yield for the area; either an underpriced asset or a hidden risk that comps aren't pricing in. Stress-test before assuming the spread holds.
Location & tenants
- Location reads 83/100 on livability (#10 in IN, #869 nationally) — a professional / high-income tenant draw. Strengths: commute A+, cost of living A+, housing A+; Watch: crime D+, employment D-.
- Richmond Community Schools (town): math 18% / reading 27% proficiency, ranked #270 of 301 in IN (top 90%) — low school quality limits family demand, transient renter base, plan for 1-2y turnover; 65% free/reduced lunch — lower-income household profile, screen leases tightly.
- Zoned schools: Starr Elementary School (math 22% / reading 12%, grade F, #837 of 994 statewide, top 86%, 212 students, 93% FRL); Richmond High School (math 21% / reading 48%, grade F, #270 of 369 statewide, top 77%, 1,332 students, 66% FRL).
- Market conditions: 273 active listings in the ZIP; 3 comparable units currently listed for rent nearby; rentals lingering (median 44d on market — plan ~5-8 weeks vacancy on turnover, expect pricing pressure); 100% of comp listings sitting > 30 days — soft ceiling on asking rent; 38 units permitted in Wayne County in 2024 (0 in 5+ unit buildings).
Forward outlook
- Local home prices are declining (-3.0%/yr); year-one equity from $483 of loan paydown is wiped out by about $2k of value loss. Plan a longer hold.
- Wayne County population projected at -21% by 2050 — secular population decline; favor cash flow + early exit over multi-decade hold.
- At projected returns (-3.0% appreciation + 3.0% rent growth), your $20k cash investment doubles in ~7 years — after that, you're playing with house money.
Negotiation context
- It's been on market 278 days — a 12% lower offer ($62k) is reasonable based on typical stale-listing flexibility.
- 4 sale attempts since 4y ago; this cycle's ask has dropped $5k (7%) from the opening price — seller is motivated, your offer sets the floor, not the list.
Risks & watch-outs
- Watch-outs: built in 1920 — expect roof / HVAC / electrical / plumbing capex.
Questions for the listing agent
- It's been on market 278 days. Have you received any prior offers? Is the seller open to a 12% concession, seller financing, or rate buy-down credit?
- Built in 1920 — when were the roof, HVAC, electrical panel, plumbing, and water heater last replaced?
- Why hasn't it sold? Are there any deal-killer items the seller is aware of (foundation, flood, title, zoning, code violations)?
- Is there a deadline driving the sale (1031 exchange, divorce, estate, relocation)? That informs how much negotiation room exists.
- Schools are D-rated, which usually means shorter tenancies and higher turnover. Who's the typical renter profile here, and what's been the actual vacancy rate?
- Crime grade is D in this area — have there been break-ins, vandalism, or insurance claims at this property in the last 3 years? What carrier currently insures it and at what premium?
- What's the average days-on-market for RENTAL listings here right now (not sales)? A rising rental-DOM trend means longer vacancies and softer asking-rent achievability than the comps imply.
- What's the recent tenant-quality profile in this submarket — average credit score on applications, eviction rate, late-payment / NSF rate, and stable-employment percentage? A property-management company in the area should have these aggregated.
- How much new for-sale + rental construction is in the pipeline within 1–3 miles? Heavy new supply typically softens prices + rents 12–24 months out; constrained supply supports both.
Investment metrics
- 1% rule
- 1.38% ✓
- Cap rate
- 11.66%
- Cash-on-cash
- 19.16%
- DSCR
- 1.85
- GRM
- 6.0
CMA / ARV
- ARV (on-the-fly)
- $95,328
- Comps found
- 12
Show comp detail 12 sales within ~0.75 mi
| Address | Dist | Beds/Ba | Sqft | Sold | Price | $/sf | Match |
|---|---|---|---|---|---|---|---|
| 908 N 18th St | 0.34mi | 3/1.0 | 1,344 (+2%) | 9mo | $36,000 | $27 | 74 |
| 231 N 18th St | 0.18mi | 3/1.0 | 1,452 (+10%) | 4mo | $104,900 | $72 | 72 |
| 109 N 21st St | 0.29mi | 3/1.5 | 1,456 (+10%) | 1mo | $105,000 | $72 | 67 |
| 106 N 16th St | 0.36mi | 3/1.0 | 1,252 (-5%) | 11mo | $60,000 | $48 | 65 |
| 627 N 13th St | 0.46mi | 2/1.0 (-1) | 1,310 (-1%) | 8mo | $35,000 | $27 | 65 |
| 42 S 16th St | 0.53mi | 2/1.0 (-1) | 1,316 (-1%) | 6mo | $11,000 | $8 | 64 |
| 1903 N A St | 0.29mi | 3/2.0 | 1,464 (+11%) | 1mo | $62,000 | $42 | 64 |
| 17 S 23rd St | 0.47mi | 3/2.5 | 1,292 (-2%) | 7mo | $149,900 | $116 | 62 |
| 2401 Hawkins Rd | 0.53mi | 3/2.0 | 1,200 (-9%) | 1mo | $144,500 | $120 | 55 |
| 117 S 15th St | 0.64mi | 2/2.0 (-1) | 1,380 (+4%) | 2mo | $79,900 | $58 | 52 |
| 2514 S B St | 0.73mi | 3/2.5 | 1,380 (+4%) | 6mo | $231,900 | $168 | 48 |
| 54 S 24th St | 0.58mi | 4/2.5 (+1) | 1,372 (+4%) | 9mo | $210,000 | $153 | 48 |
Match score weights: distance 35% · size 25% · config 20% · recency 20%. Top-matched comps best support the ARV.
Projected returns pro-forma
-3.0% appreciation · 3.0% rent growth · sell at horizon
- IRR
- 11.1%
- Equity multiple
- 1.44×
- Total profit
- $8,567
- Equity at exit
- $10,422
- IRR
- 20.1%
- Equity multiple
- 2.69×
- Total profit
- $33,058
- Equity at exit
- $6,044
Cash invested: $19,572 (down + closing). Projections, not guarantees.
Landlord ↔ Tenant lean methodology
- Overall (STATE)
- 90 Strongly Landlord-Friendly
- State Indiana
- 90 Strongly Landlord-Friendly · R+11
- County
- — inherits STATE
- City
- — inherits STATE
ZIP-level market 47374
- Active inventory
- 273
- Price-to-rent
- 6.0×
Monthly cashflow live
- Estimated rent
- $963 medium interval (Pro) →
- Mortgage (P&I)
- −$367
- Tax from tax record
- −$53 /mo · $632/yr
- Insurance
- −$29
- HOA
- −$0
- Vacancy / Maint / Mgmt
- −$202
- Net cashflow
- $312
Break-even live
UW: 25.0% down · 7.5% · 30yr · 1.5% tax · 5.0% vac · 8.0% maint · 8.0% mgmt
Financing live
Cash to close
- Down payment
- $17,475
- Closing costs
- $2,097
- Reserves months
- —
- Total cash needed
- —
Loan-product check · same deal, 3 products live
Conventional
25% down · 7.5% · 30yr
- Down + closing
- —
- Monthly P&I
- —
- Monthly cashflow
- —
- DSCR
- —
- Eligible?
- —
Personal DTI + credit; lowest rate.
DSCR
20% down · 8.5% · 30yr
- Down + closing
- —
- Monthly P&I
- —
- Monthly cashflow
- —
- DSCR
- —
- Eligible?
- —
No personal income docs; deal must DSCR.
Hard money
10% down · 12.0% · 12mo
- Down + closing
- —
- Monthly P&I
- —
- Monthly cashflow
- —
- DSCR
- —
- Eligible?
- —
Short-term bridge; refi at stabilization.
Rent comps 3 comps
| Address | Beds | Baths | Sqft | Rent | $/sqft | DOM | Units | Dist |
|---|---|---|---|---|---|---|---|---|
| 401 N 10th St Richmond, IN | 1.0–2.0 | 1.0 | 817 | $895 | $1.09 | 43d | 3 | 0.67mi |
| 114 N 34th St Richmond, IN | 2.0 | 1.5 | 980 | $1,018 | $1.04 | 43d | 1 | 1.12mi |
| 1032 S 23rd St Richmond, IN | 1.0–2.0 | 1.0 | 937 | $790 | $0.84 | 43d | 4 | 1.36mi |
Listing history 7 events
-
2026-04-23status Pending
-
2026-04-23status Active
-
2026-03-22status Active
-
2025-10-15price $69,900
-
2025-06-26$74,900 Active
-
2022-07-01soldstatus $63,000 830-char remark
Show marketing remark (830 chars)
Don’t miss your opportunity to own this true charmer. Ready for you this super adorable renovated 3 bedroom traditional home is located right in the heart of shopping and dining, but on a quiet and low traffic street. Nicely appointed, this home is move-in ready and features beautiful new solid surface flooring and fresh paint throughout, a new ultra-custom kitchen, beautiful countertops, a recently updated bathroom with walk-in shower, a covered front porch, a newer furnace, and much more. You can also relax, get some fresh air or entertain on your large rear deck. Your family or four-legged friends will love the partially fenced-in backyard, and you can keep your vehicle in rear with off street parking. Call or text Kyle Tom today @ 765.220.0199 for your private tour or visit kyletom.com for additional details.
-
2022-01-24$64,900 830-char remark
Show marketing remark (830 chars)
Don’t miss your opportunity to own this true charmer. Ready for you this super adorable renovated 3 bedroom traditional home is located right in the heart of shopping and dining, but on a quiet and low traffic street. Nicely appointed, this home is move-in ready and features beautiful new solid surface flooring and fresh paint throughout, a new ultra-custom kitchen, beautiful countertops, a recently updated bathroom with walk-in shower, a covered front porch, a newer furnace, and much more. You can also relax, get some fresh air or entertain on your large rear deck. Your family or four-legged friends will love the partially fenced-in backyard, and you can keep your vehicle in rear with off street parking. Call or text Kyle Tom today @ 765.220.0199 for your private tour or visit kyletom.com for additional details.
ⓘ Source: listings_history table (triggers on properties + properties_extension) + one-shot
backfill from property_details.listing_events for pre-trigger history.
Tax reassessment forecast IN · Partial reset (capped growth)
- Current annual tax
- $632 · $53/mo
- Projected year-2 tax
- $632 · $53/mo
- Expected delta
- $0/yr ($0/mo · 0.0%)
ⓘ Screening estimate from a state-policy table — verify with the county assessor before closing.
Climate risk First Street
- Flood 1/10 Low FEMA zone X (unshaded) · 0% chance over 30 yrs
- Wildfire 1/10 Low
- Heat 3/10 Moderate 7 d/yr ≥100°F today · 18 d/yr by 30 yrs out
- Wind 2/10 Low 100% chance of damaging wind over 30 yrs
- Air quality 3/10 Moderate 2 unhealthy d/yr today · 3 by 30 yrs out
Nearby sold comps map
Loading sold comps map…
Walkable amenities ~0.75 mi
Loading nearby amenities…
Taxation est. · year 1
- Rental income
- $11,557
- − Mortgage interest
- −$3,915
- − Property taxes
- −$632
- − Insurance
- −$350
- − Repairs & maintenance
- −$925
- − Management
- −$925
- − Depreciation
- −$2,033
- Taxable income
- $2,777
- Est. tax owed @ 24.0%
- −$667
- After-tax cash flow
- $3,083/yr
For passive investors: Depreciation is non-cash, so a rental often shows a tax loss while cash-flowing — sheltering income. Rental losses are passive: they offset passive income freely, and up to $25,000/yr can offset ordinary (W-2) income if you actively participate and your MAGI is under $100k (phasing out to $0 by $150k); unused losses carry forward. On sale, claimed depreciation is recaptured at up to 25%, and gains may owe capital-gains tax (a 1031 exchange can defer both). Figures are a year-1 estimate at your 24.0% rate — not tax advice; consult a CPA.
Schools (NCES district)
- District
- Richmond Community Schools
- NCES district ID
- 1809510
- Math proficiency
- 18% ▼ -7.00%
- Reading proficiency
- 27% ▼ -2.00%
- Median HH income
- $35,288
- Composite
- 18.55/100
- National rank
- #8913
- State rank
- #270 of 301 in IN
Livability — Richmond
- Score
- 83/100
- State rank
- #10
- US rank
- #869
Category grades
Schools grade is shown separately in the Schools card above.
Census & demographics
- Census place
- Richmond, IN
- County
- Wayne County · 44,615 people
- City population
- 44,615
- Metro
- Richmond, IN
- Population (ZIP)
- 44,615
- Household income
- $50,766
- Rent vs Own
- Severe rent burden
- 1600.0
Population outlook (Wayne County) Hauer SSP2
- Today (2025)
- 63,316 people
- By 2030
- 60,893 · -3.8%
- By 2040
- 55,386 · -12.5%
- By 2050
- 49,946 · -21.1%
- By 2075
- 37,900 · -40.1%
- By 2100
- 26,562 · -58.0%
Race, ethnicity, and origin ACS 2023
- Neighborhood character
- Predominantly White (82%)
- Race & ethnicity
- White 82% Two or more races 7% Black 6% Hispanic / Latino 4% Asian 1%
- Common ancestry
- Slovak 2% Italian 1% Lithuanian 1%
- Foreign-born
- 4% · Canada, China
- Languages at home
- 95% English-only · Spanish 3%
Political lean MEDSL · Wayne
- 2024 margin
- Solid R (+32.5) · D 32.9% · R 65.4% · Other 1.6%
- 2008→2024 swing
- -28.6pp toward R · 2008: -3.9pp · 2024: -32.5pp
- All cycles
- 2024: R+32.5 2020: R+29.1 2016: R+30.1 2012: R+14.7 2008: R+3.9
Not yet ingested
- Civics
- —
Market trends
- HPI YoY
- ▼ -118.64%
- Current HPI
- 182.5038
- Rent YoY
- —
- Metro
- Richmond, IN
- State GDP YoY
- ▲ 2.90%
- F500 in state
- 18
Industry mix (Fortune 500 HQ in IN)
| Industry | F500 HQs | Revenue |
|---|---|---|
| Industrial Machinery | 2 | $37B |
|
||
| Healthcare | 1 | $177B |
|
||
| Pharmaceuticals | 1 | $45B |
|
||
| Metals / Steel | 1 | $18B |
|
||
| Agriculture | 1 | $17B |
|
||
| Packaging | 1 | $12B |
|
||
Price history
+7.7% since first listed7 events — show timeline
- 2026-04-23 Pending — RRELMS
- 2026-04-23 Relisted — RRELMS
- 2026-03-22 Relisted — RRELMS
- 2025-10-15 Price Changed $69,900 RRELMS
- 2025-06-26 Listed $74,900 RRELMS
- 2022-07-01 Sold (MLS) $63,000 RRELMS
- 2022-01-24 Listed $64,900 RRELMS
Property tax history
+22.5%/yrLatest (2024): $632 · +14.5% YoY. Source: county tax records.
Cash-flow waterfall
monthlySold comps — $/sqft
last 12 mo · ≤1 miLoading sold comps…