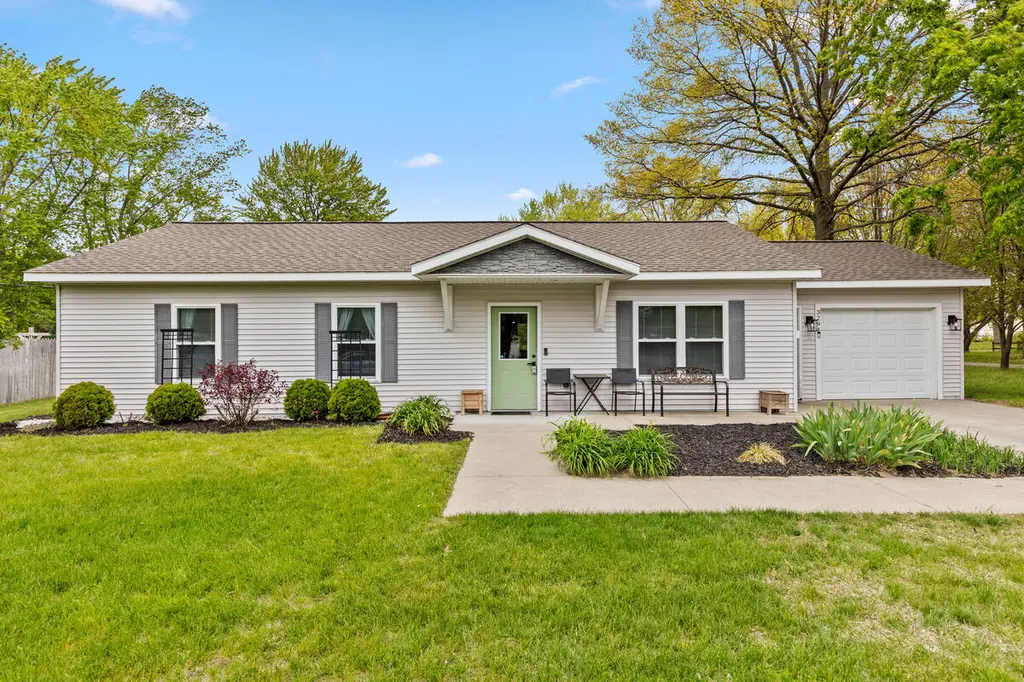
3294 Butternut Dr · Beechwood, MI
Flood risk 1/10 · Minimal
- FEMA flood zone
- X (unshaded)
- Chance of flooding over 30 yrs
- 0.0%
- Est. flood insurance / yr
- $507 – $1,088
Fire risk 1/10 · Minimal
- Est. fire insurance / yr
- $784 – $1,456
Heat risk 2/10 · Minimal
- Hot days now (above 97°F)
- 7 days/yr
- Hot days in 30 yrs
- 15 days/yr
Wind risk 2/10 · Minimal
- Chance of severe wind over 30 yrs
- —
Air-quality risk 4/10 · Minor
- Unhealthy air days now
- 4 days/yr
- Unhealthy air days in 30 yrs
- 6 days/yr
Risk factors via First Street. Map © Google.
Why this score? — see what drove the D grade
The composite is a weighted blend of 9 inputs, each scored 0–100. Each bar is that input's sub-score; the figure is the points it added to the 100-point composite (weight × sub-score).
- Cash flow +10.1/30.0
- ARV discount +10.1/15.0
- Livability +4.3/5.0
- Schools +3.9/10.0
- Rent growth +3.8/5.0
- DSCR +2.9/10.0
- 1% rule +2.6/10.0
- Condition / age +2.5/5.0
- Appreciation +0.0/10.0
$265,000
🖨 Deal sheet (PDF) 📄 Offer letter ✓ Due diligence
Listing remarks MLS
Welcome to 3294 Butternut in Holland. This great ranch home lights up every square foot. The open floor plan make sure that you can enjoy the living room or prepare a meal in the kitchen without missing any of the action. The three bedroom each feature nice closets for storage and convenience. In the warmer months, enjoy the nearly half acre lot. During the cooler months, the attached garage will keep all of your tools and toys safe from the elements. Holland is one of Michigan's premire lakeshore towns and boasts a downtown full of brewerys, restaurants and shops. You will be wowed by the world class state and local parks on Lake Michigan and Lake Macatawa. Join us for the open house Saturday, May 16, 2026 11:30 AM to 1:00 PM and learn how to make this great home yours!
Key facts
- Attached garage
- Nearly half acre lot
- 0.48 acre lot
Tags
Property features AI
Exterior
- Parking: Attached 2-car garage
- Utilities: Public water
- Home design: Ranch style; Single-family residence; Residential property
- Construction: Built in 2016; Vinyl siding
- Exterior features: Recreational lot; Paved road access
Interior
- Kitchen: Dishwasher; Disposal; Microwave; Range; Refrigerator
- Bathrooms: 1 full bathroom; 1 half bathroom
- Heating & cooling: Forced air heating; Central cooling
- Interior features: Garage door opener; Eat-in kitchen; Accessible entrance; Total of 6 rooms
- Laundry & utility: Washer; Dryer; Dedicated laundry room
Neighborhood map
What this means for you Summary
Snapshot
- This is a 3-bed/1.5-bath single-family listed at $265k.
Deal economics
- At list price, monthly cash flow is $-157 ($-2k/yr) — negative.
- To cash-flow at today's rent, offer at most $237k (10.4% below list).
- To meet the 1% rule (rent ≥ 1% of price), the offer needs to be $200k (24.5% below list).
- Recommended offer: $200k (24.5% below list) — sets the bar for 1% rule.
- Cap rate 5.6% vs local median 3.6% in Beechwood — top-decile yield for the area; either an underpriced asset or a hidden risk that comps aren't pricing in. Stress-test before assuming the spread holds.
Location & tenants
- Location reads 86/100 on livability (#21 in MI, #378 nationally) — a professional / high-income tenant draw. Strengths: crime A+, cost of living A+, housing A+; Watch: employment D.
- West Ottawa Public School District (suburban): math 37% / reading 52% proficiency, ranked #140 of 540 in MI (top 26%) — families likely to look elsewhere, expect single-tenant / working-renter base with shorter leases.
- Zoned schools: Great Lakes Elementary School (math 29% / reading 39%, grade F, #798 of 1,397 statewide, top 57%, 409 students, 74% FRL); Harbor Lights Middle School (math 38% / reading 53%, grade D+, #161 of 493 statewide, top 33%, 817 students, 52% FRL); West Ottawa High School Campus (math 39% / reading 62%, grade D+, #146 of 713 statewide, top 21%, 2,196 students, 51% FRL).
- Market conditions: Rents rising fast (+5.1%/yr); 346 active listings in the ZIP; 2 comparable units currently listed for rent nearby; solid renter incomes; 1,237 units permitted in Ottawa County in 2024 (443 in 5+ unit buildings).
Forward outlook
- Local home prices are declining (-3.0%/yr); year-one equity from $2k of loan paydown is wiped out by about $8k of value loss. Plan a longer hold.
- Ottawa County population projected at +24% by 2050 — long-run rental-demand tailwind backs the buy-and-hold thesis.
Negotiation context
- Only 5 days on market — expect competitive offers; lowballing is unlikely to land.
- 3 sale attempts with the ask held roughly flat each time — persistent listings suggest the price (not the market) is what's stuck; bring a comps-based counter.
- Current owner paid $24k; list at $265k implies a 1004% gain — meaningful room to come down on a strong offer.
Questions for the listing agent
- What do current leases actually rent for vs. the listed asking? Can we see a recent rent roll and the last 12 months of T-12 income?
- Is there a deadline driving the sale (1031 exchange, divorce, estate, relocation)? That informs how much negotiation room exists.
- Schools are F-rated, which usually means shorter tenancies and higher turnover. Who's the typical renter profile here, and what's been the actual vacancy rate?
- The area grade is low — what's the realistic commute time and amenity access for the typical tenant pool here? Any planned neighborhood developments (good or bad) we should know about?
- What's the average days-on-market for RENTAL listings here right now (not sales)? A rising rental-DOM trend means longer vacancies and softer asking-rent achievability than the comps imply.
- What's the recent tenant-quality profile in this submarket — average credit score on applications, eviction rate, late-payment / NSF rate, and stable-employment percentage? A property-management company in the area should have these aggregated.
- How much new for-sale + rental construction is in the pipeline within 1–3 miles? Heavy new supply typically softens prices + rents 12–24 months out; constrained supply supports both.
Investment metrics
- 1% rule
- 0.76% ✗
- Cap rate
- 5.58%
- Cash-on-cash
- -2.53%
- DSCR
- 0.89
- GRM
- 11.0
CMA / ARV
- ARV (median comp)
- $281,034
- List price
- $265,000
- Delta
- -5.71%
- Verdict
- FAIR
- Comps
- 20 within 1.0 mi
Show comp detail 5 sales within ~0.75 mi
| Address | Dist | Beds/Ba | Sqft | Sold | Price | $/sf | Match |
|---|---|---|---|---|---|---|---|
| 3590 142nd Ave | 0.49mi | 3/1.5 | 1,128 (-6%) | 1mo | $350,000 | $310 | 67 |
| 971 Shadybrook Dr | 0.37mi | 3/1.5 | 1,107 (-7%) | 9mo | $344,900 | $312 | 63 |
| 694 Riley St | 0.16mi | 2/1.0 (-1) | 1,036 (-13%) | 5mo | $229,000 | $221 | 59 |
| 14163 Ridgewood Dr | 0.56mi | 4/1.5 (+1) | 1,092 (-9%) | 9mo | $284,000 | $260 | 47 |
| 434 Riley St | 0.61mi | 3/1.5 | 1,368 (+14%) | 6mo | $330,000 | $241 | 42 |
Match score weights: distance 35% · size 25% · config 20% · recency 20%. Top-matched comps best support the ARV.
Projected returns pro-forma
-3.0% appreciation · 5.08% rent growth · sell at horizon
- IRR
- -18.4%
- Equity multiple
- 0.34×
- Total profit
- $-48,666
- Equity at exit
- $39,512
- IRR
- -7.2%
- Equity multiple
- 0.50×
- Total profit
- $-37,023
- Equity at exit
- $22,912
Cash invested: $74,200 (down + closing). Projections, not guarantees.
Landlord ↔ Tenant lean methodology
- Overall (STATE)
- 62 Landlord-Friendly
- State Michigan
- 62 Landlord-Friendly · EVEN
- County
- — inherits STATE
- City
- — inherits STATE
ZIP-level market 49424
- Rents YoY
- 5.1%
- Active inventory
- 346
- Price-to-rent
- 11.0×
Monthly cashflow live
- Estimated rent
- $2,001 medium interval (Pro) →
- Mortgage (P&I)
- −$1,390
- Tax from tax record
- −$238 /mo · $2,851/yr
- Insurance
- −$110
- HOA
- −$0
- Vacancy / Maint / Mgmt
- −$420
- Net cashflow
- $-157
Break-even live
Sensitivity live
| Price | -10% $-7 | -5% $-82 | +0% $-157 | +5% $-232 | +10% $-307 |
|---|---|---|---|---|---|
| Rent | -10% $-315 | -5% $-236 | +0% $-157 | +5% $-78 | +10% $2 |
| Rate | -1.0pp $-23 | -0.5pp $-89 | base $-157 | +0.5pp $-225 | +1.0pp $-295 |
UW: 25.0% down · 7.5% · 30yr · 1.5% tax · 5.0% vac · 8.0% maint · 8.0% mgmt
Financing live
Cash to close
- Down payment
- $66,250
- Closing costs
- $7,950
- Reserves months
- —
- Total cash needed
- —
Loan-product check · same deal, 3 products live
Conventional
25% down · 7.5% · 30yr
- Down + closing
- —
- Monthly P&I
- —
- Monthly cashflow
- —
- DSCR
- —
- Eligible?
- —
Personal DTI + credit; lowest rate.
DSCR
20% down · 8.5% · 30yr
- Down + closing
- —
- Monthly P&I
- —
- Monthly cashflow
- —
- DSCR
- —
- Eligible?
- —
No personal income docs; deal must DSCR.
Hard money
10% down · 12.0% · 12mo
- Down + closing
- —
- Monthly P&I
- —
- Monthly cashflow
- —
- DSCR
- —
- Eligible?
- —
Short-term bridge; refi at stabilization.
Rent comps 2 comps
| Address | Beds | Baths | Sqft | Rent | $/sqft | DOM | Units | Dist |
|---|---|---|---|---|---|---|---|---|
| 477 W Mae Rose Ave Holland, MI | 2.0 | 1.5 | 1200 | $1,500 | $1.25 | 4d | 1 | 0.62mi |
| 13620 Carmella Ln Holland, MI | 2.0–3.0 | 1.5–2.0 | 1085 | $1,841 | $1.70 | 4d | 7 | 1.11mi |
Listing history 4 events
-
2026-05-14$265,000 Active 783-char remark
Show marketing remark (781 chars)
Welcome to 3294 Butternut in Holland. This great ranch home lights up every square foot. The open floor plan make sure that you can enjoy the living room or prepare a meal in the kitchen without missing any of the action. The three bedroom each feature nice closets for storage and convenience. In the warmer months, enjoy the nearly half acre lot. During the cooler months, the attached garage will keep all of your tools and toys safe from the elements. Holland is one of Michigan's premire lakeshore towns and boasts a downtown full of brewerys, restaurants and shops. You will be wowed by the world class state and local parks on Lake Michigan and Lake Macatawa. Join us for the open house Saturday, May 16, 2026 11:30 AM to 1:00 PM and learn how to make this great home yours!
-
2026-05-14$265,000 Active 781-char remark
Show marketing remark (781 chars)
Welcome to 3294 Butternut in Holland. This great ranch home lights up every square foot. The open floor plan make sure that you can enjoy the living room or prepare a meal in the kitchen without missing any of the action. The three bedroom each feature nice closets for storage and convenience. In the warmer months, enjoy the nearly half acre lot. During the cooler months, the attached garage will keep all of your tools and toys safe from the elements. Holland is one of Michigan's premire lakeshore towns and boasts a downtown full of brewerys, restaurants and shops. You will be wowed by the world class state and local parks on Lake Michigan and Lake Macatawa. Join us for the open house Saturday, May 16, 2026 11:30 AM to 1:00 PM and learn how to make this great home yours!
-
2026-05-14$265,000 Active
Show marketing remark (781 chars)
Welcome to 3294 Butternut in Holland. This great ranch home lights up every square foot. The open floor plan make sure that you can enjoy the living room or prepare a meal in the kitchen without missing any of the action. The three bedroom each feature nice closets for storage and convenience. In the warmer months, enjoy the nearly half acre lot. During the cooler months, the attached garage will keep all of your tools and toys safe from the elements. Holland is one of Michigan's premire lakeshore towns and boasts a downtown full of brewerys, restaurants and shops. You will be wowed by the world class state and local parks on Lake Michigan and Lake Macatawa. Join us for the open house Saturday, May 16, 2026 11:30 AM to 1:00 PM and learn how to make this great home yours!
-
2009-10-07soldstatus $24,000
ⓘ Source: listings_history table (triggers on properties + properties_extension) + one-shot
backfill from property_details.listing_events for pre-trigger history.
Tax reassessment forecast MI · Partial reset (capped growth)
- Current annual tax
- $2,851 · $238/mo
- Projected year-2 tax
- $3,466 · $289/mo
- Expected delta
- +$615/yr (+$51/mo · 21.6%)
ⓘ Screening estimate from a state-policy table — verify with the county assessor before closing.
Climate risk First Street
- Flood 1/10 Low FEMA zone X (unshaded) · 0% chance over 30 yrs
- Wildfire 1/10 Low
- Heat 2/10 Low 7 d/yr ≥97°F today · 15 d/yr by 30 yrs out
- Wind 2/10 Low
- Air quality 4/10 Moderate 4 unhealthy d/yr today · 6 by 30 yrs out
Nearby sold comps map
Loading sold comps map…
Walkable amenities ~0.75 mi
Loading nearby amenities…
Taxation est. · year 1
- Rental income
- $24,017
- − Mortgage interest
- −$14,844
- − Property taxes
- −$2,851
- − Insurance
- −$1,325
- − Repairs & maintenance
- −$1,921
- − Management
- −$1,921
- − Depreciation
- −$7,709
- Taxable loss
- −$6,555
- Est. tax savings @ 24.0%
- +$1,573
- After-tax cash flow
- $-306/yr
For passive investors: Depreciation is non-cash, so a rental often shows a tax loss while cash-flowing — sheltering income. Rental losses are passive: they offset passive income freely, and up to $25,000/yr can offset ordinary (W-2) income if you actively participate and your MAGI is under $100k (phasing out to $0 by $150k); unused losses carry forward. On sale, claimed depreciation is recaptured at up to 25%, and gains may owe capital-gains tax (a 1031 exchange can defer both). Figures are a year-1 estimate at your 24.0% rate — not tax advice; consult a CPA.
Schools (NCES district)
- District
- West Ottawa Public School District
- NCES district ID
- 2635910
- Math proficiency
- 37% ▼ -4.00%
- Reading proficiency
- 52% ▼ -4.00%
- Median HH income
- $58,127
- Composite
- 38.94/100
- National rank
- #4087
- State rank
- #140 of 540 in MI
Livability — Beechwood
- Score
- 86/100
- State rank
- #21
- US rank
- #378
Category grades
Schools grade is shown separately in the Schools card above.
Census & demographics
- County
- Ottawa County · 144,142 people
- Metro
- Grand Rapids-Kentwood, MI
- Population (ZIP)
- 49,810
- Household income
- $85,478
- Rent vs Own
- Severe rent burden
- 864.0
Population outlook (Ottawa County) Hauer SSP2
- Today (2025)
- 313,561 people
- By 2030
- 330,027 · +5.3%
- By 2040
- 361,118 · +15.2%
- By 2050
- 388,414 · +23.9%
- By 2075
- 452,175 · +44.2%
- By 2100
- 473,041 · +50.9%
Race, ethnicity, and origin ACS 2023
- Neighborhood character
- Predominantly White (65%)
- Race & ethnicity
- White 65% Hispanic / Latino 25% Two or more races 10% Asian 6% Black 1%
- Hispanic origin (detail)
- Mexican 19% Puerto Rican 1%
- Common ancestry
- Iranian 22% Romanian 3% Lithuanian 2%
- Foreign-born
- 11% · Canada, Vietnam, South Korea
- Languages at home
- 80% English-only · Spanish 15% Other Asian/Pacific 3% Vietnamese 1%
Political lean MEDSL · Ottawa
- 2024 margin
- Strong R (+20.4) · D 39.0% · R 59.5% · Other 1.5%
- 2008→2024 swing
- +3.4pp toward D · 2008: -23.9pp · 2024: -20.4pp
- All cycles
- 2024: R+20.4 2020: R+21.5 2016: R+30.4 2012: R+34.2 2008: R+23.9
Not yet ingested
- Civics
- —
Market trends
- HPI YoY
- ▼ -240.90%
- Current HPI
- 252.5142
- Rent YoY
- ▲ 5.08%
- Metro
- Grand Rapids-Kentwood, MI
- State GDP YoY
- ▲ 1.37%
- F500 in state
- 28
Industry mix (Fortune 500 HQ in MI)
| Industry | F500 HQs | Revenue |
|---|---|---|
| Automotive Parts | 3 | $48B |
|
||
| Automotive | 2 | $372B |
|
||
| Chemicals | 1 | $45B |
|
||
| Automotive Retail | 1 | $29B |
|
||
| Healthcare / Medical Devices | 1 | $23B |
|
||
| Automotive Technology | 1 | $20B |
|
||
Price history
+1004.2% since first listed7 events — show timeline
- 2026-05-20 Pending — REALCOMP
- 2026-05-19 Pending — MiRealSource-MiMLS
- 2026-05-19 Pending — SW Michigan MLS
- 2026-05-14 Listed $265,000 SW Michigan MLS
- 2026-05-14 Listed $265,000 MiRealSource-MiMLS
- 2026-05-14 Listed $265,000 REALCOMP
- 2009-10-07 Sold (Public Records) $24,000 Public Records
Property tax history
+3.2%/yrLatest (2025): $2,851 · +3.2% YoY. Source: county tax records.
Cash-flow waterfall
monthlySold comps — $/sqft
last 12 mo · ≤1 miLoading sold comps…