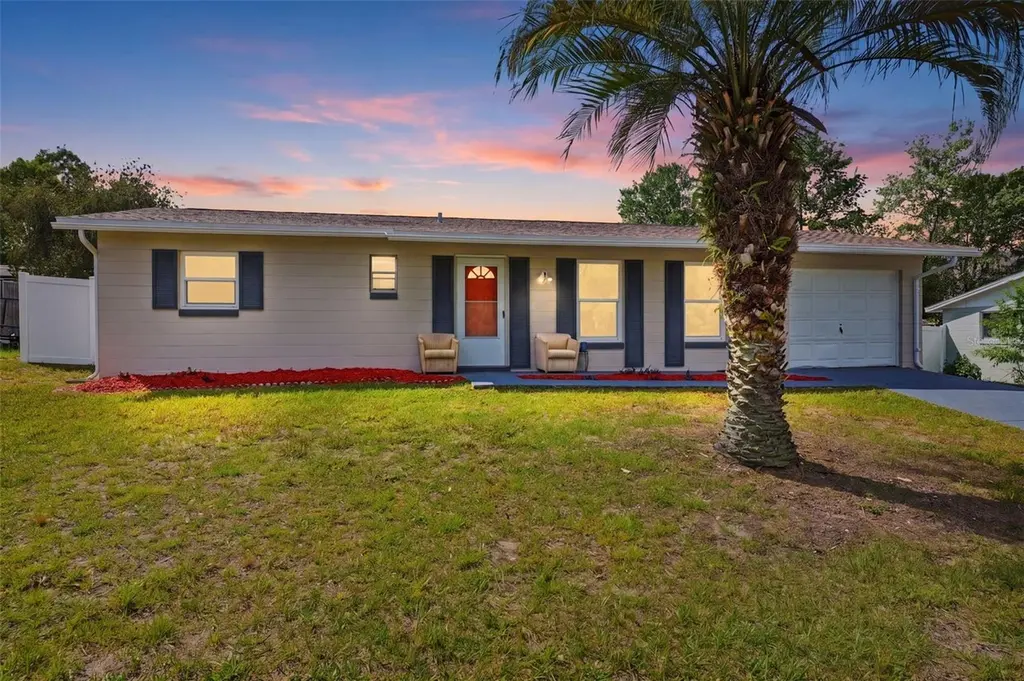
2164 W Devon Dr · Citrus Springs, FL
Flood risk 1/10 · Minimal
- FEMA flood zone
- X (unshaded)
- Chance of flooding over 30 yrs
- 0.0%
- Est. flood insurance / yr
- $507 – $1,088
Fire risk 2/10 · Minimal
- Est. fire insurance / yr
- $947 – $1,759
Heat risk 9/10 · Severe
- Hot days now (above 107°F)
- 7 days/yr
- Hot days in 30 yrs
- 25 days/yr
Wind risk 9/10 · Severe
- Chance of severe wind over 30 yrs
- 99.0%
Air-quality risk 2/10 · Minimal
- Unhealthy air days now
- 0 days/yr
- Unhealthy air days in 30 yrs
- 1 days/yr
Risk factors via First Street. Map © Google.
Why this score? — see what drove the F grade
The composite is a weighted blend of 9 inputs, each scored 0–100. Each bar is that input's sub-score; the figure is the points it added to the 100-point composite (weight × sub-score).
- Cash flow +13.7/30.0
- DSCR +4.1/10.0
- Schools +4.1/10.0
- Livability +3.4/5.0
- 1% rule +2.6/10.0
- Rent growth +2.5/5.0
- Condition / age +2.5/5.0
- Appreciation +0.1/10.0
- ARV discount +0.0/15.0
$189,000
🖨 Deal sheet 📄 Offer letter ✓ Due diligence
Listing remarks MLS
The perfect opportunity for the full-time or part-time resident. Neat and clean two bedroom, 1.5 bath with garage, lanai and indoor utility room. Includes washer and dryer and newer roof. Located close to the firehouse and ball park. Garage door opener "AS IS", furniture negotiable.
Key facts
- Not in a flood zone
- Utility room
- Screened lanai
Tags
Property features AI
Finance
- Other: Property zoned PDR; Lot approximately 0.18 acres (75 x 100), paved road access
- HOA & community: No HOA association indicated; Pets allowed: cats and dogs
Exterior
- Parking: Attached garage (1 car)
- Utilities: Public water; Public sewer; Cable available; Electricity connected; Water connected; Sewer connected
- Home design: Single family residence; Residential property; One story; Faces north; Homestead exempt
- Construction: Block and stucco construction; Shingle roof; Slab foundation; Built with living area of 880 square feet (per public records)
- Exterior features: Covered screened patio/porch; Exterior lighting; Private mailbox; Sidewalk
Interior
- Kitchen: Dishwasher; Microwave; Range; Refrigerator
- Bedrooms: 2 bedrooms
- Flooring: Tile
- Bathrooms: 1 full bath; 1 half bath
- Heating & cooling: Central heating (electric); Central air conditioning
- Interior features: Ceiling fans; Living room/dining room combo; Thermostat
- Laundry & utility: Inside laundry room
Neighborhood map
What this means for you Summary
Snapshot
- This is a 2-bed/1.5-bath single-family listed at $189k.
Deal economics
- At list price, monthly cash flow is $13 ($155/yr) — positive.
- The deal already cash-flows at list — no discount required.
- To meet the 1% rule (rent ≥ 1% of price), the offer needs to be $144k (23.9% below list).
- Recommended offer: $144k (23.9% below list) — sets the bar for 1% rule.
- Cap rate 6.4% vs local median 5.1% in Citrus Springs — meaningfully above typical; check what's discounted (condition, days-on-market, listing class) to confirm the premium yield is real.
Location & tenants
- Location reads 68/100 on livability (#521 in FL) — a middle-class / working-renter tenant base. Strengths: cost of living A+, housing A+; Watch: health & safety C-, employment D+, amenities F.
- Citrus (rural): math 49% / reading 50% proficiency, ranked #44 of 73 in FL (top 60%) — families likely to look elsewhere, expect single-tenant / working-renter base with shorter leases.
- Zoned schools: Central Ridge Elementary School (math 41% / reading 44%, grade F, #1,383 of 2,144 statewide, top 65%, 723 students, 64% FRL); Crystal River High School (math 31% / reading 44%, grade F, #336 of 667 statewide, top 51%, 1,249 students, 56% FRL) — zoned schools at 60% FRL track the district average.
- Market conditions: 1242 active listings in the ZIP; 6 comparable units currently listed for rent nearby; rentals at typical pace (median 21d on market — plan ~3-4 weeks tenant-placement turnaround); 2,443 units permitted in Citrus County in 2024 (0 in 5+ unit buildings).
Forward outlook
- Local home prices are declining (-3.0%/yr); year-one equity from $1k of loan paydown is wiped out by about $6k of value loss. Plan a longer hold.
- Citrus County population projected to shrink 10% by 2050 — rents likely to lag national; underwrite the cash flow, not the appreciation.
Negotiation context
- It's been on market 53 days — a 3% lower offer ($183k) is reasonable based on typical stale-listing flexibility.
- 2 sale attempts since 24y ago with the ask held roughly flat each time — persistent listings suggest the price (not the market) is what's stuck; bring a comps-based counter.
- Current owner paid $144k; 32% above their basis — modest negotiation headroom, anchor on the comps not their cost.
Risks & watch-outs
- Climate carrying-cost: severe wind risk, 99% chance of damaging wind over 30y; extreme-heat days projected 7→25/yr by 2055 (HVAC capex compounding) — expect insurance premiums to compound above CPI over the hold.
Questions for the listing agent
- It's been on market 53 days. Have you received any prior offers? Is the seller open to a 24% concession, seller financing, or rate buy-down credit?
- Built in 1979 — when were the roof, HVAC, electrical panel, plumbing, and water heater last replaced?
- Is there a deadline driving the sale (1031 exchange, divorce, estate, relocation)? That informs how much negotiation room exists.
- The area grade is low — what's the realistic commute time and amenity access for the typical tenant pool here? Any planned neighborhood developments (good or bad) we should know about?
- What's the average days-on-market for RENTAL listings here right now (not sales)? A rising rental-DOM trend means longer vacancies and softer asking-rent achievability than the comps imply.
- What's the recent tenant-quality profile in this submarket — average credit score on applications, eviction rate, late-payment / NSF rate, and stable-employment percentage? A property-management company in the area should have these aggregated.
- How much new for-sale + rental construction is in the pipeline within 1–3 miles? Heavy new supply typically softens prices + rents 12–24 months out; constrained supply supports both.
Investment metrics
- 1% rule
- 0.76% ✗
- Cap rate
- 6.38%
- Cash-on-cash
- 0.29%
- DSCR
- 1.01
- GRM
- 10.9
CMA / ARV
- ARV (on-the-fly)
- $154,880
- Comps found
- 12
Show comp detail 12 sales within ~0.75 mi
| Address | Dist | Beds/Ba | Sqft | Sold | Price | $/sf | Match |
|---|---|---|---|---|---|---|---|
| 2155 W Devon | 0.03mi | 2/1.0 | 864 (-2%) | 3mo | $165,000 | $191 | 91 |
| 2170 W Austin Dr | 0.06mi | 2/1.5 | 787 (-11%) | 7mo | $178,000 | $226 | 74 |
| 1817 W Gardenia Dr | 0.35mi | 3/1.5 (+1) | 880 (0%) | 8mo | $145,000 | $165 | 72 |
| 1872 W Freeman Pl | 0.32mi | 2/1.0 | 902 (+2%) | 9mo | $147,500 | $164 | 72 |
| 1882 W Gardenia Dr | 0.36mi | 2/1.0 | 894 (+2%) | 10mo | $160,000 | $179 | 70 |
| 1919 W Freeman Pl | 0.28mi | 2/1.0 | 888 (+1%) | 16mo | $155,000 | $175 | 70 |
| 2090 W Argus Pl | 0.32mi | 2/2.0 | 945 (+7%) | 6mo | $167,000 | $177 | 66 |
| 2080 W Astor Pl | 0.21mi | 2/2.0 | 945 (+7%) | 13mo | $140,000 | $148 | 65 |
| 2024 W Gardenia Dr | 0.36mi | 2/1.0 | 939 (+7%) | 13mo | $165,000 | $176 | 59 |
| 9440 N Milam Way | 0.34mi | 3/1.0 (+1) | 984 (+12%) | 1mo | $164,000 | $167 | 56 |
| 9222 N Elliot Way | 0.26mi | 2/1.0 | 990 (+12%) | 15mo | $174,999 | $177 | 52 |
| 1762 W Alhambra Dr | 0.67mi | 2/2.0 | 1,000 (+14%) | 1mo | $175,000 | $175 | 43 |
Match score weights: distance 35% · size 25% · config 20% · recency 20%. Top-matched comps best support the ARV.
Projected returns pro-forma
-3.0% appreciation · 3.0% rent growth · sell at horizon
- IRR
- -15.9%
- Equity multiple
- 0.44×
- Total profit
- $-29,892
- Equity at exit
- $28,181
- IRR
- -7.6%
- Equity multiple
- 0.52×
- Total profit
- $-25,336
- Equity at exit
- $16,341
Cash invested: $52,920 (down + closing). Projections, not guarantees.
Landlord ↔ Tenant lean methodology
- Overall (STATE)
- 87 Strongly Landlord-Friendly
- State Florida
- 87 Strongly Landlord-Friendly · R+3
- County
- — inherits STATE
- City
- — inherits STATE
ZIP-level market 34434
- Home prices YoY
- -2.9%
- Active inventory
- 1242
- Price-to-rent
- 10.9×
Monthly cashflow live
- Estimated rent
- $1,439 high interval (Pro) →
- Mortgage (P&I)
- −$991
- Tax from tax record
- −$54 /mo · $644/yr
- Insurance
- −$79
- HOA
- −$0
- Vacancy / Maint / Mgmt
- −$302
- Net cashflow
- $13
Break-even live
UW: 25.0% down · 7.5% · 30yr · 1.5% tax · 5.0% vac · 8.0% maint · 8.0% mgmt
Financing live
Cash to close
- Down payment
- $47,250
- Closing costs
- $5,670
- Reserves months
- —
- Total cash needed
- —
Loan-product check · same deal, 3 products live
Conventional
25% down · 7.5% · 30yr
- Down + closing
- —
- Monthly P&I
- —
- Monthly cashflow
- —
- DSCR
- —
- Eligible?
- —
Personal DTI + credit; lowest rate.
DSCR
20% down · 8.5% · 30yr
- Down + closing
- —
- Monthly P&I
- —
- Monthly cashflow
- —
- DSCR
- —
- Eligible?
- —
No personal income docs; deal must DSCR.
Hard money
10% down · 12.0% · 12mo
- Down + closing
- —
- Monthly P&I
- —
- Monthly cashflow
- —
- DSCR
- —
- Eligible?
- —
Short-term bridge; refi at stabilization.
Rent comps 6 comps
| Address | Beds | Baths | Sqft | Rent | $/sqft | DOM | Units | Dist |
|---|---|---|---|---|---|---|---|---|
| 9545 N Travis Dr Unit A Citrus Springs, FL | 3.0 | 2.0 | 1000 | $1,350 | $1.35 | 20d | 1 | 0.67mi |
| 9543B N Travis Dr Unit A Citrus Springs, FL | 3.0 | 2.0 | 1000 | $1,350 | $1.35 | 20d | 1 | 0.70mi |
| 9271 N Peachtree Way Unit 9271 Citrus Springs, FL | 2.0 | 2.0 | 900 | $1,300 | $1.44 | 20d | 1 | 0.93mi |
| 9337 N Mendoza Way Citrus Springs, FL | 2.0 | 2.0 | 984 | $1,275 | $1.30 | 20d | 1 | 0.95mi |
| 9437 N Travis Dr Citrus Springs, FL | 2.0 | 2.0 | 972 | $1,325 | $1.36 | 20d | 1 | 0.96mi |
| 9262 N Travis Dr Citrus Springs, FL | 2.0 | 2.0 | 984 | $1,395 | $1.42 | 20d | 1 | 1.05mi |
Listing history 22 events
-
2026-06-19days on market $189,000 Active 53 DOM
-
2026-06-18days on market $189,000 Active 52 DOM
-
2026-06-17days on market $189,000 Active 51 DOM
-
2026-06-16days on market $189,000 Active 50 DOM
-
2026-06-15days on market $189,000 Active 49 DOM
-
2026-06-14days on market $189,000 Active 47 DOM
-
2026-06-13days on market $189,000 Active 46 DOM
-
2026-06-09days on market $189,000 Active 43 DOM
-
2026-06-08days on market $189,000 Active 42 DOM
-
2026-06-07days on market $189,000 Active 41 DOM
-
2026-06-03days on market $189,000 Active 37 DOM
-
2026-06-02days on market $189,000 Active 36 DOM
-
2026-06-01days on market $189,000 Active 35 DOM
-
2026-05-31days on market $189,000 Active 34 DOM
-
2026-05-30days on market $189,000 Active 33 DOM
-
2026-04-27$189,000 Active
-
2022-03-14soldstatus $143,500
-
2003-05-27soldstatus $39,000 293-char remark
Show marketing remark (293 chars)
The perfect opportunity for the full-time or part-time resident. Neat and clean two bedroom, 1.5 bath with garage, lanai and indoor utility room. Includes washer and dryer and newer roof. Located close to the firehouse and ball park. Garage door opener "AS IS", furniture negotiable.
-
2002-11-14$45,900 293-char remark
Show marketing remark (293 chars)
The perfect opportunity for the full-time or part-time resident. Neat and clean two bedroom, 1.5 bath with garage, lanai and indoor utility room. Includes washer and dryer and newer roof. Located close to the firehouse and ball park. Garage door opener "AS IS", furniture negotiable.
-
1982-12-01soldstatus $28,000
-
1982-12-01soldstatus $32,700
-
1979-04-01soldstatus $31,000
ⓘ Source: listings_history table (triggers on properties + properties_extension) + one-shot
backfill from property_details.listing_events for pre-trigger history.
Tax reassessment forecast FL · Resets to sale price
- Current annual tax
- $644 · $54/mo
- Projected year-2 tax
- $1,569 · $131/mo
- Expected delta
- +$925/yr (+$77/mo · 143.7%)
ⓘ Screening estimate from a state-policy table — verify with the county assessor before closing.
Climate risk First Street
- Flood 1/10 Low FEMA zone X (unshaded) · 0% chance over 30 yrs
- Wildfire 2/10 Low
- Heat 9/10 Extreme 7 d/yr ≥107°F today · 25 d/yr by 30 yrs out
- Wind 9/10 Extreme 99% chance of damaging wind over 30 yrs
- Air quality 2/10 Low 0 unhealthy d/yr today · 1 by 30 yrs out
Nearby sold comps map
Loading sold comps map…
Walkable amenities ~0.75 mi
Loading nearby amenities…
Taxation est. · year 1
- Rental income
- $17,263
- − Mortgage interest
- −$10,587
- − Property taxes
- −$644
- − Insurance
- −$945
- − Repairs & maintenance
- −$1,381
- − Management
- −$1,381
- − Depreciation
- −$5,498
- Taxable loss
- −$3,173
- Est. tax savings @ 24.0%
- +$762
- After-tax cash flow
- $917/yr
For passive investors: Depreciation is non-cash, so a rental often shows a tax loss while cash-flowing — sheltering income. Rental losses are passive: they offset passive income freely, and up to $25,000/yr can offset ordinary (W-2) income if you actively participate and your MAGI is under $100k (phasing out to $0 by $150k); unused losses carry forward. On sale, claimed depreciation is recaptured at up to 25%, and gains may owe capital-gains tax (a 1031 exchange can defer both). Figures are a year-1 estimate at your 24.0% rate — not tax advice; consult a CPA.
Schools (NCES district)
- District
- Citrus
- NCES district ID
- 1200270
- Math proficiency
- 49% ▼ -10.00%
- Reading proficiency
- 50% ▼ -6.00%
- Median HH income
- $38,618
- Composite
- 41.28/100
- National rank
- #3519
- State rank
- #44 of 73 in FL
Livability — Citrus Springs
- Score
- 68/100
- State rank
- #521
- US rank
- #9598
Category grades
Schools grade is shown separately in the Schools card above.
Census & demographics
- Census place
- Citrus Springs, FL
- County
- Citrus County · 111,314 people
- City population
- 10,730
- Metro
- Homosassa Springs, FL
- Population (ZIP)
- 11,074
- Household income
- $68,939
- Rent vs Own
- Severe rent burden
- 171.0
Population outlook (Citrus County) Hauer SSP2
- Today (2025)
- 138,622 people
- By 2030
- 136,886 · -1.3%
- By 2040
- 132,009 · -4.8%
- By 2050
- 125,196 · -9.7%
- By 2075
- 108,570 · -21.7%
- By 2100
- 84,454 · -39.1%
Race, ethnicity, and origin ACS 2023
- Neighborhood character
- Predominantly White (78%)
- Race & ethnicity
- White 78% Two or more races 11% Hispanic / Latino 9% Black 6%
- Hispanic origin (detail)
- Mexican 3% Puerto Rican 4%
- Common ancestry
- Iranian 3% Romanian 2% Slovak 2%
- Foreign-born
- 4% · Canada
- Languages at home
- 93% English-only · Spanish 5% German/W. Germanic 1% Other Indo-European 1%
Political lean MEDSL · Citrus
- 2024 margin
- Solid R (+45.9) · D 26.8% · R 72.6%
- 2008→2024 swing
- -29.8pp toward R · 2008: -16.1pp · 2024: -45.9pp
- All cycles
- 2024: R+45.9 2020: R+41.0 2016: R+39.7 2012: R+21.9 2008: R+16.1
Not yet ingested
- Civics
- —
Market trends
- HPI YoY
- ▼ -9.70%
- Current HPI
- 328.2164
- Rent YoY
- —
- Metro
- Homosassa Springs, FL
- State GDP YoY
- ▲ 3.28%
- F500 in state
- 36
Industry mix (Fortune 500 HQ in FL)
| Industry | F500 HQs | Revenue |
|---|---|---|
| Industrial Technology | 2 | $29B |
|
||
| Insurance | 2 | $17B |
|
||
| Retail | 1 | $60B |
|
||
| Technology Distribution | 1 | $58B |
|
||
| Homebuilding | 1 | $35B |
|
||
| Technology Manufacturing | 1 | $35B |
|
||
Price history
+509.7% since first listed7 events — show timeline
- 2026-04-27 Listed $189,000 Stellar MLS as Distributed by MLS Grid
- 2022-03-14 Sold (Public Records) $143,500 Public Records
- 2003-05-27 Sold (MLS) $39,000 RACC
- 2002-11-14 Listed $45,900 RACC
- 1982-12-01 Sold (Public Records) $32,700 Public Records
- 1982-12-01 Sold (Public Records) $28,000 Public Records
- 1979-04-01 Sold (Public Records) $31,000 Public Records
Property tax history
+0.6%/yrLatest (2025): $644 · +12.6% YoY. Source: county tax records.
Cash-flow waterfall
monthlySold comps — $/sqft
last 12 mo · ≤1 miLoading sold comps…