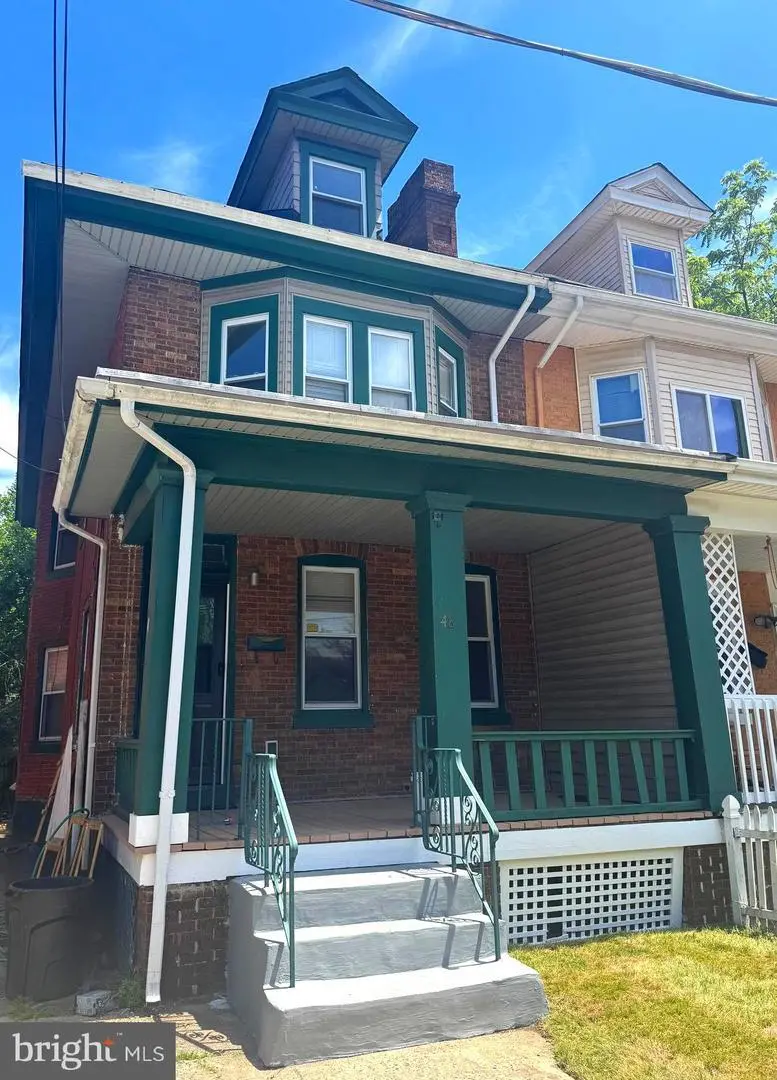
48 Atterbury Ave · Trenton, NJ
Flood risk 8/10 · Major
- FEMA flood zone
- X (shaded)
- Chance of flooding over 30 yrs
- 0.99%
- Est. flood insurance / yr
- $507 – $1,088
Fire risk 2/10 · Minimal
- Est. fire insurance / yr
- $526 – $976
Heat risk 6/10 · Moderate
- Hot days now (above 103°F)
- 7 days/yr
- Hot days in 30 yrs
- 15 days/yr
Wind risk 6/10 · Moderate
- Chance of severe wind over 30 yrs
- 27.0%
Air-quality risk 5/10 · Moderate
- Unhealthy air days now
- 6 days/yr
- Unhealthy air days in 30 yrs
- 8 days/yr
Risk factors via First Street. Map © Google.
Why this score? — see what drove the C grade
The composite is a weighted blend of 9 inputs, each scored 0–100. Each bar is that input's sub-score; the figure is the points it added to the 100-point composite (weight × sub-score).
- Cash flow +28.6/30.0
- DSCR +10.0/10.0
- 1% rule +8.7/10.0
- Livability +3.8/5.0
- Rent growth +3.2/5.0
- Condition / age +2.5/5.0
- ARV discount +1.2/15.0
- Schools +0.7/10.0
- Appreciation +0.0/10.0
$199,000
🖨 Deal sheet 📄 Offer letter ✓ Due diligence
Listing remarks MLS
Investment opportunity, This semi attached home is tenant occupied with long term tenant who would like to stay in the home. Totally renovated, new modern kitchen with ceramic tiles, brand new stainless steel appliances (refrigerator, stove and dishwasher), new gas heater and gas hot water heater, new electric service and most wiring, new windows, main roof is new, fenced yard, new light fixtures through entire house, new bath, recessed lighting, new laminate floors in living room and dining room, electric fireplace. This is a Must SEE!!! Multiple offers received. Highest and best is due by 5:00 9/29/2020
Key facts
- Built 1909
- Listed 4 days
Property features AI
Finance
- Other: Ownership: Fee simple; Above-grade finished area reported by assessor
Exterior
- Parking: Driveway parking; On-street parking
- Utilities: Public water; Public sewer; Hot water: natural gas
- Home design: Semi-detached structure
- Construction: Concrete perimeter foundation; Above-grade and below-grade structures
- Exterior features: Brick front; Lot dimensions approximately 22 x 100 feet; No tidal water
Interior
- Bedrooms: Three bedrooms on the first upper level; Two bedrooms on the second upper level
- Bathrooms: One full bathroom (all upper levels)
- Heating & cooling: Radiator heating (natural gas); Window air conditioning units (powered by natural gas)
- Interior features: Unfinished basement
Neighborhood map
What this means for you Summary
Snapshot
- This is a 5-bed/1.0-bath townhouse listed at $199k.
Deal economics
- At list price, monthly cash flow is $592 ($7k/yr) — positive.
- The deal already cash-flows at list — no discount required.
- Meets the 1% rule at list price ($3k rent vs $199k).
- Cap rate 10.3% vs local median 6.3% in Trenton — top-decile yield for the area; either an underpriced asset or a hidden risk that comps aren't pricing in. Stress-test before assuming the spread holds.
Location & tenants
- Location reads 76/100 on livability (#133 in NJ, #3,533 nationally) — a middle-class / working-renter tenant base. Strengths: amenities A+, commute A+, health & safety A+; Watch: schools F, crime F, employment F.
- Trenton Public School District (urban): math 2% / reading 16% proficiency, ranked #471 of 472 in NJ (top 100%) — low school quality limits family demand, transient renter base, plan for 1-2y turnover; 80% free/reduced lunch — lower-income household profile, screen leases tightly.
- Market conditions: Rents rising (+2.6%/yr); 144 active listings in the ZIP; 12 comparable units currently listed for rent nearby; rentals leasing fast (median 14d on market — plan ~1-2 weeks tenant-placement turnaround); 2,256 units permitted in Mercer County in 2024 (1,303 in 5+ unit buildings).
- At $2,722/mo this rent would consume 65% of the median local household income ($50k/yr) (locally 2116% of renters already pay >50% of income on rent) — very limited rent-growth headroom before tenants either downsize or default.
Forward outlook
- Local home prices are declining (-3.0%/yr); year-one equity from $1k of loan paydown is wiped out by about $6k of value loss. Plan a longer hold.
- Mercer County population projected at +4% by 2050 — modest demand growth; plan on rents tracking national, not racing it.
- At projected returns (-3.0% appreciation + 2.6% rent growth), your $56k cash investment doubles in ~10 years — after that, you're playing with house money.
Negotiation context
- Only 4 days on market — expect competitive offers; lowballing is unlikely to land.
- 14 sale attempts since 18y ago; this cycle's ask has dropped $11k (5%) from the opening price — seller is motivated, your offer sets the floor, not the list.
- Current owner paid $76k; list at $199k implies a 162% gain — meaningful room to come down on a strong offer.
Risks & watch-outs
- Watch-outs: flood insurance adds $66/mo; built in 1909 — expect roof / HVAC / electrical / plumbing capex.
- Climate carrying-cost: severe flood risk; major wind risk, 27% chance of damaging wind over 30y; extreme-heat days projected 7→15/yr by 2055 (HVAC capex compounding) — expect insurance premiums to compound above CPI over the hold.
Questions for the listing agent
- Built in 1909 — when were the roof, HVAC, electrical panel, plumbing, and water heater last replaced?
- What's the actual annual flood-insurance premium (NFIP or private), and is the property in a SFHA with mandatory coverage?
- Is there a deadline driving the sale (1031 exchange, divorce, estate, relocation)? That informs how much negotiation room exists.
- Schools are F-rated, which usually means shorter tenancies and higher turnover. Who's the typical renter profile here, and what's been the actual vacancy rate?
- Crime grade is F in this area — have there been break-ins, vandalism, or insurance claims at this property in the last 3 years? What carrier currently insures it and at what premium?
- What's the average days-on-market for RENTAL listings here right now (not sales)? A rising rental-DOM trend means longer vacancies and softer asking-rent achievability than the comps imply.
- What's the recent tenant-quality profile in this submarket — average credit score on applications, eviction rate, late-payment / NSF rate, and stable-employment percentage? A property-management company in the area should have these aggregated.
- How much new for-sale + rental construction is in the pipeline within 1–3 miles? Heavy new supply typically softens prices + rents 12–24 months out; constrained supply supports both.
Investment metrics
- 1% rule
- 1.37% ✓
- Cap rate
- 10.26%
- Cash-on-cash
- 14.18%
- DSCR
- 1.63
- GRM
- 6.1
CMA / ARV
- ARV (on-the-fly)
- $174,680
- Comps found
- 12
Show comp detail 12 sales within ~0.75 mi
| Address | Dist | Beds/Ba | Sqft | Sold | Price | $/sf | Match |
|---|---|---|---|---|---|---|---|
| 44 Delawareview Ave | 0.07mi | 4/1.0 (-1) | 1,564 (-2%) | 8mo | $172,500 | $110 | 82 |
| 506 Riverside Ave | 0.10mi | 4/1.0 (-1) | 1,402 (-12%) | 3mo | $160,000 | $114 | 69 |
| 58 W End Ave | 0.25mi | 4/1.0 (-1) | 1,506 (-5%) | 8mo | $80,000 | $53 | 68 |
| 508 Riverside Ave | 0.10mi | 4/1.0 (-1) | 1,384 (-13%) | 1mo | $160,000 | $116 | 68 |
| 12 Jarvis Pl | 0.30mi | 4/1.0 (-1) | 1,736 (+9%) | 10mo | $160,000 | $92 | 57 |
| 31 Bryn Mawr Ave | 0.71mi | 4/1.0 (-1) | 1,596 (+0%) | 7mo | $181,050 | $113 | 55 |
| 129 Passaic St | 0.45mi | 4/1.5 (-1) | 1,734 (+9%) | 9mo | $190,000 | $110 | 49 |
| 205 Rosemont Ave | 0.59mi | 4/1.0 (-1) | 1,432 (-10%) | 10mo | $120,000 | $84 | 43 |
| 28 Bryn Mawr Ave | 0.69mi | 4/1.0 (-1) | 1,428 (-10%) | 4mo | $130,000 | $91 | 42 |
| 22 Bryn Mawr Ave | 0.68mi | 4/1.0 (-1) | 1,772 (+12%) | 6mo | $205,000 | $116 | 39 |
| 210 Highland Ave | 0.69mi | 4/1.0 (-1) | 1,422 (-10%) | 10mo | $115,000 | $81 | 37 |
| 212 Highland Ave | 0.70mi | 4/1.0 (-1) | 1,422 (-10%) | 10mo | $115,000 | $81 | 37 |
Match score weights: distance 35% · size 25% · config 20% · recency 20%. Top-matched comps best support the ARV.
Projected returns pro-forma
-3.0% appreciation · 2.6% rent growth · sell at horizon
- IRR
- 2.1%
- Equity multiple
- 1.08×
- Total profit
- $4,511
- Equity at exit
- $29,672
- IRR
- 11.3%
- Equity multiple
- 1.87×
- Total profit
- $48,649
- Equity at exit
- $17,206
Cash invested: $55,720 (down + closing). Projections, not guarantees.
Landlord ↔ Tenant lean methodology
- Overall (STATE)
- 21 Tenant-Leaning
- State New Jersey
- 21 Tenant-Leaning · D+6
- County
- — inherits STATE
- City
- — inherits STATE
ZIP-level market 08618
- Rents YoY
- 2.6%
- Active inventory
- 144
- Price-to-rent
- 6.1×
Monthly cashflow live
- Estimated rent
- $2,722 high interval (Pro) →
- Mortgage (P&I)
- −$1,044
- Tax from tax record
- −$366 /mo · $4,388/yr
- Insurance
- −$83
- Flood insurance flood zone
- −$66 /mo · $798/yr
- HOA
- −$0
- Vacancy / Maint / Mgmt
- −$572
- Net cashflow
- $592
Break-even live
UW: 25.0% down · 7.5% · 30yr · 1.5% tax · 5.0% vac · 8.0% maint · 8.0% mgmt
Financing live
Cash to close
- Down payment
- $49,750
- Closing costs
- $5,970
- Reserves months
- —
- Total cash needed
- —
Loan-product check · same deal, 3 products live
Conventional
25% down · 7.5% · 30yr
- Down + closing
- —
- Monthly P&I
- —
- Monthly cashflow
- —
- DSCR
- —
- Eligible?
- —
Personal DTI + credit; lowest rate.
DSCR
20% down · 8.5% · 30yr
- Down + closing
- —
- Monthly P&I
- —
- Monthly cashflow
- —
- DSCR
- —
- Eligible?
- —
No personal income docs; deal must DSCR.
Hard money
10% down · 12.0% · 12mo
- Down + closing
- —
- Monthly P&I
- —
- Monthly cashflow
- —
- DSCR
- —
- Eligible?
- —
Short-term bridge; refi at stabilization.
Rent comps 12 comps
| Address | Beds | Baths | Sqft | Rent | $/sqft | DOM | Units | Dist |
|---|---|---|---|---|---|---|---|---|
| 649 W State St Trenton, NJ | 5.0 | 2.0 | 1870 | $2,900 | $1.55 | 12d | 1 | 0.19mi |
| 510 W Hanover St Trenton, NJ | 5.0 | 1.0 | 1200 | $2,200 | $1.83 | 13d | 1 | 0.34mi |
| 223 Spring St Trenton, NJ | 6.0 | 2.0 | 1490 | $2,700 | $1.81 | 4d | 1 | 0.50mi |
| 319 Rutherford Ave Trenton, NJ | 4.0 | 2.0 | 1100 | $2,200 | $2.00 | 21d | 1 | 0.52mi |
| 510 N Hermitage Ave Trenton, NJ | 5.0 | 1.5 | 1316 | $2,500 | $1.90 | 12d | 1 | 0.54mi |
| 311 Calhoun St Trenton, NJ | 4.0 | 1.0 | 1516 | $2,400 | $1.58 | 43d | 1 | 0.56mi |
| 73 Bellevue Ave Trenton, NJ | 4.0 | 2.0 | 1950 | $2,400 | $1.23 | 13d | 1 | 0.68mi |
| 73 Oak Ln #2 Trenton, NJ | 4.0 | 1.0 | 1886 | $2,300 | $1.22 | 13d | 1 | 0.88mi |
| 1442 W State St Trenton, NJ | 5.0 | 2.5 | 1956 | $3,000 | $1.53 | 12d | 1 | 1.02mi |
| 130 W Ingham Ave Trenton, NJ | 4.0 | 1.0 | 1126 | $2,000 | $1.78 | 13d | 1 | 1.12mi |
| 134 Old Rose St Trenton, NJ | 4.0 | 2.0 | 1212 | $2,300 | $1.90 | 21d | 1 | 1.20mi |
| 129 Clearfield Ave Trenton, NJ | 4.0 | 1.5 | 1358 | $3,000 | $2.21 | 12d | 1 | 1.22mi |
Listing history 9 events
-
2026-06-18days on market $199,000 Active 4 DOM
-
2026-06-17days on market $199,000 Active 3 DOM
-
2026-06-16days on market $199,000 Active 2 DOM
-
2026-06-15statusdays on market $199,000 Active 1 DOM
-
2026-06-14days on market $199,000 Coming Soon 6 DOM
-
2026-06-10days on market $199,000 Coming Soon 3 DOM
-
2026-06-09days on market $199,000 Coming Soon 2 DOM
-
2026-06-08remarks 693-char remark
-
2026-06-08$199,000 Coming Soon 1 DOM
ⓘ Source: listings_history table (triggers on properties + properties_extension) + one-shot
backfill from property_details.listing_events for pre-trigger history.
Tax reassessment forecast NJ · Partial reset (capped growth)
- Current annual tax
- $4,388 · $366/mo
- Projected year-2 tax
- $4,672 · $389/mo
- Expected delta
- +$284/yr (+$24/mo · 6.5%)
ⓘ Screening estimate from a state-policy table — verify with the county assessor before closing.
Climate risk First Street
- Flood 8/10 Severe FEMA zone X (shaded) · 99% chance over 30 yrs
- Wildfire 2/10 Low
- Heat 6/10 Major 7 d/yr ≥103°F today · 15 d/yr by 30 yrs out
- Wind 6/10 Major 27% chance of damaging wind over 30 yrs
- Air quality 5/10 Major 6 unhealthy d/yr today · 8 by 30 yrs out
Nearby sold comps map
Loading sold comps map…
Walkable amenities ~0.75 mi
Loading nearby amenities…
Taxation est. · year 1
- Rental income
- $32,665
- − Mortgage interest
- −$11,147
- − Property taxes
- −$4,388
- − Insurance
- −$1,792
- − Repairs & maintenance
- −$2,613
- − Management
- −$2,613
- − Depreciation
- −$5,789
- Taxable income
- $4,322
- Est. tax owed @ 24.0%
- −$1,037
- After-tax cash flow
- $6,065/yr
For passive investors: Depreciation is non-cash, so a rental often shows a tax loss while cash-flowing — sheltering income. Rental losses are passive: they offset passive income freely, and up to $25,000/yr can offset ordinary (W-2) income if you actively participate and your MAGI is under $100k (phasing out to $0 by $150k); unused losses carry forward. On sale, claimed depreciation is recaptured at up to 25%, and gains may owe capital-gains tax (a 1031 exchange can defer both). Figures are a year-1 estimate at your 24.0% rate — not tax advice; consult a CPA.
Schools (NCES district)
- District
- Trenton Public School District
- NCES district ID
- 3416290
- Math proficiency
- 2% ▼ -8.00%
- Reading proficiency
- 16% ▼ -4.00%
- Median HH income
- $35,078
- Composite
- 7.31/100
- National rank
- #9956
- State rank
- #471 of 472 in NJ
Livability — Trenton
- Score
- 76/100
- State rank
- #133
- US rank
- #3533
Category grades
Schools grade is shown separately in the Schools card above.
Census & demographics
- Census place
- Trenton, NJ
- County
- Mercer County · 327,655 people
- City population
- 177,819
- Metro
- Trenton-Princeton, NJ
- Population (ZIP)
- 35,634
- Household income
- $50,390
- Rent vs Own
- Severe rent burden
- 2116.0
Population outlook (Mercer County) Hauer SSP2
- Today (2025)
- 381,395 people
- By 2030
- 384,640 · +0.9%
- By 2040
- 391,431 · +2.6%
- By 2050
- 397,845 · +4.3%
- By 2075
- 417,281 · +9.4%
- By 2100
- 420,327 · +10.2%
Race, ethnicity, and origin ACS 2023
- Neighborhood character
- Diverse neighborhood (Simpson 0.59)
- Race & ethnicity
- Black 59% White 19% Hispanic / Latino 16% Two or more races 7% Asian 3%
- Hispanic origin (detail)
- Mexican 1% Puerto Rican 6% Dominican 3%
- Common ancestry
- Romanian 2% Hispanic 1% Scotch-Irish 1%
- Foreign-born
- 14% · Canada, China, South Korea
- Languages at home
- 80% English-only · Spanish 10% Other Indo-European 3% Arabic 1%
Political lean MEDSL · Mercer
- 2024 margin
- Solid D (+33.9) · D 65.9% · R 32.0% · Other 2.1%
- 2008→2024 swing
- -2.2pp toward R · 2008: 36.1pp · 2024: 33.9pp
- All cycles
- 2024: D+33.9 2020: D+40.0 2016: D+36.2 2012: D+36.8 2008: D+36.1
Not yet ingested
- Civics
- —
Market trends
- HPI YoY
- ▼ -309.54%
- Current HPI
- 288.6841
- Rent YoY
- ▲ 2.60%
- Metro
- Trenton-Princeton, NJ
- State GDP YoY
- ▲ 2.05%
- F500 in state
- 34
Industry mix (Fortune 500 HQ in NJ)
| Industry | F500 HQs | Revenue |
|---|---|---|
| Consumer Goods | 3 | $31B |
|
||
| Pharmaceuticals | 2 | $153B |
|
||
| Technology | 2 | $21B |
|
||
| Insurance | 2 | $20B |
|
||
| Healthcare | 2 | $19B |
|
||
| Financial Services | 1 | $70B |
|
||
Price history
+231.7% since first listed34 events — show timeline
- 2026-06-07 Coming Soon $199,000 BRIGHT MLS
- 2026-04-27 Listing Removed — BRIGHT MLS
- 2026-04-21 Price Changed $199,000 BRIGHT MLS
- 2026-01-23 Listed $210,000 BRIGHT MLS
- 2021-02-05 Sold (Public Records) $76,000 Public Records
- 2020-12-01 Sold (MLS) $76,000 BRIGHT MLS
- 2020-11-17 Pending — BRIGHT MLS
- 2020-10-03 Contingent — BRIGHT MLS
- 2020-08-13 Relisted — BRIGHT MLS
- 2020-08-12 Contingent — BRIGHT MLS
- 2020-07-15 Listed $69,999 BRIGHT MLS
- 2016-10-17 Listing Removed — BRIGHT MLS
- 2015-04-17 Listed $91,200 BRIGHT MLS
- 2015-04-01 Listing Removed — BRIGHT MLS
- 2014-10-01 Listed $91,200 BRIGHT MLS
- 2014-09-19 Listing Removed — BRIGHT MLS
- 2014-03-19 Listed $100,000 BRIGHT MLS
- 2012-12-11 Listing Removed — BRIGHT MLS
- 2012-08-10 Listed $105,000 BRIGHT MLS
- 2012-07-23 Listing Removed — BRIGHT MLS
- 2012-04-23 Listed $105,000 BRIGHT MLS
- 2012-04-10 Listing Removed — BRIGHT MLS
- 2011-10-10 Listed $115,000 BRIGHT MLS
- 2011-08-15 Listing Removed — BRIGHT MLS
- 2010-11-16 Listed $125,000 BRIGHT MLS
- 2010-08-19 Listing Removed — BRIGHT MLS
- 2010-07-02 Listed $129,900 BRIGHT MLS
- 2010-06-21 Listing Removed — BRIGHT MLS
- 2009-09-21 Listed $129,900 BRIGHT MLS
- 2009-08-22 Listing Removed — BRIGHT MLS
- 2009-02-23 Listed $143,000 BRIGHT MLS
- 2008-10-09 Sold (MLS) $40,000 BRIGHT MLS
- 2008-09-20 Listing Removed — BRIGHT MLS
- 2008-08-26 Listed $60,000 BRIGHT MLS
Property tax history
+0.2%/yrLatest (2025): $4,388 · +1.5% YoY. Source: county tax records.
Cash-flow waterfall
monthlySold comps — $/sqft
last 12 mo · ≤1 miLoading sold comps…