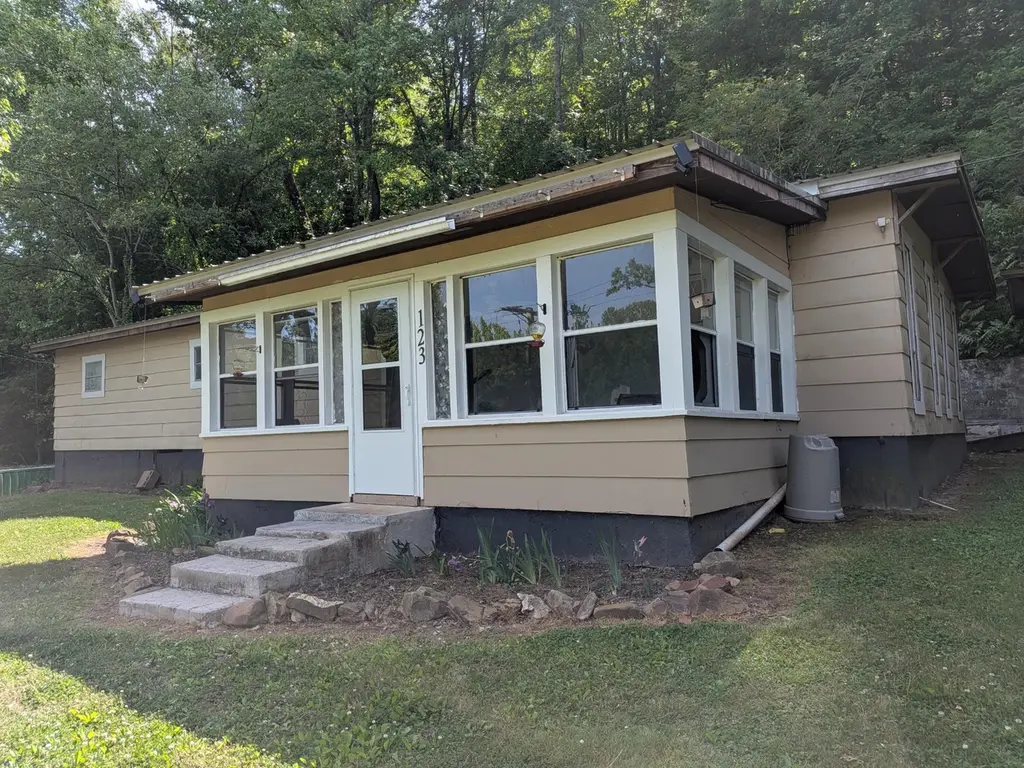
123 Hard Rector Ln · Spring City, TN
Flood risk No data
- FEMA flood zone
- —
- Chance of flooding over 30 yrs
- —
- Est. flood insurance / yr
- —
Fire risk No data
- Est. fire insurance / yr
- —
Heat risk No data
- Hot days now (above threshold)
- —
- Hot days in 30 yrs
- —
Wind risk No data
- Chance of severe wind over 30 yrs
- —
Air-quality risk No data
- Unhealthy air days now
- —
- Unhealthy air days in 30 yrs
- —
Risk factors via First Street. Map © Google.
Why this score? — see what drove the B- grade
The composite is a weighted blend of 9 inputs, each scored 0–100. Each bar is that input's sub-score; the figure is the points it added to the 100-point composite (weight × sub-score).
- Cash flow +30.0/30.0
- 1% rule +10.0/10.0
- DSCR +10.0/10.0
- ARV discount +7.5/15.0
- Livability +3.5/5.0
- Schools +2.8/10.0
- Rent growth +2.5/5.0
- Condition / age +2.5/5.0
- Appreciation +0.0/10.0
$75,000
🖨 Deal sheet 📄 Offer letter ✓ Due diligence
Listing remarks MLS
Doublewide on over 5 acres a the base of a mountain across from Piney River. Appalachian living awaits. This home has potential as a remodel or total rebuild. Featuring 4 bedrooms and 1 bathroom, the home needs TLC but is livable in its current state. The home's electrical power pole is only 2 years old and the breaker box has been updated. The home has a metal roof and a nice sunroom. Located less than a mile from the Cumberland Trail and Piney River picnic area. Close to town, the Blistered Chicken Saloon is next door. There is a shared driveway with the neighbor and the well is shared also. Sold As Is. No mobile home title. Mineral rights do not convey. Schedule your showing today!
Key facts
- Metal roof
- Cumberland trail
- Over 5 acres
Tags
Property features AI
Exterior
- Parking: Driveway with gravel surface
- Utilities: Well water; Septic tank
- Home design: Residential property; Three or more levels
- Construction: Metal roof
- Exterior features: Sloped lot; About 5.7-acre lot
Interior
- Kitchen: Electric range; Refrigerator
- Bedrooms: Four bedrooms (all on the main level)
- Flooring: Vinyl flooring; Other flooring
- Bathrooms: One full bathroom
- Heating & cooling: Heating present (other type); Cooling via wall/window unit(s)
- Interior features: Appliances included: Electric range, refrigerator, washer, dryer; Vinyl and other flooring; Crawl space basement
- Laundry & utility: Washer and dryer included
Neighborhood map
What this means for you Summary
Snapshot
- This is a 4-bed/1.0-bath manufactured listed at $75k.
Deal economics
- At list price, monthly cash flow is $524 ($6k/yr) — positive.
- The deal already cash-flows at list — no discount required.
- Meets the 1% rule at list price ($1k rent vs $75k).
- Cap rate 14.7% vs local median 1.8% in Spring City — top-decile yield for the area; either an underpriced asset or a hidden risk that comps aren't pricing in. Stress-test before assuming the spread holds.
Location & tenants
- Location reads 70/100 on livability (#50 in TN) — a middle-class / working-renter tenant base. Strengths: crime A+, cost of living A+, housing A+; Watch: health & safety C-, amenities F, commute F.
- Rhea County (rural): math 35% / reading 31% proficiency, ranked #38 of 139 in TN (top 27%) — families likely to look elsewhere, expect single-tenant / working-renter base with shorter leases.
- Zoned schools: Spring City Elementary (math 41% / reading 35%, grade F, #266 of 952 statewide, top 28%, 570 students, 0% FRL); Rhea County High School (math 24% / reading 35%, grade F, #86 of 332 statewide, top 27%, 1,500 students, 0% FRL) — zoned schools average 0% FRL vs 60% district-wide (60 pts lower); this property's tenant base skews higher-income than the district average.
- Market conditions: 184 active listings in the ZIP; 198 units permitted in Rhea County in 2024 (40 in 5+ unit buildings).
Forward outlook
- Local home prices are declining (-3.0%/yr); year-one equity from $519 of loan paydown is wiped out by about $2k of value loss. Plan a longer hold.
- At projected returns (-3.0% appreciation + 3.0% rent growth), your $21k cash investment doubles in ~5 years — after that, you're playing with house money.
Negotiation context
- Only 7 days on market — expect competitive offers; lowballing is unlikely to land.
- 3 sale attempts with the ask held roughly flat each time — persistent listings suggest the price (not the market) is what's stuck; bring a comps-based counter.
Questions for the listing agent
- Built in 1976 — when were the roof, HVAC, electrical panel, plumbing, and water heater last replaced?
- Is there a deadline driving the sale (1031 exchange, divorce, estate, relocation)? That informs how much negotiation room exists.
- Schools are F-rated, which usually means shorter tenancies and higher turnover. Who's the typical renter profile here, and what's been the actual vacancy rate?
- What's the average days-on-market for RENTAL listings here right now (not sales)? A rising rental-DOM trend means longer vacancies and softer asking-rent achievability than the comps imply.
- What's the recent tenant-quality profile in this submarket — average credit score on applications, eviction rate, late-payment / NSF rate, and stable-employment percentage? A property-management company in the area should have these aggregated.
- How much new for-sale + rental construction is in the pipeline within 1–3 miles? Heavy new supply typically softens prices + rents 12–24 months out; constrained supply supports both.
Investment metrics
- 1% rule
- 1.63% ✓
- Cap rate
- 14.67%
- Cash-on-cash
- 29.93%
- DSCR
- 2.33
- GRM
- 5.1
CMA / ARV
- ARV (median comp)
- $187,000
- List price
- $75,000
- Delta
- -59.89%
- Verdict
- UNDERPRICED
- Comps
- 19 within 1.0 mi
Show comp detail 1 sale within ~0.75 mi
| Address | Dist | Beds/Ba | Sqft | Sold | Price | $/sf | Match |
|---|---|---|---|---|---|---|---|
| 1350 Wassom Memorial Hwy | 0.38mi | 3/2.0 (-1) | 1,440 (0%) | 13mo | $110,000 | $76 | 63 |
Match score weights: distance 35% · size 25% · config 20% · recency 20%. Top-matched comps best support the ARV.
Projected returns pro-forma
-3.0% appreciation · 3.0% rent growth · sell at horizon
- IRR
- 24.5%
- Equity multiple
- 2.01×
- Total profit
- $21,181
- Equity at exit
- $11,183
- IRR
- 32.3%
- Equity multiple
- 3.92×
- Total profit
- $61,290
- Equity at exit
- $6,485
Cash invested: $21,000 (down + closing). Projections, not guarantees.
Landlord ↔ Tenant lean methodology
- Overall (STATE)
- 87 Strongly Landlord-Friendly
- State Tennessee
- 87 Strongly Landlord-Friendly · R+13
- County
- — inherits STATE
- City
- — inherits STATE
ZIP-level market 37381
- Home prices YoY
- -3.6%
- Active inventory
- 184
- Price-to-rent
- 5.1×
Monthly cashflow live
- Estimated rent
- $1,224 medium interval (Pro) →
- Mortgage (P&I)
- −$393
- Tax from tax record
- −$18 /mo · $219/yr
- Insurance
- −$31
- HOA
- −$0
- Vacancy / Maint / Mgmt
- −$257
- Net cashflow
- $524
Break-even live
UW: 25.0% down · 7.5% · 30yr · 1.5% tax · 5.0% vac · 8.0% maint · 8.0% mgmt
Financing live
Cash to close
- Down payment
- $18,750
- Closing costs
- $2,250
- Reserves months
- —
- Total cash needed
- —
Loan-product check · same deal, 3 products live
Conventional
25% down · 7.5% · 30yr
- Down + closing
- —
- Monthly P&I
- —
- Monthly cashflow
- —
- DSCR
- —
- Eligible?
- —
Personal DTI + credit; lowest rate.
DSCR
20% down · 8.5% · 30yr
- Down + closing
- —
- Monthly P&I
- —
- Monthly cashflow
- —
- DSCR
- —
- Eligible?
- —
No personal income docs; deal must DSCR.
Hard money
10% down · 12.0% · 12mo
- Down + closing
- —
- Monthly P&I
- —
- Monthly cashflow
- —
- DSCR
- —
- Eligible?
- —
Short-term bridge; refi at stabilization.
Listing history 3 events
-
2026-04-29$75,000 Active 693-char remark
-
2026-04-27$75,000 Active 715-char remark
Show marketing remark (715 chars)
Doublewide on over 5 acres at the base of a mountain across the road from Piney River. Appalachian living awaits. This home has potential as a remodel or total rebuild. Featuring 4 bedrooms and 1 bathroom, the home needs TLC but is livable in its current state. The home's electrical power pole is only 2 years old and the breaker box has been updated. The home has a metal roof and a nice sunroom. The home is located less than a mile from the Cumberland Trail and Piney River picnic area. Close to town, the Blistered Chicken Saloon is next door. There is a shared driveway with the neighbor and the well is shared also. Sold As Is. No mobile home title. Mineral rights do not convey. Schedule your showing today!
-
2026-04-27$75,000 Active
Show marketing remark (715 chars)
Doublewide on over 5 acres at the base of a mountain across the road from Piney River. Appalachian living awaits. This home has potential as a remodel or total rebuild. Featuring 4 bedrooms and 1 bathroom, the home needs TLC but is livable in its current state. The home's electrical power pole is only 2 years old and the breaker box has been updated. The home has a metal roof and a nice sunroom. The home is located less than a mile from the Cumberland Trail and Piney River picnic area. Close to town, the Blistered Chicken Saloon is next door. There is a shared driveway with the neighbor and the well is shared also. Sold As Is. No mobile home title. Mineral rights do not convey. Schedule your showing today!
ⓘ Source: listings_history table (triggers on properties + properties_extension) + one-shot
backfill from property_details.listing_events for pre-trigger history.
Tax reassessment forecast TN · Resets to sale price
- Current annual tax
- $219 · $18/mo
- Projected year-2 tax
- $532 · $44/mo
- Expected delta
- +$314/yr (+$26/mo · 143.2%)
ⓘ Screening estimate from a state-policy table — verify with the county assessor before closing.
Nearby sold comps map
Loading sold comps map…
Walkable amenities ~0.75 mi
Loading nearby amenities…
Taxation est. · year 1
- Rental income
- $14,683
- − Mortgage interest
- −$4,201
- − Property taxes
- −$219
- − Insurance
- −$375
- − Repairs & maintenance
- −$1,175
- − Management
- −$1,175
- − Depreciation
- −$2,182
- Taxable income
- $5,357
- Est. tax owed @ 24.0%
- −$1,286
- After-tax cash flow
- $5,000/yr
For passive investors: Depreciation is non-cash, so a rental often shows a tax loss while cash-flowing — sheltering income. Rental losses are passive: they offset passive income freely, and up to $25,000/yr can offset ordinary (W-2) income if you actively participate and your MAGI is under $100k (phasing out to $0 by $150k); unused losses carry forward. On sale, claimed depreciation is recaptured at up to 25%, and gains may owe capital-gains tax (a 1031 exchange can defer both). Figures are a year-1 estimate at your 24.0% rate — not tax advice; consult a CPA.
Schools (NCES district)
- District
- Rhea County
- NCES district ID
- 4703510
- Math proficiency
- 35% ▼ -7.00%
- Reading proficiency
- 31% ▼ -5.00%
- Median HH income
- $39,059
- Composite
- 27.67/100
- National rank
- #6917
- State rank
- #38 of 139 in TN
Livability — Spring City
- Score
- 70/100
- State rank
- #50
- US rank
- #7492
Category grades
Schools grade is shown separately in the Schools card above.
Census & demographics
- Population (ZIP)
- 10,170
Population outlook (Rhea County) Hauer SSP2
- Today (2025)
- 33,187 people
- By 2030
- 33,482 · +0.9%
- By 2040
- 33,786 · +1.8%
- By 2050
- 33,730 · +1.6%
- By 2075
- 33,603 · +1.3%
- By 2100
- 33,312 · +0.4%
Race, ethnicity, and origin ACS 2023
- Neighborhood character
- Predominantly White (94%)
- Race & ethnicity
- White 94% Hispanic / Latino 3% Two or more races 2% Black 2%
- Common ancestry
- Serbian 6% Slovak 2% Lithuanian 1%
- Foreign-born
- 1% · Canada
- Languages at home
- 99% English-only · Spanish 1%
Political lean MEDSL · Rhea
- 2024 margin
- Solid R (+66.9) · D 16.0% · R 82.9% · Other 1.1%
- 2008→2024 swing
- -20.7pp toward R · 2008: -46.2pp · 2024: -66.9pp
- All cycles
- 2024: R+66.9 2020: R+63.7 2016: R+61.3 2012: R+48.9 2008: R+46.2
Not yet ingested
- Civics
- —
Market trends
- HPI YoY
- ▼ -14.30%
- Current HPI
- 377.4917
- Rent YoY
- —
- Metro
- —
- State GDP YoY
- ▲ 2.78%
- F500 in state
- 22
Industry mix (Fortune 500 HQ in TN)
| Industry | F500 HQs | Revenue |
|---|---|---|
| Healthcare | 3 | $91B |
|
||
| Retail | 3 | $72B |
|
||
| Transportation / Logistics | 1 | $88B |
|
||
| Paper / Packaging | 1 | $19B |
|
||
| Insurance | 1 | $13B |
|
||
| Energy | 1 | $12B |
|
||
Price history
+0.0% since first listed6 events — show timeline
- 2026-05-23 Pending — RCAOR
- 2026-05-23 Pending — GCAR
- 2026-05-23 Pending — REALTRACS as Distributed by MLS Grid
- 2026-04-29 Listed $75,000 REALTRACS as Distributed by MLS Grid
- 2026-04-27 Listed $75,000 GCAR
- 2026-04-27 Listed $75,000 RCAOR
Property tax history
+7.7%/yrLatest (2025): $219 · +0.0% YoY. Source: county tax records.
Cash-flow waterfall
monthlySold comps — $/sqft
last 12 mo · ≤1 miLoading sold comps…