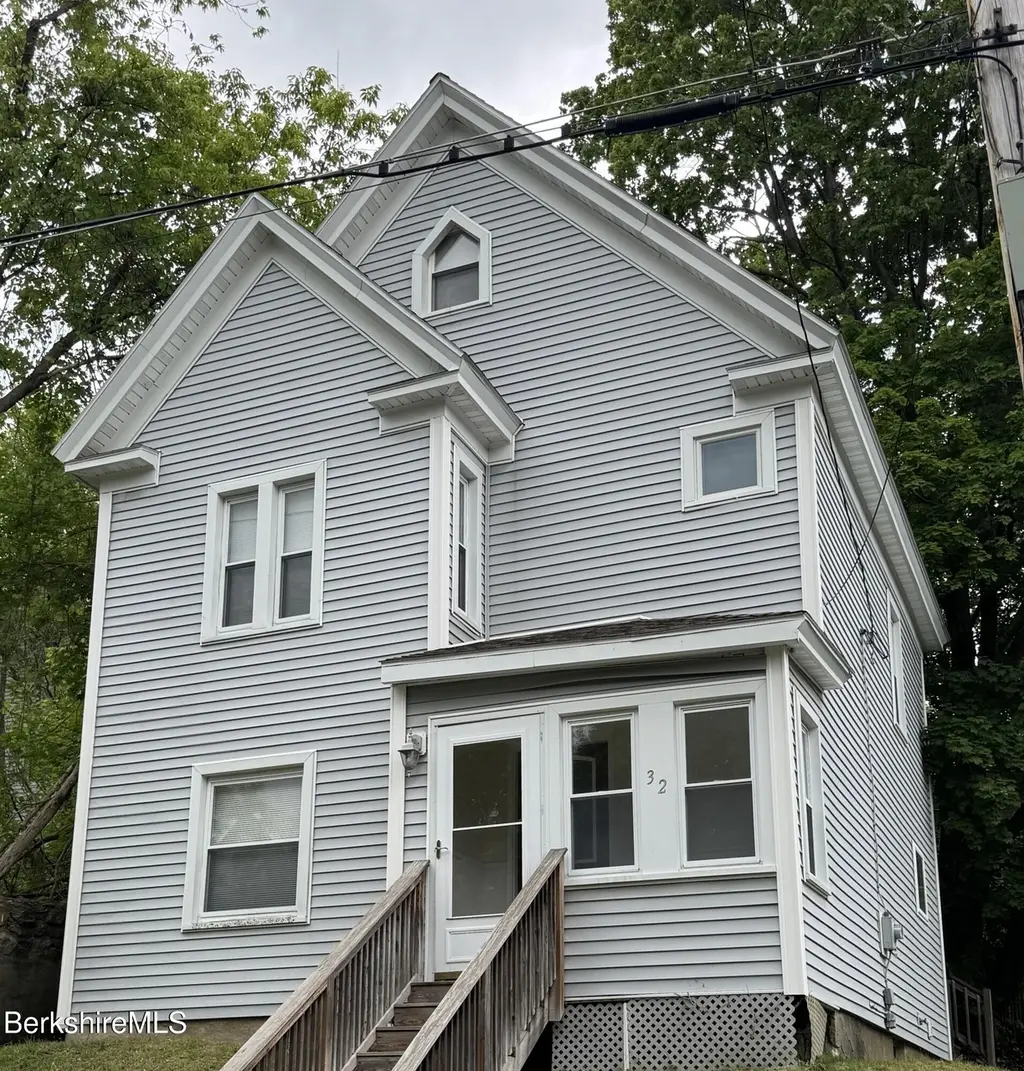
32 Hathaway St · North Adams, MA
Flood risk 1/10 · Minimal
- FEMA flood zone
- X
- Chance of flooding over 30 yrs
- 0.0%
- Est. flood insurance / yr
- $473 – $860
Fire risk 3/10 · Minor
- Est. fire insurance / yr
- $915 – $1,699
Heat risk 3/10 · Minor
- Hot days now (above 92°F)
- 9 days/yr
- Hot days in 30 yrs
- 21 days/yr
Wind risk 4/10 · Minor
- Chance of severe wind over 30 yrs
- 9.0%
Air-quality risk 2/10 · Minimal
- Unhealthy air days now
- 0 days/yr
- Unhealthy air days in 30 yrs
- 1 days/yr
Risk factors via First Street. Map © Google.
Why this score? — see what drove the D- grade
The composite is a weighted blend of 9 inputs, each scored 0–100. Each bar is that input's sub-score; the figure is the points it added to the 100-point composite (weight × sub-score).
- Cash flow +16.2/30.0
- DSCR +5.0/10.0
- 1% rule +4.2/10.0
- Livability +2.8/5.0
- Rent growth +2.5/5.0
- Condition / age +2.5/5.0
- Appreciation +1.9/10.0
- Schools +1.8/10.0
- ARV discount +0.9/15.0
$229,000
🖨 Deal sheet (PDF) 📄 Offer letter ✓ Due diligence
Listing remarks MLS
Walk to downtown! Steps to MoCA, this 3 bedroom one bath colonial was completely remodeled, with low maintenance living. Enjoy the nicely appointed kitchen with maple cabinets and a breakfast nook, formal dining room, enclosed front porch and rear deck, with an easy to maintain yard. Two bedrooms up with a full bath PLUS there's a 3rd floor primary en-suite which features a walk in closet and 3/4 tiled bath. The source of all representations are from the seller or a public source; broker has not verified same. It is recommended that buyer independently verify all information.
Key facts
- Galley kitchen
- Vaulted ceiling
- Walk-in closet
Tags
Property features AI
Exterior
- Parking: Off-street parking
- Utilities: 200 Amp service with circuit breakers; Public sewer
- Construction: Building area approximately 1,128
- Exterior features: Off-street parking
Interior
- Kitchen: Dishwasher; Refrigerator
- Flooring: Laminate
- Bathrooms: 2 full bathrooms
- Heating & cooling: Oil heating
- Interior features: Vaulted ceilings; Walk-in closet(s)
- Laundry & utility: Washer; Dryer
Neighborhood map
What this means for you Summary
Snapshot
- This is a 3-bed/1.0-bath single-family listed at $229k.
Deal economics
- At list price, monthly cash flow is $123 ($1k/yr) — positive.
- The deal already cash-flows at list — no discount required.
- To meet the 1% rule (rent ≥ 1% of price), the offer needs to be $212k (7.6% below list).
- Recommended offer: $212k (7.6% below list) — sets the bar for 1% rule.
Location & tenants
- Location reads 55/100 on livability (#242 in MA) — a working-class tenant base; expect higher turnover. Strengths: housing A+, cost of living A-; Watch: employment C-, health & safety D, crime F.
- North Adams (town): math 14% / reading 29% proficiency, ranked #291 of 302 in MA (top 96%) — low school quality limits family demand, transient renter base, plan for 1-2y turnover.
- Zoned schools: Colegrove Park Elementary (math 8% / reading 37%, grade F, #753 of 938 statewide, top 81%, 235 students, 0% FRL); Drury High (math 16% / reading 24%, grade F, #308 of 343 statewide, top 91%, 493 students, 0% FRL) — zoned schools average 0% FRL vs 53% district-wide (53 pts lower); this property's tenant base skews higher-income than the district average.
- Market conditions: 99 active listings in the ZIP; 5 comparable units currently listed for rent nearby; rentals at typical pace (median 16d on market — plan ~3-4 weeks tenant-placement turnaround); 40% of comp listings sitting > 30 days — soft ceiling on asking rent; 130 units permitted in Berkshire County in 2024 (10 in 5+ unit buildings).
Forward outlook
- Local home prices are declining (-3.0%/yr); year-one equity from $2k of loan paydown is wiped out by about $7k of value loss. Plan a longer hold.
- Berkshire County population projected at -24% by 2050 — secular population decline; favor cash flow + early exit over multi-decade hold.
Negotiation context
- Only 13 days on market — expect competitive offers; lowballing is unlikely to land.
- 7 sale attempts since 22y ago with the ask held roughly flat each time — persistent listings suggest the price (not the market) is what's stuck; bring a comps-based counter.
Risks & watch-outs
- Watch-outs: built in 1900 — expect roof / HVAC / electrical / plumbing capex.
Questions for the listing agent
- Built in 1900 — when were the roof, HVAC, electrical panel, plumbing, and water heater last replaced?
- Is there a deadline driving the sale (1031 exchange, divorce, estate, relocation)? That informs how much negotiation room exists.
- Schools are F-rated, which usually means shorter tenancies and higher turnover. Who's the typical renter profile here, and what's been the actual vacancy rate?
- Crime grade is F in this area — have there been break-ins, vandalism, or insurance claims at this property in the last 3 years? What carrier currently insures it and at what premium?
- The area grade is low — what's the realistic commute time and amenity access for the typical tenant pool here? Any planned neighborhood developments (good or bad) we should know about?
- What's the average days-on-market for RENTAL listings here right now (not sales)? A rising rental-DOM trend means longer vacancies and softer asking-rent achievability than the comps imply.
- What's the recent tenant-quality profile in this submarket — average credit score on applications, eviction rate, late-payment / NSF rate, and stable-employment percentage? A property-management company in the area should have these aggregated.
- How much new for-sale + rental construction is in the pipeline within 1–3 miles? Heavy new supply typically softens prices + rents 12–24 months out; constrained supply supports both.
Investment metrics
- 1% rule
- 0.92% ✗
- Cap rate
- 6.94%
- Cash-on-cash
- 2.30%
- DSCR
- 1.10
- GRM
- 9.0
CMA / ARV
- ARV (on-the-fly)
- $199,656
- Comps found
- 12
Show comp detail 12 sales within ~0.75 mi
| Address | Dist | Beds/Ba | Sqft | Sold | Price | $/sf | Match |
|---|---|---|---|---|---|---|---|
| 32 Hathaway | 0.00mi | 3/2.0 | 1,128 (0%) | 14mo | $213,000 | $189 | 84 |
| 11 Palmer Ave | 0.11mi | 2/2.0 (-1) | 1,128 (0%) | 16mo | $170,000 | $151 | 72 |
| 84 West Main St | 0.41mi | 3/1.0 | 1,064 (-6%) | 5mo | $197,000 | $185 | 68 |
| 37 Fuller St | 0.41mi | 3/1.5 | 1,232 (+9%) | 4mo | $225,000 | $183 | 60 |
| 501 Eagle St | 0.75mi | 3/1.0 | 1,162 (+3%) | 2mo | $260,000 | $224 | 58 |
| 65 School St | 0.69mi | 3/1.0 | 1,130 (+0%) | 18mo | $200,000 | $177 | 53 |
| 85 Furnace St | 0.62mi | 3/1.0 | 1,236 (+10%) | 4mo | $207,000 | $167 | 51 |
| 58 Wheeler Ave | 0.52mi | 3/1.0 | 1,048 (-7%) | 20mo | $161,000 | $154 | 47 |
| 4 Lamoureaux Pl | 0.44mi | 3/2.0 | 1,272 (+13%) | 16mo | $180,000 | $142 | 41 |
| 28 Goodrich St | 0.72mi | 3/1.0 | 1,272 (+13%) | 17mo | $225,000 | $177 | 31 |
| 458 West Main St | 0.73mi | 2/1.5 (-1) | 969 (-14%) | 18mo | $139,000 | $143 | 20 |
| 3R Francis St | 0.74mi | 2/2.0 (-1) | 960 (-15%) | 15mo | $173,000 | $180 | 20 |
Match score weights: distance 35% · size 25% · config 20% · recency 20%. Top-matched comps best support the ARV.
Projected returns pro-forma
-3.0% appreciation · 3.0% rent growth · sell at horizon
- IRR
- -12.6%
- Equity multiple
- 0.54×
- Total profit
- $-29,259
- Equity at exit
- $34,145
- IRR
- -3.6%
- Equity multiple
- 0.76×
- Total profit
- $-15,339
- Equity at exit
- $19,800
Cash invested: $64,120 (down + closing). Projections, not guarantees.
Landlord ↔ Tenant lean methodology
- Overall (STATE)
- 20 Strongly Tenant-Friendly
- State Massachusetts
- 20 Strongly Tenant-Friendly · D+15
- County
- — inherits STATE
- City
- — inherits STATE
ZIP-level market 01247
- Home prices YoY
- -2.0%
- Active inventory
- 99
- Price-to-rent
- 9.0×
Monthly cashflow live
- Estimated rent
- $2,117 high interval (Pro) →
- Mortgage (P&I)
- −$1,201
- Tax from tax record
- −$253 /mo · $3,037/yr
- Insurance
- −$95
- HOA
- −$0
- Vacancy / Maint / Mgmt
- −$445
- Net cashflow
- $123
Break-even live
Sensitivity live
| Price | -10% $253 | -5% $188 | +0% $123 | +5% $58 | +10% $-7 |
|---|---|---|---|---|---|
| Rent | -10% $-44 | -5% $39 | +0% $123 | +5% $207 | +10% $290 |
| Rate | -1.0pp $238 | -0.5pp $181 | base $123 | +0.5pp $64 | +1.0pp $3 |
UW: 25.0% down · 7.5% · 30yr · 1.5% tax · 5.0% vac · 8.0% maint · 8.0% mgmt
Financing live
Cash to close
- Down payment
- $57,250
- Closing costs
- $6,870
- Reserves months
- —
- Total cash needed
- —
Loan-product check · same deal, 3 products live
Conventional
25% down · 7.5% · 30yr
- Down + closing
- —
- Monthly P&I
- —
- Monthly cashflow
- —
- DSCR
- —
- Eligible?
- —
Personal DTI + credit; lowest rate.
DSCR
20% down · 8.5% · 30yr
- Down + closing
- —
- Monthly P&I
- —
- Monthly cashflow
- —
- DSCR
- —
- Eligible?
- —
No personal income docs; deal must DSCR.
Hard money
10% down · 12.0% · 12mo
- Down + closing
- —
- Monthly P&I
- —
- Monthly cashflow
- —
- DSCR
- —
- Eligible?
- —
Short-term bridge; refi at stabilization.
Rent comps 5 comps
| Address | Beds | Baths | Sqft | Rent | $/sqft | DOM | Units | Dist |
|---|---|---|---|---|---|---|---|---|
| 40 Cady St North Adams, MA | 3.0 | 1.5 | 1467 | $2,475 | $1.69 | 45d | 1 | 0.06mi |
| 14 Tyler St North Adams, MA | 2.0 | 1.0 | 1174 | $1,975 | $1.68 | 45d | 1 | 0.17mi |
| 210 Eagle St Unit 1 North Adams, MA | 2.0 | 1.0 | 1040 | $1,300 | $1.25 | 16d | 1 | 0.72mi |
| 132 E Quincy St Unit 3 North Adams, MA | 2.0 | 1.0 | 800 | $1,450 | $1.81 | 15d | 1 | 1.12mi |
| 21-23 Lyman St Unit 21B North Adams, MA | 2.0 | 1.0 | 725 | $1,300 | $1.79 | 16d | 1 | 1.15mi |
Listing history 10 events
-
2026-06-21days on market $229,000 Active 13 DOM
-
2026-06-21days on market $229,000 Active 12 DOM
-
2026-06-18days on market $229,000 Active 10 DOM
-
2026-06-17days on market $229,000 Active 9 DOM
-
2026-06-16days on market $229,000 Active 8 DOM
-
2026-06-15days on market $229,000 Active 7 DOM
-
2026-06-13days on market $229,000 Active 5 DOM
-
2026-06-12days on market $229,000 Active 4 DOM
-
2026-06-09remarks 699-char remark
-
2026-06-09$229,000 Active 1 DOM
ⓘ Source: listings_history table (triggers on properties + properties_extension) + one-shot
backfill from property_details.listing_events for pre-trigger history.
Tax reassessment forecast MA · Partial reset (capped growth)
- Current annual tax
- $3,037 · $253/mo
- Projected year-2 tax
- $3,037 · $253/mo
- Expected delta
- $0/yr ($0/mo · 0.0%)
ⓘ Screening estimate from a state-policy table — verify with the county assessor before closing.
Climate risk First Street
- Flood 1/10 Low FEMA zone X · 0% chance over 30 yrs
- Wildfire 3/10 Moderate
- Heat 3/10 Moderate 9 d/yr ≥92°F today · 21 d/yr by 30 yrs out
- Wind 4/10 Moderate 9% chance of damaging wind over 30 yrs
- Air quality 2/10 Low 0 unhealthy d/yr today · 1 by 30 yrs out
Nearby sold comps map
Loading sold comps map…
Walkable amenities ~0.75 mi
Loading nearby amenities…
Taxation est. · year 1
- Rental income
- $25,404
- − Mortgage interest
- −$12,828
- − Property taxes
- −$3,037
- − Insurance
- −$1,145
- − Repairs & maintenance
- −$2,032
- − Management
- −$2,032
- − Depreciation
- −$6,662
- Taxable loss
- −$2,332
- Est. tax savings @ 24.0%
- +$560
- After-tax cash flow
- $2,036/yr
For passive investors: Depreciation is non-cash, so a rental often shows a tax loss while cash-flowing — sheltering income. Rental losses are passive: they offset passive income freely, and up to $25,000/yr can offset ordinary (W-2) income if you actively participate and your MAGI is under $100k (phasing out to $0 by $150k); unused losses carry forward. On sale, claimed depreciation is recaptured at up to 25%, and gains may owe capital-gains tax (a 1031 exchange can defer both). Figures are a year-1 estimate at your 24.0% rate — not tax advice; consult a CPA.
Schools (NCES district)
- District
- North Adams
- NCES district ID
- 2508670
- Math proficiency
- 14% ▼ -13.00%
- Reading proficiency
- 29% ▼ -11.00%
- Median HH income
- $36,746
- Composite
- 17.83/100
- National rank
- #9006
- State rank
- #291 of 302 in MA
Livability — North Adams
- Score
- 55/100
- State rank
- #242
- US rank
- #23506
Category grades
Schools grade is shown separately in the Schools card above.
Census & demographics
- Census place
- North Adams, MA
- City population
- 14,967
- Population (ZIP)
- 14,967
Population outlook (Berkshire County) Hauer SSP2
- Today (2025)
- 119,723 people
- By 2030
- 114,608 · -4.3%
- By 2040
- 102,806 · -14.1%
- By 2050
- 91,305 · -23.7%
- By 2075
- 71,517 · -40.3%
- By 2100
- 57,988 · -51.6%
Race, ethnicity, and origin ACS 2023
- Neighborhood character
- Predominantly White (88%)
- Race & ethnicity
- White 88% Hispanic / Latino 5% Two or more races 4% Asian 3%
- Hispanic origin (detail)
- Puerto Rican 1%
- Common ancestry
- Lithuanian 15% Romanian 4% German 2%
- Foreign-born
- 5% · Canada
- Languages at home
- 95% English-only · Other Indo-European 2% Spanish 2% French/Haitian/Cajun 0%
Political lean MEDSL · Berkshire
- 2024 margin
- Solid D (+39.9) · D 68.9% · R 29.0% · Other 2.1%
- 2008→2024 swing
- -12.5pp toward R · 2008: 52.4pp · 2024: 39.9pp
- All cycles
- 2024: D+39.9 2020: D+47.1 2016: D+41.5 2012: D+53.7 2008: D+52.4
Not yet ingested
- Civics
- —
Market trends
- HPI YoY
- ▼ -6.22%
- Current HPI
- 298.8949
- Rent YoY
- —
- Metro
- —
- State GDP YoY
- ▲ 2.28%
- F500 in state
- 38
Industry mix (Fortune 500 HQ in MA)
| Industry | F500 HQs | Revenue |
|---|---|---|
| Technology | 3 | $17B |
|
||
| Insurance | 2 | $84B |
|
||
| Retail | 2 | $76B |
|
||
| Life Sciences | 1 | $43B |
|
||
| Energy Technology | 1 | $31B |
|
||
| Aerospace / Defense | 1 | $18B |
|
||
Price history
+472.5% since first listed17 events — show timeline
- 2026-06-04 Listed $229,000 BCMLS
- 2025-04-29 Sold (MLS) $213,000 MLS PIN
- 2025-04-29 Sold (MLS) $213,000 BCMLS
- 2025-04-17 Pending — BCMLS
- 2025-04-03 Pending — MLS PIN
- 2025-03-27 Relisted — MLS PIN
- 2025-03-26 Relisted — BCMLS
- 2025-03-24 Pending — MLS PIN
- 2025-03-24 Pending — BCMLS
- 2025-03-15 Listed $224,900 MLS PIN
- 2025-03-13 Listed $224,900 BCMLS
- 2007-06-28 Sold (Public Records) $153,000 Public Records
- 2007-06-28 Sold (MLS) $153,000 BCMLS
- 2007-05-21 Listed $149,900 BCMLS
- 2005-05-11 Sold (MLS) $42,553 MLS PIN
- 2004-12-17 Listed $45,000 MLS PIN
- 1990-07-19 Sold (Public Records) $40,000 Public Records
Property tax history
+8.3%/yrLatest (2023): $3,037 · +10.6% YoY. Source: county tax records.
Cash-flow waterfall
monthlySold comps — $/sqft
last 12 mo · ≤1 miLoading sold comps…