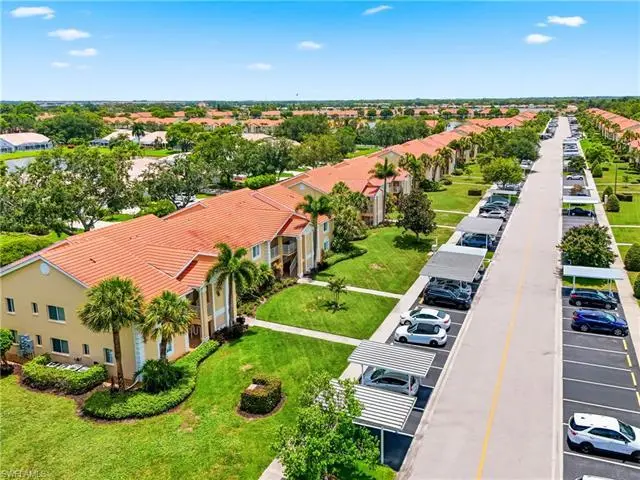
7774 Jewel Ln #102 · Pelican Marsh, FL
Flood risk 4/10 · Minor
- FEMA flood zone
- X (shaded)
- Chance of flooding over 30 yrs
- 0.13%
- Est. flood insurance / yr
- $507 – $1,088
Fire risk 1/10 · Minimal
- Est. fire insurance / yr
- $947 – $1,759
Heat risk 10/10 · Severe
- Hot days now (above 107°F)
- 7 days/yr
- Hot days in 30 yrs
- 29 days/yr
Wind risk 10/10 · Severe
- Chance of severe wind over 30 yrs
- 99.0%
Air-quality risk 2/10 · Minimal
- Unhealthy air days now
- 2 days/yr
- Unhealthy air days in 30 yrs
- 2 days/yr
Risk factors via First Street. Map © Google.
Why this score? — see what drove the C grade
The composite is a weighted blend of 9 inputs, each scored 0–100. Each bar is that input's sub-score; the figure is the points it added to the 100-point composite (weight × sub-score).
- Cash flow +19.7/30.0
- ARV discount +7.5/15.0
- 1% rule +7.2/10.0
- DSCR +6.3/10.0
- Appreciation +5.1/10.0
- Schools +5.0/10.0
- Rent growth +2.7/5.0
- Livability +2.5/5.0
- Condition / age +2.5/5.0
$265,000
🖨 Deal sheet (PDF) 📄 Offer letter ✓ Due diligence
Listing remarks
Tucked away on a quiet dead-end street in one of the area's most desirable locations, this beautifully updated first-floor condo offers the perfect balance of privacy, comfort, and convenience. From the moment you step inside, you'll appreciate the fresh, modern feel created by recently painted walls, doors, trim, and baseboards, complemented by new light fixtures throughout. Both bedrooms feature brand-new flooring, adding warmth and elegance to the living spaces. The thoughtfully designed floor plan includes two spacious bedrooms, two full bathrooms, a generously sized living room, and a dining area perfect for entertaining family and friends. The spacious kitchen is equipped with stainle
Key facts
- Brand-new flooring
- Spacious kitchen
- New light fixtures
Tags
Property features AI
Finance
- Other: Part of Villages at Emerald Lakes (sub-condo); 8 units in building, 8 units in complex, single floor in building
- Financial info: Total annual recurring HOA fees listed as $6,600; Total one-time fees listed as $2,650
- HOA & community: Mandatory HOA; Quarterly HOA fee; HOA covers insurance, irrigation water, lawn/land maintenance, legal/accounting, professional management, recreation facilities, repairs, reserves, sewer, street maintenance, trash removal and water; Community amenities include: clubhouse, community pool, exercise room, library, community room, basketball, tennis courts, pickleball, bocce, billiards, bike and jog path, play area, sidewalks, streetlights; Gated community with tennis
Exterior
- Parking: 1 assigned parking space; Guest parking available
- Security: Gated community
- Utilities: Central water; Central sewer; Cable available
- Home design: Residential low-rise (1–3 stories); Built in 1994; Concrete block construction; Stucco exterior; Shingle roof; Rear exposure faces east; Located in the EMERALD LAKES development
- Construction: Concrete block construction; Stucco finish; Shingle roof; Built in 1994
- Exterior features: Automatic sprinkler system; Landscaped area view; Central irrigation
Interior
- Kitchen: Dishwasher; Microwave; Range; Refrigerator/Freezer; Breakfast bar; Dining area combined with living
- Bedrooms: 2 bedrooms; Split bedroom floor plan
- Flooring: Laminate; Tile
- Bathrooms: 2 full bathrooms; Master bath with dual sinks and shower (no tub)
- Heating & cooling: Central electric heat; Central electric cooling
- Interior features: Foyer; Walk-in closet; Laundry in residence
- Laundry & utility: Washer/Dryer hookup in unit (laundry in residence)
Neighborhood map
What this means for you Summary
Snapshot
- This is a 2-bed/2.0-bath condo listed at $265k.
Deal economics
- At list price, monthly cash flow is $313 ($4k/yr) — positive.
- The deal already cash-flows at list — no discount required.
- Meets the 1% rule at list price ($3k rent vs $265k).
- Recommended offer: $261k (1.5% below list) — sets the bar for market timing.
Location & tenants
- Location reads: area grade C — affects rentability + tenant quality, not the cash-flow math above.
- Collier (suburban): math 60% / reading 56% proficiency, ranked #16 of 73 in FL (top 22%) — acceptable for families but not a draw, mixed tenant base, ~2y average lease.
- Zoned schools: Pelican Marsh Elementary School (math 87% / reading 83%, grade A+, #35 of 2,144 statewide, top 2%, 709 students, 29% FRL); Pine Ridge Middle School (math 74% / reading 70%, grade A, #52 of 571 statewide, top 10%, 832 students, 31% FRL); Barron Collier High School (math 62% / reading 68%, grade B, #76 of 667 statewide, top 11%, 1,650 students, 26% FRL) — zoned schools average 29% FRL vs 55% district-wide (26 pts lower); this property's tenant base skews higher-income than the district average.
- Zoned-school proficiency averages 74% at this address vs 58% district-wide (+16 pts) — the actual schools serving this property are materially stronger than the Collier average implies; a family-tenant draw the district grade alone would hide.
- Market conditions: Rents flat; 424 active listings in the ZIP; 40 comparable units currently listed for rent nearby; rentals at typical pace (median 16d on market — plan ~3-4 weeks tenant-placement turnaround); solid renter incomes; 3,520 units permitted in Collier County in 2024 (959 in 5+ unit buildings).
- This rent runs 42% of the median local income ($92k/yr) — at the standard rent-burdened threshold; future hikes will face affordability resistance.
Forward outlook
- In year one you build about $3k of equity ($2k loan paydown + $781 appreciation (0.3% local appreciation)).
- Collier County population projected at +30% by 2050 — long-run rental-demand tailwind backs the buy-and-hold thesis.
- By year 10, paydown + projected appreciation supports a ~$32k cash-out refi (75% LTV) — recoverable capital for the next deal without selling this one.
Negotiation context
- It's been on market 17 days — a 2% lower offer ($261k) is reasonable based on typical stale-listing flexibility.
- Current owner paid $62k; list at $265k implies a 331% gain — meaningful room to come down on a strong offer.
Risks & watch-outs
- Climate carrying-cost: severe wind risk, 99% chance of damaging wind over 30y; extreme-heat days projected 7→29/yr by 2055 (HVAC capex compounding) — expect insurance premiums to compound above CPI over the hold.
Questions for the listing agent
- What does the HOA fee cover, when was the last increase, and are there any pending special assessments or reserve-fund shortfalls?
- Any open or pending special assessments — roof, HVAC, plumbing, elevator, façade? What's the per-unit balance and payoff schedule, and is the seller paying it off at close or rolling it to the buyer?
- Is there a deadline driving the sale (1031 exchange, divorce, estate, relocation)? That informs how much negotiation room exists.
- What's the average days-on-market for RENTAL listings here right now (not sales)? A rising rental-DOM trend means longer vacancies and softer asking-rent achievability than the comps imply.
- What's the recent tenant-quality profile in this submarket — average credit score on applications, eviction rate, late-payment / NSF rate, and stable-employment percentage? A property-management company in the area should have these aggregated.
- How much new apartment / multifamily construction is in the pipeline within 1–3 miles? Heavy new supply (>2% of stock underway) typically softens rents 12–24 months out; light construction supports rent growth.
Investment metrics
- 1% rule
- 1.22% ✓
- Cap rate
- 7.71%
- Cash-on-cash
- 5.06%
- DSCR
- 1.23
- GRM
- 6.8
CMA / ARV
No comps found within radius.
Projected returns pro-forma
0.29% appreciation · 0.92% rent growth · sell at horizon
- IRR
- 2.7%
- Equity multiple
- 1.13×
- Total profit
- $9,532
- Equity at exit
- $80,878
- IRR
- 6.1%
- Equity multiple
- 1.65×
- Total profit
- $48,062
- Equity at exit
- $100,414
Cash invested: $74,200 (down + closing). Projections, not guarantees.
Landlord ↔ Tenant lean methodology
- Overall (STATE)
- 87 Strongly Landlord-Friendly
- State Florida
- 87 Strongly Landlord-Friendly · R+3
- County
- — inherits STATE
- City
- — inherits STATE
ZIP-level market 34109
- Home prices YoY
- 0.1%
- Rents YoY
- 0.9%
- Active inventory
- 424
- Price-to-rent
- 6.8×
Monthly cashflow live
- Estimated rent
- $3,236 high interval (Pro) →
- Mortgage (P&I)
- −$1,390
- Tax from tax record
- −$193 /mo · $2,320/yr
- Insurance
- −$110
- HOA
- −$550
- Vacancy / Maint / Mgmt
- −$679
- Net cashflow
- $313
Break-even live
Sensitivity live
| Price | -10% $463 | -5% $388 | +0% $313 | +5% $238 | +10% $163 |
|---|---|---|---|---|---|
| Rent | -10% $57 | -5% $185 | +0% $313 | +5% $441 | +10% $568 |
| Rate | -1.0pp $446 | -0.5pp $380 | base $313 | +0.5pp $244 | +1.0pp $174 |
UW: 25.0% down · 7.5% · 30yr · 1.5% tax · 5.0% vac · 8.0% maint · 8.0% mgmt
Financing live
Cash to close
- Down payment
- $66,250
- Closing costs
- $7,950
- Reserves months
- —
- Total cash needed
- —
Loan-product check · same deal, 3 products live
Conventional
25% down · 7.5% · 30yr
- Down + closing
- —
- Monthly P&I
- —
- Monthly cashflow
- —
- DSCR
- —
- Eligible?
- —
Personal DTI + credit; lowest rate.
DSCR
20% down · 8.5% · 30yr
- Down + closing
- —
- Monthly P&I
- —
- Monthly cashflow
- —
- DSCR
- —
- Eligible?
- —
No personal income docs; deal must DSCR.
Hard money
10% down · 12.0% · 12mo
- Down + closing
- —
- Monthly P&I
- —
- Monthly cashflow
- —
- DSCR
- —
- Eligible?
- —
Short-term bridge; refi at stabilization.
Rent comps 40 comps
| Address | Beds | Baths | Sqft | Rent | $/sqft | DOM | Units | Dist |
|---|---|---|---|---|---|---|---|---|
| 7774 Jewel Ln #201 Naples, FL | 3.0 | 2.0 | 1299 | $2,800 | $2.16 | 25d | 1 | 0.02mi |
| 7756 Jewel Ln #102 Naples, FL | 2.0 | 2.0 | 1022 | $3,700 | $3.62 | 25d | 1 | 0.08mi |
| 7750 Jewel Ln #103 Naples, FL | 2.0 | 2.0 | 1102 | $2,100 | $1.91 | 16d | 1 | 0.11mi |
| 7750 Jewel Ln #101 Naples, FL | 3.0 | 2.0 | 1199 | $2,400 | $2.00 | 23d | 1 | 0.11mi |
| 7754 Emerald Cir Unit T202 Naples, FL | 2.0 | 2.0 | 1022 | $3,850 | $3.77 | 16d | 1 | 0.15mi |
| 7778 Emerald Cir #104 Naples, FL | 3.0 | 2.0 | 1199 | $2,300 | $1.92 | 23d | 1 | 0.22mi |
| 7778 Emerald Cir #204 Naples, FL | 3.0 | 2.0 | 1199 | $6,750 | $5.63 | 16d | 1 | 0.22mi |
| 7719 Jewel Ln #103 Naples, FL | 2.0 | 2.0 | 1022 | $3,800 | $3.72 | 25d | 1 | 0.25mi |
| 7712 Jewel Ln Naples, FL | 2.0 | 2.0 | 1022 | $1,850 | $1.81 | 25d | 1 | 0.26mi |
| 7791 Esmeralda Way #203 Naples, FL | 2.0 | 2.0 | 1022 | $1,950 | $1.91 | 16d | 1 | 0.29mi |
| 7794 Emerald Cir Unit A-102 Naples, FL | 2.0 | 2.0 | 1022 | $4,000 | $3.91 | 16d | 1 | 0.29mi |
| 7800 Emerald Cir #104 Naples, FL | 2.0 | 2.0 | 1022 | $2,200 | $2.15 | 23d | 1 | 0.30mi |
| 7800 Emerald Cir Unit B104 Naples, FL | 2.0 | 2.0 | 1022 | $2,200 | $2.15 | 16d | 1 | 0.30mi |
| 7707 Jewel Ln #201 Naples, FL | 3.0 | 2.0 | 1199 | $2,900 | $2.42 | 25d | 1 | 0.30mi |
| 7546 Mill Pond Cir Naples, FL | 3.0 | 2.0 | 1373 | $6,500 | $4.73 | 25d | 1 | 0.37mi |
| 6914 Satinleaf Rd N #103 Naples, FL | 2.0 | 2.0 | 1404 | $6,200 | $4.42 | 25d | 1 | 0.66mi |
| 7287 Mill Pond Cir Naples, FL | 3.0 | 2.0 | 1355 | $3,800 | $2.80 | 25d | 1 | 0.66mi |
| 2460 Old Groves Rd Unit E102 Naples, FL | 2.0 | 2.0 | 1226 | $2,400 | $1.96 | 16d | 1 | 0.68mi |
| 2608 Sailors Way #122 Naples, FL | 2.0 | 2.0 | 1387 | $5,500 | $3.97 | 25d | 1 | 0.68mi |
| 7416 Plumbago Bridge Rd #103 Naples, FL | 2.0 | 2.0 | 1223 | $2,400 | $1.96 | 16d | 1 | 0.74mi |
| 6934 Rain Lily Ct #102 Naples, FL | 2.0 | 2.0 | 1282 | $4,500 | $3.51 | 25d | 1 | 0.81mi |
| 6934 Rain Lily Ct #103 Naples, FL | 2.0 | 2.0 | 1282 | $5,200 | $4.06 | 25d | 1 | 0.81mi |
| 7518 Silver Trumpet Ln Unit Q102 Naples, FL | 2.0 | 2.0 | 1300 | $2,600 | $2.00 | 16d | 1 | 0.84mi |
| 2651 Citrus Lake Dr Unit D302 Naples, FL | 2.0 | 2.0 | 1250 | $5,000 | $4.00 | 16d | 1 | 0.84mi |
| 2671 Citrus Lake Dr Unit E-303 Naples, FL | 2.0 | 2.0 | 1380 | $3,500 | $2.54 | 16d | 1 | 0.86mi |
| 2671 Citrus Lake Dr Unit E-201 Naples, FL | 3.0 | 2.0 | 1380 | $5,250 | $3.80 | 16d | 1 | 0.86mi |
| 2516 Orchid Bay Dr #203 Naples, FL | 2.0 | 2.0 | 1360 | $4,750 | $3.49 | 25d | 1 | 0.87mi |
| 6816 Satinleaf Rd S #102 Naples, FL | 2.0 | 2.0 | 1282 | $5,000 | $3.90 | 25d | 1 | 0.89mi |
| 2711 Citrus Lake Dr Unit F302 Naples, FL | 2.0 | 2.0 | 1272 | $4,500 | $3.54 | 16d | 1 | 0.90mi |
| 2711 Citrus Lake Dr Unit F305 Naples, FL | 3.0 | 2.0 | 1480 | $5,500 | $3.72 | 16d | 1 | 0.90mi |
| 2585 Old Groves Rd Unit L203 Naples, FL | 2.0 | 2.0 | 1448 | $5,500 | $3.80 | 16d | 1 | 0.91mi |
| 2731 Citrus Lake Dr #202 Naples, FL | 2.0 | 2.0 | 1260 | $2,500 | $1.98 | 16d | 1 | 0.93mi |
| 2864 Mizzen Way Unit Y106 Naples, FL | 2.0 | 2.0 | 1350 | $5,200 | $3.85 | 16d | 1 | 0.98mi |
| 516 Gordonia Rd Naples, FL | 2.0 | 1.0 | 1100 | $3,200 | $2.91 | 25d | 1 | 0.99mi |
| 2885 Citrus Lake Dr Unit N103 Naples, FL | 2.0 | 2.0 | 1249 | $5,250 | $4.20 | 16d | 1 | 1.04mi |
| 2058 Arbour Walk Cir #3322 Naples, FL | 2.0 | 2.0 | 918 | $2,000 | $2.18 | 25d | 1 | 1.11mi |
| 2277 Arbour Walk Cir Naples, FL | 1.0–2.0 | 1.0–2.0 | 937 | $2,540 | $2.71 | 16d | 25 | 1.13mi |
| 9580 Victoria Ln Unit A-202 Naples, FL | 2.0 | 2.0 | 1191 | $1,900 | $1.60 | 16d | 1 | 1.13mi |
| 2728 Tiburon Blvd E Unit A-104 Naples, FL | 2.0 | 2.0 | 1465 | $12,500 | $8.53 | 16d | 1 | 1.13mi |
| 2728 Tiburon Blvd E Unit A-203 Naples, FL | 2.0 | 2.0 | 1465 | $11,000 | $7.51 | 16d | 1 | 1.13mi |
HOA detail condo
- Monthly dues
- $550 · $6,600/yr
- Assessments
- None detected in remarks — confirm with the listing agent.
Listing history 11 events
-
2026-06-21days on market $265,000 Active 17 DOM
-
2026-06-18days on market $265,000 Active 14 DOM
-
2026-06-17days on market $265,000 Active 13 DOM
-
2026-06-16days on market $265,000 Active 12 DOM
-
2026-06-15days on market $265,000 Active 11 DOM
-
2026-06-14days on market $265,000 Active 9 DOM
-
2026-06-10days on market $265,000 Active 6 DOM
-
2026-06-09days on market $265,000 Active 5 DOM
-
2026-06-08days on market $265,000 Active 4 DOM
-
2026-06-07remarks 699-char remark
-
2026-06-07$265,000 Active 3 DOM
ⓘ Source: listings_history table (triggers on properties + properties_extension) + one-shot
backfill from property_details.listing_events for pre-trigger history.
Tax reassessment forecast FL · Resets to sale price
- Current annual tax
- $2,320 · $193/mo
- Projected year-2 tax
- $2,320 · $193/mo
- Expected delta
- $0/yr ($0/mo · 0.0%)
ⓘ Screening estimate from a state-policy table — verify with the county assessor before closing.
Climate risk First Street
- Flood 4/10 Moderate FEMA zone X (shaded) · 13% chance over 30 yrs
- Wildfire 1/10 Low
- Heat 10/10 Extreme 7 d/yr ≥107°F today · 29 d/yr by 30 yrs out
- Wind 10/10 Extreme 99% chance of damaging wind over 30 yrs
- Air quality 2/10 Low 2 unhealthy d/yr today · 2 by 30 yrs out
Nearby sold comps map
Loading sold comps map…
Walkable amenities ~0.75 mi
Loading nearby amenities…
Taxation est. · year 1
- Rental income
- $38,829
- − Mortgage interest
- −$14,844
- − Property taxes
- −$2,320
- − Insurance
- −$1,325
- − Repairs & maintenance
- −$3,106
- − Management
- −$3,106
- − HOA
- −$6,600
- − Depreciation
- −$7,709
- Taxable loss
- −$182
- Est. tax savings @ 24.0%
- +$44
- After-tax cash flow
- $3,797/yr
For passive investors: Depreciation is non-cash, so a rental often shows a tax loss while cash-flowing — sheltering income. Rental losses are passive: they offset passive income freely, and up to $25,000/yr can offset ordinary (W-2) income if you actively participate and your MAGI is under $100k (phasing out to $0 by $150k); unused losses carry forward. On sale, claimed depreciation is recaptured at up to 25%, and gains may owe capital-gains tax (a 1031 exchange can defer both). Figures are a year-1 estimate at your 24.0% rate — not tax advice; consult a CPA.
Schools (NCES district)
- District
- Collier
- NCES district ID
- 1200330
- Math proficiency
- 60% ▼ -4.00%
- Reading proficiency
- 56% ▼ -2.00%
- Median HH income
- $58,275
- Composite
- 50.23/100
- National rank
- #1892
- State rank
- #16 of 73 in FL
Livability — Pelican Marsh
No livability data for this city. (Only ~50 U.S. cities are tracked.)
Census & demographics
- County
- Collier County · 396,295 people
- Metro
- Naples-Marco Island, FL
- Population (ZIP)
- 27,273
- Household income
- $92,259
- Rent vs Own
- Severe rent burden
- 1712.0
Population outlook (Collier County) Hauer SSP2
- Today (2025)
- 420,858 people
- By 2030
- 450,054 · +6.9%
- By 2040
- 502,232 · +19.3%
- By 2050
- 544,932 · +29.5%
- By 2075
- 627,203 · +49.0%
- By 2100
- 659,015 · +56.6%
Race, ethnicity, and origin ACS 2023
- Neighborhood character
- Predominantly White (78%)
- Race & ethnicity
- White 78% Hispanic / Latino 11% Two or more races 9% Black 4% Asian 4%
- Hispanic origin (detail)
- Mexican 1% Puerto Rican 1% Cuban 3%
- Common ancestry
- Romanian 5% Scotch-Irish 3% Lithuanian 2%
- Foreign-born
- 20% · Canada, Jamaica, Vietnam
- Languages at home
- 77% English-only · Spanish 10% Other Indo-European 5% Russian/Polish/Slavic 3%
Political lean MEDSL · Collier
- 2024 margin
- Solid R (+33.1) · D 33.1% · R 66.2%
- 2008→2024 swing
- -10.6pp toward R · 2008: -22.5pp · 2024: -33.1pp
- All cycles
- 2024: R+33.1 2020: R+24.7 2016: R+26.0 2012: R+30.1 2008: R+22.5
Not yet ingested
- Civics
- —
Market trends
- HPI YoY
- ▲ 0.29%
- Current HPI
- 279.357
- Rent YoY
- ▲ 0.92%
- Metro
- Naples-Marco Island, FL
- State GDP YoY
- ▲ 3.28%
- F500 in state
- 36
Industry mix (Fortune 500 HQ in FL)
| Industry | F500 HQs | Revenue |
|---|---|---|
| Industrial Technology | 2 | $29B |
|
||
| Insurance | 2 | $17B |
|
||
| Retail | 1 | $60B |
|
||
| Technology Distribution | 1 | $58B |
|
||
| Homebuilding | 1 | $35B |
|
||
| Technology Manufacturing | 1 | $35B |
|
||
Price history
+330.9% since first listed2 events — show timeline
- 2026-06-04 Listed $265,000 NAPLESMLS
- 1994-10-13 Sold (Public Records) $61,500 Public Records
Property tax history
+7.0%/yrLatest (2025): $2,320 · +6.2% YoY. Source: county tax records.
Cash-flow waterfall
monthlySold comps — $/sqft
last 12 mo · ≤1 miLoading sold comps…