2022 Sabine St · Houston, TX
Flood risk 1/10 · Minimal
- FEMA flood zone
- X (unshaded)
- Chance of flooding over 30 yrs
- 0.0%
- Est. flood insurance / yr
- $507 – $1,088
Fire risk 1/10 · Minimal
- Est. fire insurance / yr
- $1,222 – $2,270
Heat risk 9/10 · Severe
- Hot days now (above 109°F)
- 7 days/yr
- Hot days in 30 yrs
- 24 days/yr
Wind risk 9/10 · Severe
- Chance of severe wind over 30 yrs
- 99.0%
Air-quality risk 3/10 · Minor
- Unhealthy air days now
- 2 days/yr
- Unhealthy air days in 30 yrs
- 3 days/yr
Risk factors via First Street. Map © Google.
Why this score? — see what drove the D+ grade
The composite is a weighted blend of 9 inputs, each scored 0–100. Each bar is that input's sub-score; the figure is the points it added to the 100-point composite (weight × sub-score).
- Cash flow +15.1/30.0
- ARV discount +12.6/15.0
- 1% rule +5.4/10.0
- DSCR +4.6/10.0
- Livability +3.7/5.0
- Schools +2.7/10.0
- Condition / age +2.5/5.0
- Rent growth +2.3/5.0
- Appreciation +0.0/10.0
$439,000
🖨 Deal sheet 📄 Offer letter ✓ Due diligence
Listing remarks
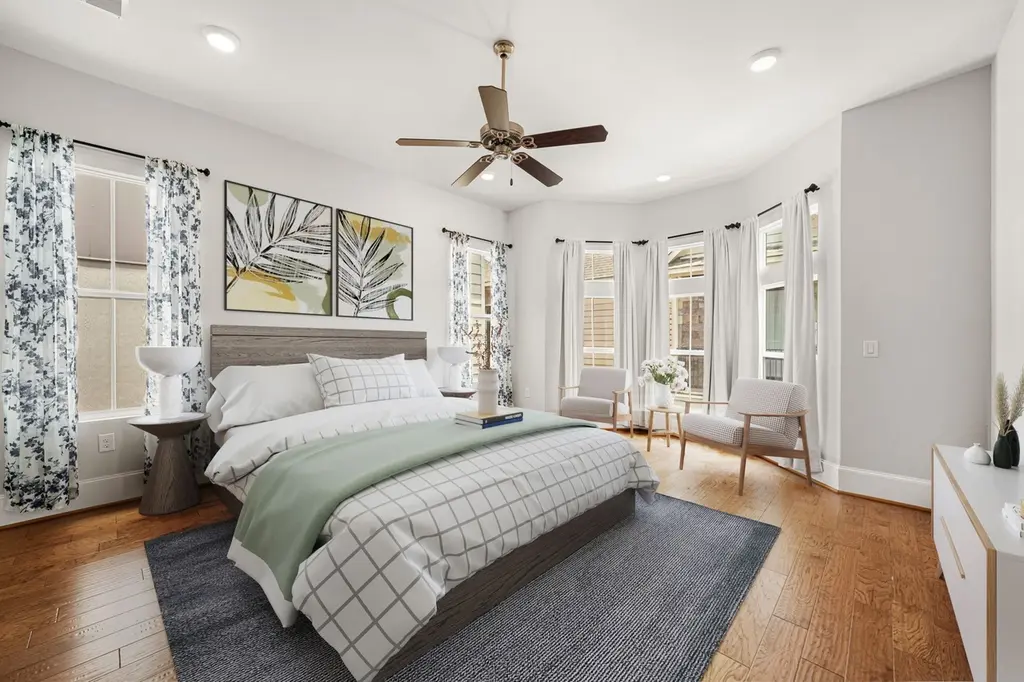
Welcome to your dream home, a multi-story residence offering modern design and luxurious comfort. This stunning property features 3 spacious bedrooms and 3 well-appointed bathrooms. Enter through a grand foyer into an open-concept living area with high ceilings and expansive windows that fill the home with natural light. The living room flows into a gourmet kitchen with granite countertops, stainless steel appliances, and rich wood cabinetry. The primary suite is a true retreat with a large bedroom, spa-like bath with dual vanities and soaking tub, plus an impressive walk-in closet. A dedicated office with large windows is ideal for working from home. Additional highlights include a 2-car g
Key facts
- Spa-like bath
- Hike and bike trails
- Gourmet kitchen
Tags
Property features AI
Finance
- Financial info: Lease considered
- HOA & community: Member of Sabine Square Homeowners Assoc; Gated association; Association fee $1,100 annually
Exterior
- Parking: Attached 2-car garage
- Security: Smoke detector(s); Gated community
- Utilities: Public water; Public sewer
- Home design: Residential property; Built in 2015; Slab foundation; Composition roof; Concrete road surface
- Construction: Cement siding
- Exterior features: Deck; Patio; Subdivision
Interior
- Kitchen: Dishwasher; Gas cooktop; Gas oven; Microwave; Disposal; Granite counters; Walk-in pantry; Kitchen/family room combo; Breakfast bar
- Bedrooms: Primary bedroom on third floor; Bedrooms possible: 3; Additional bedroom on second floor; Bedroom on first floor
- Flooring: Marble; Slate; Stone; Tile; Wood
- Bathrooms: 3 full bathrooms
- Heating & cooling: Central heating (gas); Central electric air conditioning; Programmable thermostat
- Interior features: Wet bar; Dry bar; Breakfast bar; Double vanity; Granite counters; High ceilings; Kitchen/family room combo; Soaking tub; Separate shower; Walk-in pantry; Ceiling fan(s); Programmable thermostat; Low emissivity windows
- Laundry & utility: Washer hookup; Electric dryer hookup; Gas dryer hookup; Washer included; Dryer included
Neighborhood map
What this means for you Summary
Snapshot
- This is a 3-bed/3.0-bath single-family listed at $439k.
Deal economics
- At list price, monthly cash flow is $146 ($2k/yr) — positive.
- The deal already cash-flows at list — no discount required.
- Meets the 1% rule at list price ($5k rent vs $439k).
- Recommended offer: $426k (3.0% below list) — sets the bar for market timing.
- Cap rate 6.7% vs local median 3.2% in Houston — top-decile yield for the area; either an underpriced asset or a hidden risk that comps aren't pricing in. Stress-test before assuming the spread holds.
Location & tenants
- Location reads 74/100 on livability (#184 in TX, #4,771 nationally) — a middle-class / working-renter tenant base. Strengths: amenities A+, cost of living A+, housing A+; Watch: crime F.
- Houston ISD (urban): math 27% / reading 35% proficiency, ranked #593 of 826 in TX (top 72%) — families likely to look elsewhere, expect single-tenant / working-renter base with shorter leases; 71% free/reduced lunch — lower-income household profile, screen leases tightly.
- Zoned schools: Hogg Middle (math 44% / reading 48%, grade D+, #462 of 1,662 statewide, top 28%, 1,120 students, 52% FRL); Heights H S (math 27% / reading 57%, grade F, #730 of 1,632 statewide, top 47%, 2,476 students, 65% FRL).
- Zoned-school proficiency averages 44% at this address vs 31% district-wide (+13 pts) — the actual schools serving this property are materially stronger than the Houston ISD average implies; a family-tenant draw the district grade alone would hide.
- Market conditions: Rents soft (-0.8%/yr); 646 active listings in the ZIP; 36 comparable units currently listed for rent nearby; rentals at typical pace (median 16d on market — plan ~3-4 weeks tenant-placement turnaround); high-income renter base; 29,883 units permitted in Harris County in 2024 (8,621 in 5+ unit buildings).
- This rent runs 38% of the median local income ($145k/yr) — at the standard rent-burdened threshold; future hikes will face affordability resistance.
Forward outlook
- Local home prices are declining (-3.0%/yr); year-one equity from $3k of loan paydown is wiped out by about $13k of value loss. Plan a longer hold.
- Harris County population projected at +47% by 2050 — long-run rental-demand tailwind backs the buy-and-hold thesis.
Negotiation context
- It's been on market 44 days — a 3% lower offer ($426k) is reasonable based on typical stale-listing flexibility.
- 15 sale attempts since 12y ago with the ask held roughly flat each time — persistent listings suggest the price (not the market) is what's stuck; bring a comps-based counter.
Risks & watch-outs
- Climate carrying-cost: severe wind risk, 99% chance of damaging wind over 30y; extreme-heat days projected 7→24/yr by 2055 (HVAC capex compounding) — expect insurance premiums to compound above CPI over the hold.
Questions for the listing agent
- It's been on market 44 days. Have you received any prior offers? Is the seller open to a 3% concession, seller financing, or rate buy-down credit?
- What does the HOA fee cover, when was the last increase, and are there any pending special assessments or reserve-fund shortfalls?
- Is there a deadline driving the sale (1031 exchange, divorce, estate, relocation)? That informs how much negotiation room exists.
- Schools are D-rated, which usually means shorter tenancies and higher turnover. Who's the typical renter profile here, and what's been the actual vacancy rate?
- Crime grade is F in this area — have there been break-ins, vandalism, or insurance claims at this property in the last 3 years? What carrier currently insures it and at what premium?
- The area grade is low — what's the realistic commute time and amenity access for the typical tenant pool here? Any planned neighborhood developments (good or bad) we should know about?
- What's the average days-on-market for RENTAL listings here right now (not sales)? A rising rental-DOM trend means longer vacancies and softer asking-rent achievability than the comps imply.
- What's the recent tenant-quality profile in this submarket — average credit score on applications, eviction rate, late-payment / NSF rate, and stable-employment percentage? A property-management company in the area should have these aggregated.
- How much new for-sale + rental construction is in the pipeline within 1–3 miles? Heavy new supply typically softens prices + rents 12–24 months out; constrained supply supports both.
Investment metrics
- 1% rule
- 1.04% ✓
- Cap rate
- 6.69%
- Cash-on-cash
- 1.43%
- DSCR
- 1.06
- GRM
- 8.0
CMA / ARV
- ARV (median comp)
- $494,597
- List price
- $439,000
- Delta
- -11.24%
- Verdict
- UNDERPRICED
- Comps
- 20 within 1.0 mi
Show comp detail 12 sales within ~0.75 mi
| Address | Dist | Beds/Ba | Sqft | Sold | Price | $/sf | Match |
|---|---|---|---|---|---|---|---|
| 1511 Alamo St | 0.15mi | 3/3.5 | 2,397 (-0%) | 1mo | $499,999 | $209 | 90 |
| 1702 Shearn St | 0.08mi | 3/3.5 | 2,465 (+2%) | 3mo | $549,000 | $223 | 88 |
| 1909 Hickory St | 0.26mi | 3/3.5 | 2,345 (-2%) | 3mo | $419,900 | $179 | 79 |
| 1817 Crockett St Unit C | 0.16mi | 3/3.5 | 2,132 (-11%) | 3mo | $497,000 | $233 | 69 |
| 1510 Johnson St | 0.29mi | 3/3.5 | 2,160 (-10%) | 2mo | $475,000 | $220 | 66 |
| 1819 Dart St | 0.43mi | 3/3.5 | 2,198 (-9%) | 2mo | $449,000 | $204 | 62 |
| 518 Byrne St | 0.61mi | 4/2.5 (+1) | 2,344 (-2%) | 2mo | $1,220,000 | $520 | 59 |
| 414 Woodland St | 0.70mi | 3/2.0 | 2,365 (-2%) | 3mo | $1,100,000 | $465 | 58 |
| 1211 Hickory St Unit D | 0.50mi | 3/3.5 | 2,099 (-13%) | 1mo | $465,000 | $222 | 53 |
| 823 Sledge St | 0.56mi | 3/2.0 | 2,098 (-13%) | 3mo | $950,000 | $453 | 46 |
| 3012 Beauchamp St | 0.71mi | 3/4.0 | 2,704 (+12%) | 1mo | $1,195,000 | $442 | 41 |
| 1810 Kane St | 0.63mi | 4/2.5 (+1) | 2,050 (-15%) | 2mo | $825,000 | $402 | 37 |
Match score weights: distance 35% · size 25% · config 20% · recency 20%. Top-matched comps best support the ARV.
Projected returns pro-forma
-3.0% appreciation · 0.0% rent growth · sell at horizon
- IRR
- -17.9%
- Equity multiple
- 0.39×
- Total profit
- $-74,895
- Equity at exit
- $65,456
- IRR
- -18.5%
- Equity multiple
- 0.16×
- Total profit
- $-103,669
- Equity at exit
- $37,957
Cash invested: $122,920 (down + closing). Projections, not guarantees.
Landlord ↔ Tenant lean methodology
- Overall (STATE)
- 87 Strongly Landlord-Friendly
- State Texas
- 87 Strongly Landlord-Friendly · R+5
- County
- — inherits STATE
- City
- — inherits STATE
ZIP-level market 77007
- Rents YoY
- -0.8%
- Active inventory
- 646
- Price-to-rent
- 8.0×
Monthly cashflow live
- Estimated rent
- $4,574 high interval (Pro) →
- Mortgage (P&I)
- −$2,302
- Tax from tax record
- −$890 /mo · $10,682/yr
- Insurance
- −$183
- HOA
- −$92
- Vacancy / Maint / Mgmt
- −$961
- Net cashflow
- $146
Break-even live
UW: 25.0% down · 7.5% · 30yr · 1.5% tax · 5.0% vac · 8.0% maint · 8.0% mgmt
Financing live
Cash to close
- Down payment
- $109,750
- Closing costs
- $13,170
- Reserves months
- —
- Total cash needed
- —
Loan-product check · same deal, 3 products live
Conventional
25% down · 7.5% · 30yr
- Down + closing
- —
- Monthly P&I
- —
- Monthly cashflow
- —
- DSCR
- —
- Eligible?
- —
Personal DTI + credit; lowest rate.
DSCR
20% down · 8.5% · 30yr
- Down + closing
- —
- Monthly P&I
- —
- Monthly cashflow
- —
- DSCR
- —
- Eligible?
- —
No personal income docs; deal must DSCR.
Hard money
10% down · 12.0% · 12mo
- Down + closing
- —
- Monthly P&I
- —
- Monthly cashflow
- —
- DSCR
- —
- Eligible?
- —
Short-term bridge; refi at stabilization.
Rent comps 36 comps
| Address | Beds | Baths | Sqft | Rent | $/sqft | DOM | Units | Dist |
|---|---|---|---|---|---|---|---|---|
| 2114 Sabine St Houston, TX | 3.0 | 4.0 | 2020 | $3,200 | $1.58 | 43d | 1 | 0.02mi |
| 2114 Sabine St Unit 1257735P Houston, TX | 3.0 | 3.5 | 2594 | $6,588 | $2.54 | 43d | 1 | 0.02mi |
| 1512 Crockett St Unit A Houston, TX | 2.0 | 2.5 | 1808 | $2,800 | $1.55 | 43d | 1 | 0.22mi |
| 2018 Crockett St Unit 1029793P Houston, TX | 3.0 | 3.5 | 2507 | $6,482 | $2.59 | 5d | 1 | 0.23mi |
| 2018 Crockett St Unit 2018 Houston, TX | 3.0 | 3.5 | 2514 | $8,000 | $3.18 | 43d | 1 | 0.23mi |
| 1510 Crockett St Houston, TX | 2.0 | 3.0 | 1912 | $2,800 | $1.46 | 43d | 1 | 0.23mi |
| 410 James St Houston, TX | 3.0 | 2.0 | 1602 | $6,750 | $4.21 | 43d | 1 | 0.77mi |
| 410 James St Unit 1031793P Houston, TX | 3.0 | 2.0 | 1593 | $7,554 | $4.74 | 16d | 1 | 0.77mi |
| 2403 Everett St Unit A Houston, TX | 3.0 | 3.5 | 2093 | $2,800 | $1.34 | 43d | 1 | 0.90mi |
| 1116 Woodland St Houston, TX | 3.0 | 2.0 | 2400 | $4,000 | $1.67 | 43d | 1 | 0.93mi |
| 150 Sabine St Houston, TX | 1.0–2.0 | 1.0–2.0 | 1187 | $2,882 | $2.43 | 3d | 15 | 0.96mi |
| 600 Studemont St Houston, TX | 1.0–2.0 | 1.0–2.5 | 1227 | $2,799 | $2.28 | 3d | 24 | 1.16mi |
| 414 Milam St Unit 2165 Houston, TX | 2.0 | 2.0 | 1585 | $3,868 | $2.44 | 4d | 1 | 1.20mi |
| 414 Milam St Unit 510 Houston, TX | 3.0 | 2.0 | 2421 | $9,230 | $3.81 | 13d | 1 | 1.20mi |
| 414 Milam St Unit 2162 Houston, TX | 2.0 | 2.0 | 1585 | $3,833 | $2.42 | 5d | 1 | 1.20mi |
| 414 Milam St Unit 447 Houston, TX | 3.0 | 2.0 | 2421 | $8,973 | $3.71 | 43d | 1 | 1.20mi |
| 414 Milam St Unit 447 Houston, TX | 3.0 | 2.0 | 2421 | $8,991 | $3.71 | 10d | 1 | 1.20mi |
| 414 Milam St Unit 437 Houston, TX | 2.0 | 2.0 | 1585 | $3,857 | $2.43 | 11d | 1 | 1.20mi |
| 414 Milam St Unit 2148 Houston, TX | 2.0 | 2.0 | 1585 | $3,825 | $2.41 | 2d | 1 | 1.20mi |
| 414 Milam St Unit 422 Houston, TX | 2.0 | 2.0 | 1585 | $3,833 | $2.42 | 7d | 1 | 1.20mi |
| 414 Milam St Unit 3165 Houston, TX | 3.0 | 2.0 | 2421 | $8,959 | $3.70 | 2d | 1 | 1.20mi |
| 414 Milam St Unit 2187 Houston, TX | 2.0 | 2.0 | 1585 | $3,857 | $2.43 | 2d | 1 | 1.20mi |
| 414 Milam St Unit B1-2003 Houston, TX | 2.0 | 2.0 | 1585 | $4,513 | $2.85 | 43d | 1 | 1.20mi |
| 414 Milam St Houston, TX | 2.0 | 2.5 | 1585 | $3,845 | $2.43 | 22d | 1 | 1.20mi |
| 414 Milam St Ph 2-4602 Houston, TX | 2.0 | 2.0 | 2158 | $8,990 | $4.17 | 43d | 1 | 1.20mi |
| 401 Walton St Houston, TX | 3.0 | 2.0 | 2112 | $2,500 | $1.18 | 14d | 1 | 1.26mi |
| 3131 Memorial Ct Houston, TX | 2.0 | 1.0–2.5 | 1336 | $3,418 | $2.56 | 2d | 32 | 1.26mi |
| 909 Texas Ave Houston, TX | 2.0 | 1.0–2.0 | 1262 | $3,129 | $2.48 | 1d | 36 | 1.30mi |
| 225 S Heights Blvd Houston, TX | 3.0 | 1.0–2.0 | 1186 | $3,085 | $2.60 | 2d | 18 | 1.33mi |
| 915 Texas Ave Unit 420 Houston, TX | 3.0 | 2.0 | 2366 | $4,655 | $1.97 | 18d | 1 | 1.35mi |
| 915 Texas Ave Unit 420 Houston, TX | 3.0 | 2.0 | 2366 | $4,655 | $1.97 | 43d | 1 | 1.35mi |
| 2706 Cochran St Houston, TX | 3.0 | 3.5 | 1791 | $2,700 | $1.51 | 19d | 1 | 1.39mi |
| 2121 Allen Pkwy Houston, TX | 1.0–3.0 | 1.0–3.0 | 1207 | $3,085 | $2.55 | 2d | 42 | 1.42mi |
| 710 Stanford St Houston, TX | 3.0 | 4.0 | 2438 | $3,490 | $1.43 | 43d | 1 | 1.42mi |
| 1111 Rusk St Houston, TX | 1.0–2.0 | 1.0–2.5 | 1230 | $2,835 | $2.30 | 1d | 29 | 1.48mi |
| 717 Fannin St Houston, TX | 2.0 | 2.0 | 1700 | $3,800 | $2.24 | 43d | 1 | 1.49mi |
HOA detail
- Monthly dues
- $92 · $1,104/yr
Listing history 50 events
-
2026-06-18days on market $439,000 Active 44 DOM
-
2026-06-17days on market $439,000 Active 43 DOM
-
2026-06-16days on market $439,000 Active 42 DOM
-
2026-06-15days on market $439,000 Active 41 DOM
-
2026-06-13days on market $439,000 Active 39 DOM
-
2026-06-10days on market $439,000 Active 35 DOM
-
2026-06-08days on market $439,000 Active 34 DOM
-
2026-06-07days on market $439,000 Active 33 DOM
-
2026-06-04days on market $439,000 Active 30 DOM
-
2026-06-01days on market $439,000 Active 27 DOM
-
2026-05-31days on market $439,000 Active 26 DOM
-
2026-05-05$449,000 Active 980-char remark
-
2026-05-05historical
-
2026-03-22price $449,000
-
2026-03-09price $459,000
-
2026-02-24historical $2,900
-
2026-02-24price $465,000
-
2026-02-14price $2,900
-
2026-02-11price $485,000
-
2026-01-19$489,000 Active
-
2025-12-29$3,000
-
2025-12-28historical $3,200
-
2025-11-06$3,200
-
2025-10-01historical
-
2025-09-09historical $3,200
-
2025-08-12$3,200
-
2025-07-21price $489,000
-
2025-06-07$499,000 Active
-
2021-05-18soldstatus
-
2020-06-02soldstatus
-
2019-09-02historical
-
2019-08-16price $365,000
-
2019-07-18status Active
-
2019-07-08historical
-
2019-06-23price $389,000
-
2019-05-22status Active
-
2019-05-13historical
-
2019-05-10price $399,000
-
2019-03-28price $409,000
-
2019-03-19$419,000 Active
-
2018-02-16historical
-
2018-01-16price $395,000
-
2017-12-13$404,900 Active
-
2017-11-12historical
-
2017-06-12$409,900 Active
-
2017-06-01historical
-
2017-02-13status Active
-
2017-01-28historical
-
2017-01-15price $419,900
-
2017-01-02$423,900 Active
ⓘ Source: listings_history table (triggers on properties + properties_extension) + one-shot
backfill from property_details.listing_events for pre-trigger history.
Tax reassessment forecast TX · Resets to sale price
- Current annual tax
- $10,682 · $890/mo
- Projected year-2 tax
- $10,682 · $890/mo
- Expected delta
- $0/yr ($0/mo · 0.0%)
ⓘ Screening estimate from a state-policy table — verify with the county assessor before closing.
Climate risk First Street
- Flood 1/10 Low FEMA zone X (unshaded) · 0% chance over 30 yrs
- Wildfire 1/10 Low
- Heat 9/10 Extreme 7 d/yr ≥109°F today · 24 d/yr by 30 yrs out
- Wind 9/10 Extreme 99% chance of damaging wind over 30 yrs
- Air quality 3/10 Moderate 2 unhealthy d/yr today · 3 by 30 yrs out
Nearby sold comps map
Loading sold comps map…
Walkable amenities ~0.75 mi
Loading nearby amenities…
Taxation est. · year 1
- Rental income
- $54,888
- − Mortgage interest
- −$24,591
- − Property taxes
- −$10,682
- − Insurance
- −$2,195
- − Repairs & maintenance
- −$4,391
- − Management
- −$4,391
- − HOA
- −$1,104
- − Depreciation
- −$12,771
- Taxable loss
- −$5,237
- Est. tax savings @ 24.0%
- +$1,257
- After-tax cash flow
- $3,011/yr
For passive investors: Depreciation is non-cash, so a rental often shows a tax loss while cash-flowing — sheltering income. Rental losses are passive: they offset passive income freely, and up to $25,000/yr can offset ordinary (W-2) income if you actively participate and your MAGI is under $100k (phasing out to $0 by $150k); unused losses carry forward. On sale, claimed depreciation is recaptured at up to 25%, and gains may owe capital-gains tax (a 1031 exchange can defer both). Figures are a year-1 estimate at your 24.0% rate — not tax advice; consult a CPA.
Schools (NCES district)
- District
- Houston ISD
- NCES district ID
- 4823640
- Math proficiency
- 27% ▼ -18.00%
- Reading proficiency
- 35% ▼ -6.00%
- Median HH income
- $46,054
- Composite
- 26.63/100
- National rank
- #7173
- State rank
- #593 of 826 in TX
Livability — Houston
- Score
- 74/100
- State rank
- #184
- US rank
- #4771
Category grades
Schools grade is shown separately in the Schools card above.
Census & demographics
- Census place
- Houston, TX
- County
- Harris County · 4,702,590 people
- City population
- 3,226,434
- Metro
- Houston-The Woodlands-Sugar Land, TX
- Population (ZIP)
- 47,808
- Household income
- $144,911
- Rent vs Own
- Severe rent burden
- 1812.0
Population outlook (Harris County) Hauer SSP2
- Today (2025)
- 5,571,493 people
- By 2030
- 6,089,821 · +9.3%
- By 2040
- 7,142,806 · +28.2%
- By 2050
- 8,185,864 · +46.9%
- By 2075
- 10,574,329 · +89.8%
- By 2100
- 12,109,958 · +117.4%
Race, ethnicity, and origin ACS 2023
- Neighborhood character
- Diverse neighborhood (Simpson 0.63)
- Race & ethnicity
- White 57% Hispanic / Latino 17% Two or more races 13% Asian 11% Black 9%
- Hispanic origin (detail)
- Mexican 12%
- Common ancestry
- Slovak 3% Romanian 3% Italian 3%
- Foreign-born
- 19% · Canada, China, South Korea
- Languages at home
- 75% English-only · Spanish 12% Other Indo-European 4% Chinese 2%
Political lean MEDSL · Harris
- 2024 margin
- Lean D (+5.5) · D 52.0% · R 46.4% · Other 1.6%
- 2008→2024 swing
- +3.9pp toward D · 2008: 1.6pp · 2024: 5.5pp
- All cycles
- 2024: D+5.5 2020: D+13.3 2016: D+12.4 2012: D+0.1 2008: D+1.6
Not yet ingested
- Civics
- —
Market trends
- HPI YoY
- ▼ -219.42%
- Current HPI
- 159.8157
- Rent YoY
- ▼ -0.83%
- Metro
- Houston-The Woodlands-Sugar Land, TX
- State GDP YoY
- ▲ 3.95%
- F500 in state
- 110
Industry mix (Fortune 500 HQ in TX)
| Industry | F500 HQs | Revenue |
|---|---|---|
| Energy | 16 | $1,198B |
|
||
| Technology | 5 | $198B |
|
||
| Engineering / Construction | 4 | $72B |
|
||
| Energy Services | 3 | $60B |
|
||
| Utilities | 3 | $41B |
|
||
| Healthcare | 2 | $330B |
|
||
Price history
+2.1% since first listed44 events — show timeline
- 2026-05-27 Price Changed $439,000 HARMLS
- 2026-05-05 Listing Removed — HARMLS
- 2026-05-05 Listed $449,000 HARMLS
- 2026-03-22 Price Changed $449,000 HARMLS
- 2026-03-09 Price Changed $459,000 HARMLS
- 2026-02-24 Rental Removed $2,900 HARMLS
- 2026-02-24 Price Changed $465,000 HARMLS
- 2026-02-14 Price Changed $2,900 HARMLS
- 2026-02-11 Price Changed $485,000 HARMLS
- 2026-01-19 Listed $489,000 HARMLS
- 2025-12-29 Listed for Rent $3,000 HARMLS
- 2025-12-28 Rental Removed $3,200 HARMLS
- 2025-11-06 Listed for Rent $3,200 HARMLS
- 2025-10-01 Listing Removed — HARMLS
- 2025-09-09 Rental Removed $3,200 HARMLS
- 2025-08-12 Listed for Rent $3,200 HARMLS
- 2025-07-21 Price Changed $489,000 HARMLS
- 2025-06-07 Listed $499,000 HARMLS
- 2021-05-18 Sold (Public Records) — Public Records
- 2020-06-02 Sold (Public Records) — Public Records
- 2019-09-02 Listing Removed — HARMLS
- 2019-08-16 Price Changed $365,000 HARMLS
- 2019-07-18 Relisted — HARMLS
- 2019-07-08 Listing Removed — HARMLS
- 2019-06-23 Price Changed $389,000 HARMLS
- 2019-05-22 Relisted — HARMLS
- 2019-05-13 Listing Removed — HARMLS
- 2019-05-10 Price Changed $399,000 HARMLS
- 2019-03-28 Price Changed $409,000 HARMLS
- 2019-03-19 Listed $419,000 HARMLS
- 2018-02-16 Listing Removed — HARMLS
- 2018-01-16 Price Changed $395,000 HARMLS
- 2017-12-13 Listed $404,900 HARMLS
- 2017-11-12 Listing Removed — HARMLS
- 2017-06-12 Listed $409,900 HARMLS
- 2017-06-01 Listing Removed — HARMLS
- 2017-02-13 Relisted — HARMLS
- 2017-01-28 Listing Removed — HARMLS
- 2017-01-15 Price Changed $419,900 HARMLS
- 2017-01-02 Listed $423,900 HARMLS
- 2015-05-21 Listing Removed — HARMLS
- 2015-05-18 Relisted — HARMLS
- 2014-10-28 Listing Removed — HARMLS
- 2014-05-16 Listed $429,900 HARMLS
Property tax history
+12.0%/yrLatest (2025): $10,682 · +1.6% YoY. Source: county tax records.
Cash-flow waterfall
monthlySold comps — $/sqft
last 12 mo · ≤1 miLoading sold comps…