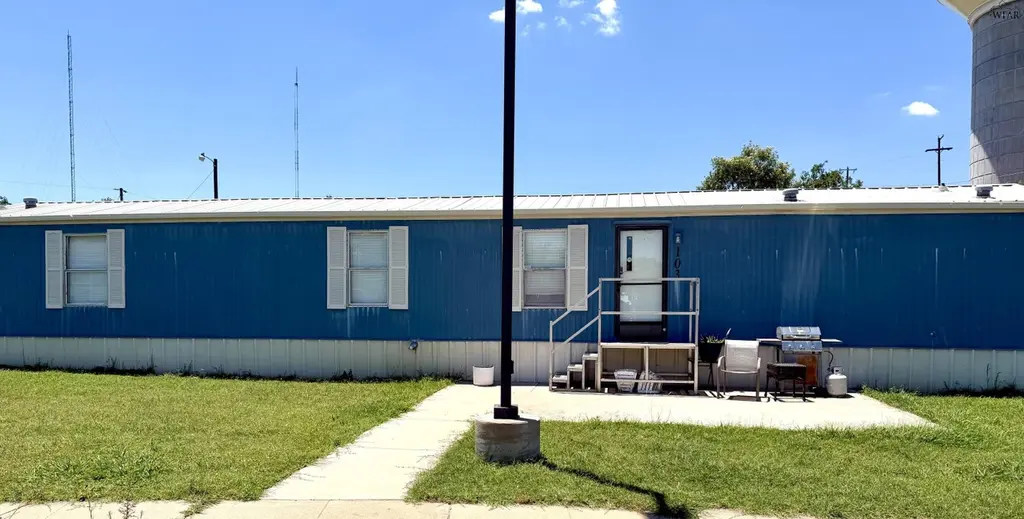
103 Kitchings St · Wichita Falls, TX
Flood risk 7/10 · Major
- FEMA flood zone
- X (unshaded)
- Chance of flooding over 30 yrs
- 0.77%
- Est. flood insurance / yr
- $507 – $1,088
Fire risk 6/10 · Moderate
- Est. fire insurance / yr
- $1,222 – $2,270
Heat risk 7/10 · Major
- Hot days now (above 109°F)
- 7 days/yr
- Hot days in 30 yrs
- 20 days/yr
Wind risk 4/10 · Minor
- Chance of severe wind over 30 yrs
- 8.0%
Air-quality risk 1/10 · Minimal
- Unhealthy air days now
- 0 days/yr
- Unhealthy air days in 30 yrs
- 0 days/yr
Risk factors via First Street. Map © Google.
Why this score? — see what drove the B grade
The composite is a weighted blend of 9 inputs, each scored 0–100. Each bar is that input's sub-score; the figure is the points it added to the 100-point composite (weight × sub-score).
- Cash flow +30.0/30.0
- 1% rule +10.0/10.0
- DSCR +10.0/10.0
- ARV discount +7.5/15.0
- Rent growth +3.8/5.0
- Condition / age +3.8/5.0
- Livability +3.5/5.0
- Schools +2.7/10.0
- Appreciation +0.0/10.0
$39,900
🖨 Deal sheet 📄 Offer letter ✓ Due diligence
Listing remarks
Welcome to the cottage house! This has been an Airbnb on a leased lot, but now it is available for sale, and you get to keep all of the wonderful contents in the home. These include the washer, dryer, refrigerator, beds, living and dining room furniture. .. you even get to keep the forks and spoons!! It is a 2-bedroom, 2-bath home with 1216 sq feet. All you need to do is move in. Call for a showing today!
Key facts
- Built 1997
- Listed 15 days
Property features AI
Exterior
- Utilities: Septic tank; Public sewer
- Home design: Residential mobile home; Single-story
- Exterior features: Located on a cul-de-sac; Metal roof
Interior
- Kitchen: Dishwasher; Disposal; Electric oven; Microwave; Refrigerator
- Flooring: Laminate
- Heating & cooling: Central heating; Electric heating; Central air conditioning
- Interior features: Walk-in closet(s); Breakfast bar
Neighborhood map
What this means for you Summary
Snapshot
- This is a 2-bed/2.0-bath manufactured listed at $40k. Condition is rated good.
Deal economics
- At list price, monthly cash flow is $459 ($6k/yr) — positive.
- The deal already cash-flows at list — no discount required.
- Meets the 1% rule at list price ($1k rent vs $40k).
- Recommended offer: $39k (1.5% below list) — sets the bar for market timing.
- Cap rate 22.1% vs local median 4.7% in Wichita Falls — top-decile yield for the area; either an underpriced asset or a hidden risk that comps aren't pricing in. Stress-test before assuming the spread holds.
Location & tenants
- Location reads 69/100 on livability (#437 in TX) — a middle-class / working-renter tenant base. Strengths: cost of living A+, housing A+; Watch: health & safety C-, employment D+, schools D.
- Wichita Falls ISD (urban): math 31% / reading 33% proficiency, ranked #585 of 826 in TX (top 71%) — families likely to look elsewhere, expect single-tenant / working-renter base with shorter leases.
- Market conditions: Rents rising fast (+5.3%/yr); 133 active listings in the ZIP; 22 comparable units currently listed for rent nearby; rentals lingering (median 44d on market — plan ~5-8 weeks vacancy on turnover, expect pricing pressure); 100% of comp listings sitting > 30 days — soft ceiling on asking rent; lower-income renter base — watch delinquency; 231 units permitted in Wichita County in 2024 (10 in 5+ unit buildings).
Forward outlook
- Local home prices are declining (-3.0%/yr); year-one equity from $276 of loan paydown is wiped out by about $1k of value loss. Plan a longer hold.
- Wichita County population projected to shrink 7% by 2050 — rents likely to lag national; underwrite the cash flow, not the appreciation.
- At projected returns (-3.0% appreciation + 5.3% rent growth), your $11k cash investment doubles in ~3 years — after that, you're playing with house money.
Negotiation context
- It's been on market 16 days — a 2% lower offer ($39k) is reasonable based on typical stale-listing flexibility.
Risks & watch-outs
- Watch-outs: flood insurance adds $66/mo.
- Climate carrying-cost: major flood risk; major wildfire risk; extreme-heat days projected 7→20/yr by 2055 (HVAC capex compounding) — expect insurance premiums to compound above CPI over the hold.
Questions for the listing agent
- What's the actual annual flood-insurance premium (NFIP or private), and is the property in a SFHA with mandatory coverage?
- Is there a deadline driving the sale (1031 exchange, divorce, estate, relocation)? That informs how much negotiation room exists.
- Schools are D-rated, which usually means shorter tenancies and higher turnover. Who's the typical renter profile here, and what's been the actual vacancy rate?
- Crime grade is D in this area — have there been break-ins, vandalism, or insurance claims at this property in the last 3 years? What carrier currently insures it and at what premium?
- What's the average days-on-market for RENTAL listings here right now (not sales)? A rising rental-DOM trend means longer vacancies and softer asking-rent achievability than the comps imply.
- What's the recent tenant-quality profile in this submarket — average credit score on applications, eviction rate, late-payment / NSF rate, and stable-employment percentage? A property-management company in the area should have these aggregated.
- How much new for-sale + rental construction is in the pipeline within 1–3 miles? Heavy new supply typically softens prices + rents 12–24 months out; constrained supply supports both.
Investment metrics
- 1% rule
- 2.54% ✓
- Cap rate
- 22.10%
- Cash-on-cash
- 56.46%
- DSCR
- 3.51
- GRM
- 3.3
CMA / ARV
No comps found within radius.
Projected returns pro-forma
-3.0% appreciation · 5.27% rent growth · sell at horizon
- IRR
- 49.8%
- Equity multiple
- 3.26×
- Total profit
- $25,203
- Equity at exit
- $5,949
- IRR
- 56.3%
- Equity multiple
- 7.27×
- Total profit
- $70,013
- Equity at exit
- $3,450
Cash invested: $11,172 (down + closing). Projections, not guarantees.
Landlord ↔ Tenant lean methodology
- Overall (STATE)
- 87 Strongly Landlord-Friendly
- State Texas
- 87 Strongly Landlord-Friendly · R+5
- County
- — inherits STATE
- City
- — inherits STATE
ZIP-level market 76301
- Home prices YoY
- -34.1%
- Rents YoY
- 5.3%
- Active inventory
- 133
- Price-to-rent
- 3.3×
Monthly cashflow live
- Estimated rent
- $1,014 high interval (Pro) →
- Mortgage (P&I)
- −$209
- Tax est. 1.5%
- −$50 /mo · $598/yr
- Insurance
- −$17
- Flood insurance flood zone
- −$66 /mo · $798/yr
- HOA
- −$0
- Vacancy / Maint / Mgmt
- −$213
- Net cashflow
- $459
Break-even live
UW: 25.0% down · 7.5% · 30yr · 1.5% tax · 5.0% vac · 8.0% maint · 8.0% mgmt
Financing live
Cash to close
- Down payment
- $9,975
- Closing costs
- $1,197
- Reserves months
- —
- Total cash needed
- —
Loan-product check · same deal, 3 products live
Conventional
25% down · 7.5% · 30yr
- Down + closing
- —
- Monthly P&I
- —
- Monthly cashflow
- —
- DSCR
- —
- Eligible?
- —
Personal DTI + credit; lowest rate.
DSCR
20% down · 8.5% · 30yr
- Down + closing
- —
- Monthly P&I
- —
- Monthly cashflow
- —
- DSCR
- —
- Eligible?
- —
No personal income docs; deal must DSCR.
Hard money
10% down · 12.0% · 12mo
- Down + closing
- —
- Monthly P&I
- —
- Monthly cashflow
- —
- DSCR
- —
- Eligible?
- —
Short-term bridge; refi at stabilization.
Rent comps 22 comps
| Address | Beds | Baths | Sqft | Rent | $/sqft | DOM | Units | Dist |
|---|---|---|---|---|---|---|---|---|
| 1901 Wenonah Ave Unit B Wichita Falls, TX | 2.0 | 1.0 | 946 | $1,000 | $1.06 | 43d | 1 | 0.55mi |
| 504 Fillmore St Wichita Falls, TX | 1.0–2.0 | 1.0 | 734 | $895 | $1.22 | 43d | 6 | 0.67mi |
| 1515 Fillmore St Wichita Falls, TX | 3.0 | 2.0 | 909 | $1,225 | $1.35 | 43d | 1 | 0.68mi |
| 2003 Buchanan St Wichita Falls, TX | 3.0 | 2.0 | 1118 | $1,100 | $0.98 | 43d | 1 | 0.77mi |
| 1507 Polk St Wichita Falls, TX | 3.0 | 1.0 | 1316 | $1,050 | $0.80 | 43d | 1 | 0.82mi |
| 2912 Avenue L Unit L Wichita Falls, TX | 2.0 | 1.0 | 1104 | $895 | $0.81 | 43d | 1 | 0.83mi |
| 2204 Tilden St Unit A Wichita Falls, TX | 3.0 | 2.0 | 872 | $930 | $1.07 | 43d | 1 | 0.87mi |
| 1813 Polk St Wichita Falls, TX | 3.0 | 2.0 | 1090 | $1,364 | $1.25 | 43d | 1 | 0.91mi |
| 1301 Giddings St Wichita Falls, TX | 3.0 | 1.0 | 1000 | $1,150 | $1.15 | 43d | 1 | 0.96mi |
| 2304 Avenue K Wichita Falls, TX | 3.0 | 2.0 | 1040 | $1,050 | $1.01 | 43d | 1 | 0.99mi |
| 2007 10th St Unit B Wichita Falls, TX | 1.0 | 1.0 | 744 | $750 | $1.01 | 43d | 1 | 1.04mi |
| 1916 7th St Wichita Falls, TX | 2.0 | 1.0 | 1226 | $1,050 | $0.86 | 43d | 1 | 1.11mi |
| 3706 Seymour Rd Wichita Falls, TX | 1.0–3.0 | 1.0–2.5 | 1100 | $1,188 | $1.08 | 43d | 13 | 1.14mi |
| 2500 Taylor St Unit 2500 Taylor A Wichita Falls, TX | 2.0 | 1.0 | 910 | $800 | $0.88 | 43d | 1 | 1.20mi |
| 2006 Bell St Wichita Falls, TX | 3.0 | 1.0 | 1120 | $1,000 | $0.89 | 43d | 1 | 1.20mi |
| 1901 Giddings St Wichita Falls, TX | 3.0 | 2.0 | 909 | $1,175 | $1.29 | 43d | 1 | 1.20mi |
| 1821 9th St Unit B Wichita Falls, TX | 2.0 | 1.0 | 1200 | $795 | $0.66 | 43d | 1 | 1.22mi |
| 2130 Avenue K Wichita Falls, TX | 3.0 | 2.0 | 1090 | $1,390 | $1.28 | 43d | 1 | 1.24mi |
| 1810 7th St Unit 1/2 Wichita Falls, TX | 2.0 | 1.0 | 806 | $775 | $0.96 | 43d | 1 | 1.28mi |
| 1824 Collins Ave Wichita Falls, TX | 1.0 | 1.0 | 750 | $795 | $1.06 | 43d | 1 | 1.30mi |
| 2812 Avenue R Unit R Wichita Falls, TX | 2.0 | 1.0 | 1044 | $925 | $0.89 | 43d | 1 | 1.31mi |
| 1714 7th St Wichita Falls, TX | 3.0 | 1.0 | 1452 | $850 | $0.59 | 43d | 1 | 1.39mi |
Listing history 13 events
-
2026-06-19days on market $39,900 Active 16 DOM
-
2026-06-18days on market $39,900 Active 15 DOM
-
2026-06-17days on market $39,900 Active 14 DOM
-
2026-06-16days on market $39,900 Active 13 DOM
-
2026-06-15days on market $39,900 Active 12 DOM
-
2026-06-14days on market $39,900 Active 10 DOM
-
2026-06-13days on market $39,900 Active 9 DOM
-
2026-06-10days on market $39,900 Active 7 DOM
-
2026-06-09days on market $39,900 Active 6 DOM
-
2026-06-08days on market $39,900 Active 5 DOM
-
2026-06-07days on market $39,900 Active 4 DOM
-
2026-06-05remarks 409-char remark
-
2026-06-05$39,900 Active 1 DOM
ⓘ Source: listings_history table (triggers on properties + properties_extension) + one-shot
backfill from property_details.listing_events for pre-trigger history.
Climate risk First Street
- Flood 7/10 Severe FEMA zone X (unshaded) · 77% chance over 30 yrs
- Wildfire 6/10 Major
- Heat 7/10 Severe 7 d/yr ≥109°F today · 20 d/yr by 30 yrs out
- Wind 4/10 Moderate 8% chance of damaging wind over 30 yrs
- Air quality 1/10 Low 0 unhealthy d/yr today · 0 by 30 yrs out
Nearby sold comps map
Loading sold comps map…
Walkable amenities ~0.75 mi
Loading nearby amenities…
Taxation est. · year 1
- Rental income
- $12,172
- − Mortgage interest
- −$2,235
- − Property taxes
- −$598
- − Insurance
- −$997
- − Repairs & maintenance
- −$974
- − Management
- −$974
- − Depreciation
- −$1,161
- Taxable income
- $5,233
- Est. tax owed @ 24.0%
- −$1,256
- After-tax cash flow
- $4,254/yr
For passive investors: Depreciation is non-cash, so a rental often shows a tax loss while cash-flowing — sheltering income. Rental losses are passive: they offset passive income freely, and up to $25,000/yr can offset ordinary (W-2) income if you actively participate and your MAGI is under $100k (phasing out to $0 by $150k); unused losses carry forward. On sale, claimed depreciation is recaptured at up to 25%, and gains may owe capital-gains tax (a 1031 exchange can defer both). Figures are a year-1 estimate at your 24.0% rate — not tax advice; consult a CPA.
Condition & rehab AI · 13 photos
This 2-bedroom, 2-bath manufactured home is in good condition with cosmetic updates needed. It's move-in ready and has a good resale and rental potential.
Value-add opportunities
- Both Paint exterior siding — Enhances curb appeal and can increase both resale and rental value.
- Both Clean and organize interior — Creates a more inviting and professional appearance, which can increase both resale and rental value.
Renovation cost estimate screening
Value-add ROI direction
- Both Paint exterior siding — Enhances curb appeal and can increase both resale and rental value. ↑
- Both Clean and organize interior — Creates a more inviting and professional appearance, which can increase both resale and rental value. ↑
ⓘ Cost ranges are severity-bucket heuristics (US national rule-of-thumb). Get contractor quotes + a written scope before underwriting a rehab budget.
Schools (NCES district)
- District
- Wichita Falls ISD
- NCES district ID
- 4845780
- Math proficiency
- 31% ▼ -10.00%
- Reading proficiency
- 33% ▼ -7.00%
- Median HH income
- $41,604
- Composite
- 27.06/100
- National rank
- #7051
- State rank
- #585 of 826 in TX
Livability — Wichita Falls
- Score
- 69/100
- State rank
- #437
- US rank
- #8940
Category grades
Schools grade is shown separately in the Schools card above.
Census & demographics
- Census place
- Wichita Falls, TX
- County
- Wichita County · 95,694 people
- City population
- 95,694
- Metro
- Wichita Falls, TX
- Population (ZIP)
- 15,479
- Household income
- $41,947
- Rent vs Own
- Severe rent burden
- 577.0
Population outlook (Wichita County) Hauer SSP2
- Today (2025)
- 129,638 people
- By 2030
- 128,366 · -1.0%
- By 2040
- 124,466 · -4.0%
- By 2050
- 120,499 · -7.0%
- By 2075
- 113,884 · -12.2%
- By 2100
- 101,818 · -21.5%
Race, ethnicity, and origin ACS 2023
- Neighborhood character
- Diverse neighborhood (Simpson 0.67)
- Race & ethnicity
- White 40% Hispanic / Latino 38% Black 18% Two or more races 15% Asian 1%
- Hispanic origin (detail)
- Mexican 36%
- Common ancestry
- Slovak 3% Lithuanian 2% Italian 1%
- Foreign-born
- 11% · Canada, Vietnam
- Languages at home
- 76% English-only · Spanish 22%
Political lean MEDSL · Wichita
- 2024 margin
- Solid R (+44.0) · D 27.5% · R 71.5%
- 2008→2024 swing
- -5.2pp toward R · 2008: -38.9pp · 2024: -44.0pp
- All cycles
- 2024: R+44.0 2020: R+41.1 2016: R+49.7 2012: R+47.1 2008: R+38.9
Not yet ingested
- Civics
- —
Market trends
- HPI YoY
- ▼ -69.89%
- Current HPI
- 135.1511
- Rent YoY
- ▲ 5.27%
- Metro
- Wichita Falls, TX
- State GDP YoY
- ▲ 3.95%
- F500 in state
- 110
Industry mix (Fortune 500 HQ in TX)
| Industry | F500 HQs | Revenue |
|---|---|---|
| Energy | 16 | $1,198B |
|
||
| Technology | 5 | $198B |
|
||
| Engineering / Construction | 4 | $72B |
|
||
| Energy Services | 3 | $60B |
|
||
| Utilities | 3 | $41B |
|
||
| Healthcare | 2 | $330B |
|
||
Price history
1 event — show timeline
- 2026-06-03 Listed $39,900 WFAOR
Cash-flow waterfall
monthlySold comps — $/sqft
last 12 mo · ≤1 miLoading sold comps…