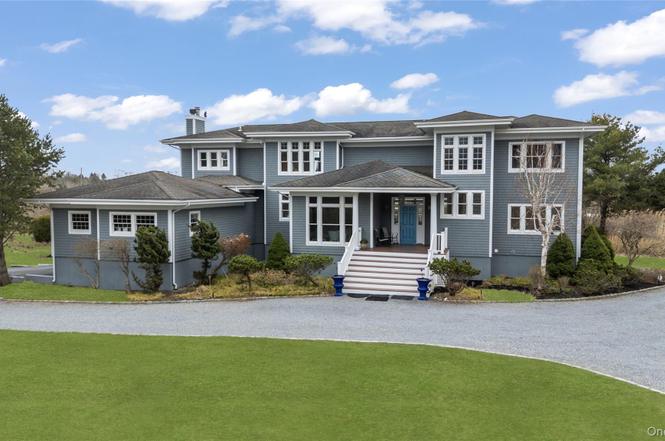
14 S Country Rd · Westhampton, NY
Flood risk 6/10 · Moderate
- FEMA flood zone
- X (shaded)
- Chance of flooding over 30 yrs
- 0.56%
- Est. flood insurance / yr
- $473 – $860
Fire risk 1/10 · Minimal
- Est. fire insurance / yr
- $691 – $1,283
Heat risk 4/10 · Minor
- Hot days now (above 90°F)
- 7 days/yr
- Hot days in 30 yrs
- 18 days/yr
Wind risk 8/10 · Major
- Chance of severe wind over 30 yrs
- 80.0%
Air-quality risk 4/10 · Minor
- Unhealthy air days now
- 4 days/yr
- Unhealthy air days in 30 yrs
- 5 days/yr
Risk factors via First Street. Map © Google.
Why this score? — see what drove the B- grade
The composite is a weighted blend of 9 inputs, each scored 0–100. Each bar is that input's sub-score; the figure is the points it added to the 100-point composite (weight × sub-score).
- Cash flow +19.6/30.0
- ARV discount +15.0/15.0
- Appreciation +9.4/10.0
- Schools +6.6/10.0
- DSCR +6.2/10.0
- 1% rule +4.2/10.0
- Livability +3.0/5.0
- Rent growth +2.5/5.0
- Condition / age +2.5/5.0
$2,395,000
🖨 Deal sheet 📄 Offer letter ✓ Due diligence
Listing remarks
Welcome to 14 S Country Road, Westhampton Beach—an exceptional Hamptons retreat set on 1.05 private acres with waterfront access to Tanners Neck Creek and sweeping panoramic views across Moriches Bay toward Dune Road. Bordering a peaceful nature preserve, this beautifully designed 5-bedroom, 3.5-bath residence offers 3,659 sqft of light-filled living space with soaring 10-foot ceilings and expansive windows showcasing water views from nearly every room. Perfectly suited as a luxurious year-round residence, Hamptons getaway, or highly desirable summer rental investment property, the home captures breathtaking sunrise and sunset views in a truly tranquil setting. This property has easy
Key facts
- 1.05 acre lot
- 2 garage spots
- Built 2004
Property features AI
Exterior
- Parking: Private parking for 6 vehicles; 2.5-car garage; Has garage
- Security: Security system; Smoke detectors; Video cameras
- Utilities: Electricity connected (PSEG); Water connected; Septic tank; Trash collection (private)
- Home design: Single family residence; Three or more levels; Actual property condition
- Construction: Frame construction; Concrete perimeter foundation; Waterfront property
- Exterior features: Balcony; Juliet balcony; Basketball hoop; Exterior lighting; Mailbox; Rain gutters; Partial fencing; Shed(s); Waterfront; Back yard; Front yard; Cleared and landscaped grounds; Level lot; Private setting; Sprinklers in front and rear; Near shops; Views
Interior
- Kitchen: Chef's kitchen with kitchen island; Gas cooktop; Gas oven; Gas range; Oven; Microwave; Dishwasher; Refrigerator; Stainless steel appliances; Freezer; Wine refrigerator; Pantry; Eat-in kitchen
- Bedrooms: Includes a first-floor bedroom
- Flooring: Hardwood floors
- Bathrooms: Three full bathrooms; One half bathroom; Primary bathroom with double vanity and soaking tub
- Heating & cooling: Central air conditioning; Forced air heating; Solar heating
- Interior features: First-floor bedroom; First-floor full bathroom; Built-in features; Central vacuum; Chandelier; Chef's kitchen; Crown molding; Double vanity; Eat-in kitchen; Entrance foyer; High ceilings; Kitchen island; Open floorplan; Open kitchen; Pantry; Primary bathroom; Quartz/Quartzite counters; Recessed lighting; Soaking tub; Speakers; Storage; Tray ceilings; Walk-through kitchen; Walk-in closets; Wired for sound; Double pane windows; ENERGY STAR qualified windows; Insulated windows; Oversized windows; Window screens; Deck, terrace and wrap-around porch
- Laundry & utility: Laundry room; Washer; Dryer; Dehumidifier
Neighborhood map
What this means for you Summary
Snapshot
- This is a 4-bed/3.5-bath single-family listed at $2.40M.
Deal economics
- At list price, monthly cash flow is $3k ($33k/yr) — positive.
- The deal already cash-flows at list — no discount required.
- To meet the 1% rule (rent ≥ 1% of price), the offer needs to be $2.19M (8.4% below list).
- Recommended offer: $2.19M (8.4% below list) — sets the bar for 1% rule.
Location & tenants
- Location reads 60/100 on livability (#969 in NY) — a middle-class / working-renter tenant base. Strengths: crime A+, employment A+; Watch: housing C-, amenities F, commute F.
- Westhampton Beach Union Free School District (suburban): math 72% / reading 75% proficiency, ranked #81 of 590 in NY (top 14%) — strong family-tenant draw, lease renewals of 3-5y typical.
- Zoned schools: Westhampton Beach Elementary School (math 67% / reading 67%, grade B+, #525 of 2,108 statewide, top 27%, 356 students, 43% FRL); Westhampton Middle School (math 61% / reading 63%, grade B+, #136 of 729 statewide, top 20%, 434 students, 26% FRL); Westhampton Beach Senior High School (math 90% / reading 96%, grade A+, #147 of 1,100 statewide, top 14%, 964 students, 24% FRL).
- Market conditions: 63 active listings in the ZIP; 11 comparable units currently listed for rent nearby; rentals at typical pace (median 19d on market — plan ~3-4 weeks tenant-placement turnaround); high-income renter base; 1,366 units permitted in Suffolk County in 2024 (216 in 5+ unit buildings).
- At $21,937/mo this rent would consume 174% of the median local household income ($151k/yr) — very limited rent-growth headroom before tenants either downsize or default.
Forward outlook
- In year one you build about $228k of equity ($17k loan paydown + $211k appreciation (8.8% local appreciation)).
- Suffolk County population projected to shrink 5% by 2050 — rents likely to lag national; underwrite the cash flow, not the appreciation.
- At projected returns (8.8% appreciation + 3.0% rent growth), your $671k cash investment doubles in ~3 years — after that, you're playing with house money.
- By year 2, paydown + projected appreciation supports a ~$365k cash-out refi (75% LTV) — recoverable capital for the next deal without selling this one.
Negotiation context
- It's been on market 52 days — a 3% lower offer ($2.32M) is reasonable based on typical stale-listing flexibility.
- 3 sale attempts; this cycle's ask has dropped $1.60M (40%) from the opening price — seller is motivated, your offer sets the floor, not the list.
- Current owner paid $138k; list at $2.40M implies a 1636% gain — meaningful room to come down on a strong offer.
Risks & watch-outs
- Climate carrying-cost: major flood risk; severe wind risk, 80% chance of damaging wind over 30y — expect insurance premiums to compound above CPI over the hold.
Questions for the listing agent
- It's been on market 52 days. Have you received any prior offers? Is the seller open to a 8% concession, seller financing, or rate buy-down credit?
- Is there a deadline driving the sale (1031 exchange, divorce, estate, relocation)? That informs how much negotiation room exists.
- Schools are D-rated, which usually means shorter tenancies and higher turnover. Who's the typical renter profile here, and what's been the actual vacancy rate?
- What's the average days-on-market for RENTAL listings here right now (not sales)? A rising rental-DOM trend means longer vacancies and softer asking-rent achievability than the comps imply.
- What's the recent tenant-quality profile in this submarket — average credit score on applications, eviction rate, late-payment / NSF rate, and stable-employment percentage? A property-management company in the area should have these aggregated.
- How much new for-sale + rental construction is in the pipeline within 1–3 miles? Heavy new supply typically softens prices + rents 12–24 months out; constrained supply supports both.
Investment metrics
- 1% rule
- 0.92% ✗
- Cap rate
- 7.69%
- Cash-on-cash
- 4.98%
- DSCR
- 1.22
- GRM
- 9.1
CMA / ARV
- ARV (on-the-fly)
- $2,949,154
- Comps found
- 4
Show comp detail 4 sales within ~0.75 mi
| Address | Dist | Beds/Ba | Sqft | Sold | Price | $/sf | Match |
|---|---|---|---|---|---|---|---|
| 69 Shore Rd | 0.59mi | 5/3.5 (+1) | 3,400 (-7%) | 3mo | $6,200,000 | $1,824 | 53 |
| 11 Brushy Neck Ln | 0.71mi | 4/4.5 | 3,614 (-1%) | 24mo | $1,700,000 | $470 | 41 |
| 7 Apaucuck Point Ln | 0.40mi | 5/4.5 (+1) | 4,000 (+9%) | 22mo | $2,725,000 | $681 | 38 |
| 13A Summit Blvd | 0.67mi | 5/5.5 (+1) | 3,934 (+8%) | 12mo | $3,169,600 | $806 | 33 |
Match score weights: distance 35% · size 25% · config 20% · recency 20%. Top-matched comps best support the ARV.
Projected returns pro-forma
8.82% appreciation · 3.0% rent growth · sell at horizon
- IRR
- 25.5%
- Equity multiple
- 2.92×
- Total profit
- $1,290,797
- Equity at exit
- $1,955,700
- IRR
- 22.7%
- Equity multiple
- 6.40×
- Total profit
- $3,623,704
- Equity at exit
- $4,019,637
Cash invested: $670,600 (down + closing). Projections, not guarantees.
Landlord ↔ Tenant lean methodology
- Overall (STATE)
- 15 Strongly Tenant-Friendly
- State New York
- 15 Strongly Tenant-Friendly · D+10
- County
- — inherits STATE
- City
- — inherits STATE
ZIP-level market 11977
- Home prices YoY
- 2.3%
- Active inventory
- 63
- Price-to-rent
- 9.1×
Monthly cashflow live
- Estimated rent
- $21,937 medium interval (Pro) →
- Mortgage (P&I)
- −$12,560
- Tax from tax record
- −$992 /mo · $11,900/yr
- Insurance
- −$998
- HOA
- −$0
- Vacancy / Maint / Mgmt
- −$4,607
- Net cashflow
- $2,781
Break-even live
UW: 25.0% down · 7.5% · 30yr · 1.5% tax · 5.0% vac · 8.0% maint · 8.0% mgmt
Financing live
Cash to close
- Down payment
- $598,750
- Closing costs
- $71,850
- Reserves months
- —
- Total cash needed
- —
Loan-product check · same deal, 3 products live
Conventional
25% down · 7.5% · 30yr
- Down + closing
- —
- Monthly P&I
- —
- Monthly cashflow
- —
- DSCR
- —
- Eligible?
- —
Personal DTI + credit; lowest rate.
DSCR
20% down · 8.5% · 30yr
- Down + closing
- —
- Monthly P&I
- —
- Monthly cashflow
- —
- DSCR
- —
- Eligible?
- —
No personal income docs; deal must DSCR.
Hard money
10% down · 12.0% · 12mo
- Down + closing
- —
- Monthly P&I
- —
- Monthly cashflow
- —
- DSCR
- —
- Eligible?
- —
Short-term bridge; refi at stabilization.
Rent comps 11 comps
| Address | Beds | Baths | Sqft | Rent | $/sqft | DOM | Units | Dist |
|---|---|---|---|---|---|---|---|---|
| 8 Sweetgrass Rd Westhampton, NY | 5.0 | 4.5 | 4050 | $13,000 | $3.21 | 1d | 1 | 0.47mi |
| 7 Sea Breeze Ave Westhampton, NY | 5.0 | 3.5 | 2723 | $28,000 | $10.28 | 10d | 1 | 0.48mi |
| 13 Buttercup Ln Westhampton, NY | 3.0 | 4.5 | 3278 | $25,000 | $7.63 | 5d | 1 | 0.60mi |
| 9 Plume Grass Way Westhampton, NY | 4.0 | 5.5 | 4405 | $40,000 | $9.08 | 43d | 1 | 0.60mi |
| 134A Montauk Hwy Westhampton, NY | 4.0 | 3.5 | 2478 | $15,000 | $6.05 | 1d | 1 | 0.79mi |
| 3 Pine Grove Ct Westhampton, NY | 4.0 | 3.5 | 3500 | $35,000 | $10.00 | 22d | 1 | 0.87mi |
| 250 Oneck Ln Westhampton Beach, NY | 5.0 | 2.5 | 3113 | $20,000 | $6.42 | 18d | 1 | 1.00mi |
| 22 Meadow Ln Westhampton Beach, NY | 4.0 | 4.0 | 2500 | $70,000 | $28.00 | 24d | 1 | 1.11mi |
| 69 Oneck Rd Westhampton Beach, NY | 4.0 | 3.5 | 2922 | $10,000 | $3.42 | 7d | 1 | 1.17mi |
| 37 School St Westhampton Beach, NY | 4.0 | 4.0 | 3204 | $50,000 | $15.61 | 22d | 1 | 1.41mi |
| 38 Liberty St Westhampton Beach, NY | 4.0 | 2.5 | 2565 | $35,000 | $13.65 | 43d | 1 | 1.41mi |
Listing history 13 events
-
2026-05-01status Pending
-
2026-04-07status Active
-
2026-03-10status Active
-
2026-02-03price $2,395,000
-
2026-02-03historical $2,295,000
-
2026-02-01historical
-
2025-11-06price $2,375,000
-
2025-09-17price $2,575,000
-
2025-08-21price $2,975,000
-
2025-06-27price $3,200,000
-
2025-05-27price $3,750,000
-
2025-05-12$3,995,000 Active
-
1999-03-19soldstatus $138,000
ⓘ Source: listings_history table (triggers on properties + properties_extension) + one-shot
backfill from property_details.listing_events for pre-trigger history.
Tax reassessment forecast NY · Partial reset (capped growth)
- Current annual tax
- $11,900 · $992/mo
- Projected year-2 tax
- $26,187 · $2,182/mo
- Expected delta
- +$14,288/yr (+$1,191/mo · 120.1%)
ⓘ Screening estimate from a state-policy table — verify with the county assessor before closing.
Climate risk First Street
- Flood 6/10 Major FEMA zone X (shaded) · 56% chance over 30 yrs
- Wildfire 1/10 Low
- Heat 4/10 Moderate 7 d/yr ≥90°F today · 18 d/yr by 30 yrs out
- Wind 8/10 Severe 80% chance of damaging wind over 30 yrs
- Air quality 4/10 Moderate 4 unhealthy d/yr today · 5 by 30 yrs out
Nearby sold comps map
Loading sold comps map…
Walkable amenities ~0.75 mi
Loading nearby amenities…
Taxation est. · year 1
- Rental income
- $263,240
- − Mortgage interest
- −$134,157
- − Property taxes
- −$11,900
- − Insurance
- −$11,975
- − Repairs & maintenance
- −$21,059
- − Management
- −$21,059
- − Depreciation
- −$69,673
- Taxable loss
- −$6,583
- Est. tax savings @ 24.0%
- +$1,580
- After-tax cash flow
- $34,949/yr
For passive investors: Depreciation is non-cash, so a rental often shows a tax loss while cash-flowing — sheltering income. Rental losses are passive: they offset passive income freely, and up to $25,000/yr can offset ordinary (W-2) income if you actively participate and your MAGI is under $100k (phasing out to $0 by $150k); unused losses carry forward. On sale, claimed depreciation is recaptured at up to 25%, and gains may owe capital-gains tax (a 1031 exchange can defer both). Figures are a year-1 estimate at your 24.0% rate — not tax advice; consult a CPA.
Schools (NCES district)
- District
- Westhampton Beach Union Free School District
- NCES district ID
- 3631020
- Math proficiency
- 72% ▼ -5.00%
- Reading proficiency
- 75% ▲ 3.00%
- Median HH income
- $88,137
- Composite
- 65.91/100
- National rank
- #444
- State rank
- #81 of 590 in NY
Livability — Westhampton
- Score
- 60/100
- State rank
- #969
- US rank
- #18972
Category grades
Schools grade is shown separately in the Schools card above.
Census & demographics
- Census place
- Westhampton, NY
- County
- Suffolk County · 679,920 people
- City population
- 2,843
- Metro
- New York-Newark-Jersey City, NY-NJ-PA
- Population (ZIP)
- 2,843
- Household income
- $151,375
- Rent vs Own
- Severe rent burden
- 14.0
Population outlook (Suffolk County) Hauer SSP2
- Today (2025)
- 1,505,262 people
- By 2030
- 1,498,318 · -0.5%
- By 2040
- 1,471,101 · -2.3%
- By 2050
- 1,424,848 · -5.3%
- By 2075
- 1,337,157 · -11.2%
- By 2100
- 1,217,720 · -19.1%
Race, ethnicity, and origin ACS 2023
- Neighborhood character
- Predominantly White (89%)
- Race & ethnicity
- White 89% Hispanic / Latino 5% Asian 3% Two or more races 2%
- Hispanic origin (detail)
- Common ancestry
- Scotch-Irish 3% Romanian 3% Subsaharan African 1%
- Foreign-born
- 11% · Canada, South Korea
- Languages at home
- 89% English-only · Spanish 5% Other Indo-European 4% Korean 2%
Political lean MEDSL · Suffolk
- 2024 margin
- Lean R (+10.0) · D 45.0% · R 55.0%
- 2008→2024 swing
- -16.0pp toward R · 2008: 6.0pp · 2024: -10.0pp
- All cycles
- 2024: R+10.0 2020: R+0.0 2016: R+8.2 2012: D+2.9 2008: D+6.0
Not yet ingested
- Civics
- —
Market trends
- HPI YoY
- ▲ 8.82%
- Current HPI
- 391.8868
- Rent YoY
- —
- Metro
- New York-Newark-Jersey City, NY-NJ-PA
- State GDP YoY
- ▲ 2.60%
- F500 in state
- 92
Industry mix (Fortune 500 HQ in NY)
| Industry | F500 HQs | Revenue |
|---|---|---|
| Financial Services | 10 | $950B |
|
||
| Consumer Goods | 9 | $162B |
|
||
| Insurance | 4 | $225B |
|
||
| Telecommunications | 2 | $144B |
|
||
| Pharmaceuticals | 2 | $112B |
|
||
| Media / Entertainment | 2 | $69B |
|
||
Price history
+1635.5% since first listed13 events — show timeline
- 2026-05-01 Pending — OneKey® MLS as Distributed by MLS Grid
- 2026-04-07 Relisted — OneKey® MLS as Distributed by MLS Grid
- 2026-03-10 Relisted — OneKey® MLS as Distributed by MLS Grid
- 2026-02-03 Price Changed $2,395,000 OneKey® MLS as Distributed by MLS Grid
- 2026-02-03 Coming Soon $2,295,000 OneKey® MLS as Distributed by MLS Grid
- 2026-02-01 Listing Removed — OneKey® MLS as Distributed by MLS Grid
- 2025-11-06 Price Changed $2,375,000 OneKey® MLS as Distributed by MLS Grid
- 2025-09-17 Price Changed $2,575,000 OneKey® MLS as Distributed by MLS Grid
- 2025-08-21 Price Changed $2,975,000 OneKey® MLS as Distributed by MLS Grid
- 2025-06-27 Price Changed $3,200,000 OneKey® MLS as Distributed by MLS Grid
- 2025-05-27 Price Changed $3,750,000 OneKey® MLS as Distributed by MLS Grid
- 2025-05-12 Listed $3,995,000 OneKey® MLS as Distributed by MLS Grid
- 1999-03-19 Sold (Public Records) $138,000 Public Records
Property tax history
+1.8%/yrLatest (2024): $11,900 · +0.0% YoY. Source: county tax records.
Cash-flow waterfall
monthlySold comps — $/sqft
last 12 mo · ≤1 miLoading sold comps…