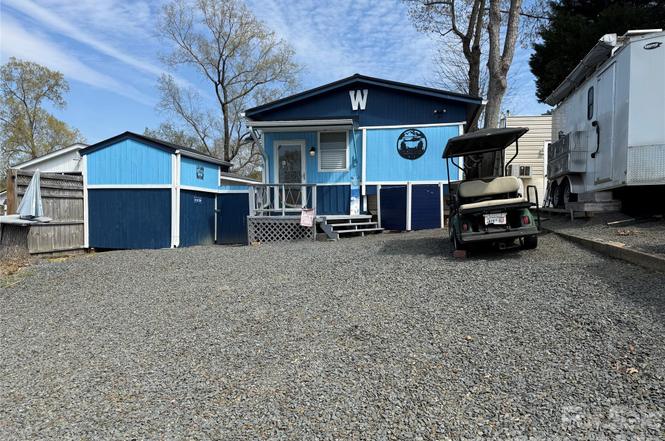
115 Hollywood Trl Unit A79 · Norwood, NC
Flood risk 1/10 · Minimal
- FEMA flood zone
- X (unshaded)
- Chance of flooding over 30 yrs
- 0.0%
- Est. flood insurance / yr
- $507 – $1,088
Fire risk 3/10 · Minor
- Est. fire insurance / yr
- $906 – $1,684
Heat risk 6/10 · Moderate
- Hot days now (above 108°F)
- 7 days/yr
- Hot days in 30 yrs
- 16 days/yr
Wind risk 6/10 · Moderate
- Chance of severe wind over 30 yrs
- 27.0%
Air-quality risk 2/10 · Minimal
- Unhealthy air days now
- 2 days/yr
- Unhealthy air days in 30 yrs
- 2 days/yr
Risk factors via First Street. Map © Google.
Why this score? — see what drove the D+ grade
The composite is a weighted blend of 9 inputs, each scored 0–100. Each bar is that input's sub-score; the figure is the points it added to the 100-point composite (weight × sub-score).
- Cash flow +18.4/30.0
- DSCR +5.8/10.0
- 1% rule +5.4/10.0
- ARV discount +4.7/15.0
- Appreciation +4.5/10.0
- Livability +3.2/5.0
- Schools +2.6/10.0
- Rent growth +2.5/5.0
- Condition / age +2.5/5.0
$122,000
🖨 Deal sheet 📄 Offer letter ✓ Due diligence
Listing remarks
Welcome to this unique unit here in the park. This a 2 bedroom, 2 1/2 baths unit with a fabulous outdoor kitchen setup and a second sleeping/bathroom space. Included in the outdoor kitchen - Blackstone Gas Griddle, Blackstone Prep Area, covered with elec and fan. Move over to the covered bar side and you have 4 stools, a beverage refrigerator, Microwave, Ninja Foodie Grill, Panini Maker, Oster French Door Oven. Power and a TV are already there. There is a covered swing, fenced yard for the pets and a pet washing station. Inside is a great living room freshly painted with new flooring. Most furnishing to remain. U shaped couch makes a comfortable queen bed. The kitchen has an ice maker, gre
Key facts
- Fenced yard
- Covered bar side
- Dog washing station
Tags
Property features AI
Finance
- Other: Lake access includes public beach, community boat ramp and community boat slips; Located on a privately maintained gravel/paved road; Zoned RV
- HOA & community: Mandatory HOA with annual fee of $520; Community amenities: lake access, outdoor pool, picnic area, playground, recreation area, street lights, walking trails
Exterior
- Parking: Driveway parking
- Security: Gated community
- Utilities: County water; County sewer
- Home design: Manufactured home; Single-family residence; One level; Entry facing the community (unit in gated community)
- Construction: Wood construction; Metal roof; Pillar/post/pier foundation
- Exterior features: Outdoor kitchen; Fenced yard (wood)
Interior
- Bedrooms: 2 bedrooms on the main level
- Bathrooms: 2 full bathrooms; 1 half bathroom
- Heating & cooling: Propane heating; Wall furnace; Ceiling fans; Window air conditioning units; Electric cooling
- Interior features: 7 total rooms; Bar fridge
- Laundry & utility: No laundry hookups inside
Neighborhood map
What this means for you Summary
Snapshot
- This is a 2-bed/2.5-bath single-family listed at $122k.
Deal economics
- At list price, monthly cash flow is $114 ($1k/yr) — positive.
- The deal already cash-flows at list — no discount required.
- Meets the 1% rule at list price ($1k rent vs $122k).
- Recommended offer: $107k (12.0% below list) — sets the bar for market timing.
- Cap rate 7.4% vs local median 2.9% in Norwood — top-decile yield for the area; either an underpriced asset or a hidden risk that comps aren't pricing in. Stress-test before assuming the spread holds.
Location & tenants
- Location reads 63/100 on livability (#410 in NC) — a middle-class / working-renter tenant base. Strengths: cost of living A+, housing A+, crime A; Watch: schools F, amenities F, commute F.
- Montgomery County Schools (rural): math 29% / reading 34% proficiency, ranked #143 of 178 in NC (top 80%) — families likely to look elsewhere, expect single-tenant / working-renter base with shorter leases; 66% free/reduced lunch — lower-income household profile, screen leases tightly.
- Market conditions: 113 active listings in the ZIP; 138 units permitted in Montgomery County in 2024 (0 in 5+ unit buildings).
Forward outlook
- Local home prices are declining (-0.9%/yr); year-one equity from $843 of loan paydown is wiped out by about $1k of value loss. Plan a longer hold.
- Montgomery County population projected at -17% by 2050 — secular population decline; favor cash flow + early exit over multi-decade hold.
Negotiation context
- It's been on market 288 days — a 12% lower offer ($107k) is reasonable based on typical stale-listing flexibility.
Risks & watch-outs
- Climate carrying-cost: major wind risk, 27% chance of damaging wind over 30y; extreme-heat days projected 7→16/yr by 2055 (HVAC capex compounding) — expect insurance premiums to compound above CPI over the hold.
Questions for the listing agent
- It's been on market 288 days. Have you received any prior offers? Is the seller open to a 12% concession, seller financing, or rate buy-down credit?
- What does the HOA fee cover, when was the last increase, and are there any pending special assessments or reserve-fund shortfalls?
- Why hasn't it sold? Are there any deal-killer items the seller is aware of (foundation, flood, title, zoning, code violations)?
- Is there a deadline driving the sale (1031 exchange, divorce, estate, relocation)? That informs how much negotiation room exists.
- Schools are F-rated, which usually means shorter tenancies and higher turnover. Who's the typical renter profile here, and what's been the actual vacancy rate?
- The area grade is low — what's the realistic commute time and amenity access for the typical tenant pool here? Any planned neighborhood developments (good or bad) we should know about?
- What's the average days-on-market for RENTAL listings here right now (not sales)? A rising rental-DOM trend means longer vacancies and softer asking-rent achievability than the comps imply.
- What's the recent tenant-quality profile in this submarket — average credit score on applications, eviction rate, late-payment / NSF rate, and stable-employment percentage? A property-management company in the area should have these aggregated.
- How much new for-sale + rental construction is in the pipeline within 1–3 miles? Heavy new supply typically softens prices + rents 12–24 months out; constrained supply supports both.
Investment metrics
- 1% rule
- 1.04% ✓
- Cap rate
- 7.42%
- Cash-on-cash
- 4.02%
- DSCR
- 1.18
- GRM
- 8.0
CMA / ARV
- ARV (on-the-fly)
- $114,912
- Comps found
- 12
Show comp detail 12 sales within ~0.75 mi
| Address | Dist | Beds/Ba | Sqft | Sold | Price | $/sf | Match |
|---|---|---|---|---|---|---|---|
| 109 Hide A Way Trl | 0.01mi | 2/1.0 | 470 (+9%) | 3mo | $77,500 | $165 | 76 |
| 201 Deer Park Rd | 0.20mi | 1/1.0 (-1) | 408 (-6%) | 6mo | $90,000 | $221 | 66 |
| 104 Oak Trl | 0.37mi | 1/1.0 (-1) | 450 (+4%) | 7mo | $55,000 | $122 | 59 |
| 103 Holly Harbor Trl Unit 348A | 0.31mi | 1/1.0 (-1) | 400 (-7%) | 5mo | $150,000 | $375 | 58 |
| 111/113 Shawnee Trl Unit D140/141 | 0.41mi | 1/1.0 (-1) | 420 (-3%) | 9mo | $165,000 | $393 | 58 |
| 108 Sailors Ct Unit 108 B | 0.22mi | 1/1.0 (-1) | 396 (-8%) | 9mo | $123,563 | $312 | 57 |
| 286 Lake Tillery Trl | 0.59mi | 2/1.0 | 456 (+6%) | 2mo | $100,000 | $219 | 55 |
| 110 Shawnee Trl | 0.41mi | 1/1.0 (-1) | 402 (-7%) | 8mo | $125,000 | $311 | 51 |
| 149 Deer Park Rd Unit D26/27 | 0.41mi | 2/1.0 | 374 (-13%) | 2mo | $105,000 | $281 | 51 |
| 135 Muskhogean Way | 0.39mi | 1/1.0 (-1) | 380 (-12%) | 2mo | $81,500 | $214 | 49 |
| 140 Landlubber Trl Unit H73 | 0.33mi | 2/1.0 | 376 (-13%) | 10mo | $100,000 | $266 | 49 |
| 146 Larboard Trl | 0.27mi | 1/1.0 (-1) | 484 (+12%) | 11mo | $79,000 | $163 | 48 |
Match score weights: distance 35% · size 25% · config 20% · recency 20%. Top-matched comps best support the ARV.
Projected returns pro-forma
-0.94% appreciation · 3.0% rent growth · sell at horizon
- IRR
- -1.0%
- Equity multiple
- 0.96×
- Total profit
- $-1,509
- Equity at exit
- $29,812
- IRR
- 5.6%
- Equity multiple
- 1.54×
- Total profit
- $18,550
- Equity at exit
- $31,615
Cash invested: $34,160 (down + closing). Projections, not guarantees.
Landlord ↔ Tenant lean methodology
- Overall (STATE)
- 85 Strongly Landlord-Friendly
- State North Carolina
- 85 Strongly Landlord-Friendly · R+3
- County
- — inherits STATE
- City
- — inherits STATE
ZIP-level market 27306
- Home prices YoY
- -0.3%
- Active inventory
- 113
- Price-to-rent
- 8.0×
Monthly cashflow live
- Estimated rent
- $1,267 medium interval (Pro) →
- Mortgage (P&I)
- −$640
- Tax est. 1.5%
- −$152 /mo · $1,830/yr
- Insurance
- −$51
- HOA
- −$43
- Vacancy / Maint / Mgmt
- −$266
- Net cashflow
- $114
Break-even live
UW: 25.0% down · 7.5% · 30yr · 1.5% tax · 5.0% vac · 8.0% maint · 8.0% mgmt
Financing live
Cash to close
- Down payment
- $30,500
- Closing costs
- $3,660
- Reserves months
- —
- Total cash needed
- —
Loan-product check · same deal, 3 products live
Conventional
25% down · 7.5% · 30yr
- Down + closing
- —
- Monthly P&I
- —
- Monthly cashflow
- —
- DSCR
- —
- Eligible?
- —
Personal DTI + credit; lowest rate.
DSCR
20% down · 8.5% · 30yr
- Down + closing
- —
- Monthly P&I
- —
- Monthly cashflow
- —
- DSCR
- —
- Eligible?
- —
No personal income docs; deal must DSCR.
Hard money
10% down · 12.0% · 12mo
- Down + closing
- —
- Monthly P&I
- —
- Monthly cashflow
- —
- DSCR
- —
- Eligible?
- —
Short-term bridge; refi at stabilization.
HOA detail
- Monthly dues
- $43 · $516/yr
- Likely covers
- gas
Listing history 18 events
-
2026-06-18days on market $122,000 Active 288 DOM
-
2026-06-17days on market $122,000 Active 287 DOM
-
2026-06-16days on market $122,000 Active 286 DOM
-
2026-06-15days on market $122,000 Active 285 DOM
-
2026-06-14days on market $122,000 Active 283 DOM
-
2026-06-13days on market $122,000 Active 282 DOM
-
2026-06-10days on market $122,000 Active 280 DOM
-
2026-06-09pricedays on market $122,000 Active 279 DOM
-
2026-06-08days on market $126,000 Active 278 DOM
-
2026-06-07days on market $126,000 Active 277 DOM
-
2026-06-05days on market $126,000 Active 274 DOM
-
2026-06-03days on market $126,000 Active 273 DOM
-
2026-06-02days on market $126,000 Active 272 DOM
-
2026-06-01days on market $126,000 Active 271 DOM
-
2026-05-31days on market $126,000 Active 270 DOM
-
2026-05-31days on market $126,000 Active 269 DOM
-
2026-04-28price $126,000
-
2025-09-03$129,000 Active
ⓘ Source: listings_history table (triggers on properties + properties_extension) + one-shot
backfill from property_details.listing_events for pre-trigger history.
Climate risk First Street
- Flood 1/10 Low FEMA zone X (unshaded) · 0% chance over 30 yrs
- Wildfire 3/10 Moderate
- Heat 6/10 Major 7 d/yr ≥108°F today · 16 d/yr by 30 yrs out
- Wind 6/10 Major 27% chance of damaging wind over 30 yrs
- Air quality 2/10 Low 2 unhealthy d/yr today · 2 by 30 yrs out
Nearby sold comps map
Loading sold comps map…
Walkable amenities ~0.75 mi
Loading nearby amenities…
Taxation est. · year 1
- Rental income
- $15,199
- − Mortgage interest
- −$6,834
- − Property taxes
- −$1,830
- − Insurance
- −$610
- − Repairs & maintenance
- −$1,216
- − Management
- −$1,216
- − HOA
- −$516
- − Depreciation
- −$3,549
- Taxable loss
- −$572
- Est. tax savings @ 24.0%
- +$137
- After-tax cash flow
- $1,511/yr
For passive investors: Depreciation is non-cash, so a rental often shows a tax loss while cash-flowing — sheltering income. Rental losses are passive: they offset passive income freely, and up to $25,000/yr can offset ordinary (W-2) income if you actively participate and your MAGI is under $100k (phasing out to $0 by $150k); unused losses carry forward. On sale, claimed depreciation is recaptured at up to 25%, and gains may owe capital-gains tax (a 1031 exchange can defer both). Figures are a year-1 estimate at your 24.0% rate — not tax advice; consult a CPA.
Schools (NCES district)
- District
- Montgomery County Schools
- NCES district ID
- 3703060
- Math proficiency
- 29% ▼ -6.00%
- Reading proficiency
- 34% ▼ -2.00%
- Median HH income
- $34,706
- Composite
- 25.97/100
- National rank
- #7328
- State rank
- #143 of 178 in NC
Livability — Norwood
- Score
- 63/100
- State rank
- #410
- US rank
- #15485
Category grades
Schools grade is shown separately in the Schools card above.
Census & demographics
- Population (ZIP)
- 5,457
Population outlook (Montgomery County) Hauer SSP2
- Today (2025)
- 26,533 people
- By 2030
- 25,724 · -3.0%
- By 2040
- 23,842 · -10.1%
- By 2050
- 22,077 · -16.8%
- By 2075
- 18,754 · -29.3%
- By 2100
- 15,537 · -41.4%
Race, ethnicity, and origin ACS 2023
- Neighborhood character
- Majority White (64%)
- Race & ethnicity
- White 64% Black 26% Asian 6% Hispanic / Latino 2% Two or more races 2%
- Common ancestry
- Slovak 2% Serbian 1% Iranian 1%
- Foreign-born
- 6% · China, Canada, Philippines
- Languages at home
- 92% English-only · Other Asian/Pacific 5% Spanish 2% Chinese 1%
Political lean MEDSL · Montgomery
- 2024 margin
- Solid R (+37.8) · D 30.8% · R 68.6%
- 2008→2024 swing
- -26.9pp toward R · 2008: -11.0pp · 2024: -37.8pp
- All cycles
- 2024: R+37.8 2020: R+31.8 2016: R+25.9 2012: R+15.2 2008: R+11.0
Not yet ingested
- Civics
- —
Market trends
- HPI YoY
- ▼ -0.94%
- Current HPI
- 334.2599
- Rent YoY
- —
- Metro
- —
- State GDP YoY
- ▲ 3.28%
- F500 in state
- 26
Industry mix (Fortune 500 HQ in NC)
| Industry | F500 HQs | Revenue |
|---|---|---|
| Financial Services | 2 | $213B |
|
||
| Retail | 2 | $95B |
|
||
| Industrial Conglomerate | 1 | $38B |
|
||
| Metals / Steel | 1 | $35B |
|
||
| Utilities | 1 | $30B |
|
||
| Industrial Machinery | 1 | $19B |
|
||
Price history
-2.3% since first listed2 events — show timeline
- 2026-04-28 Price Changed $126,000 CANOPYMLS as Distributed by MLS Grid
- 2025-09-03 Listed $129,000 CANOPYMLS as Distributed by MLS Grid
Cash-flow waterfall
monthlySold comps — $/sqft
last 12 mo · ≤1 miLoading sold comps…