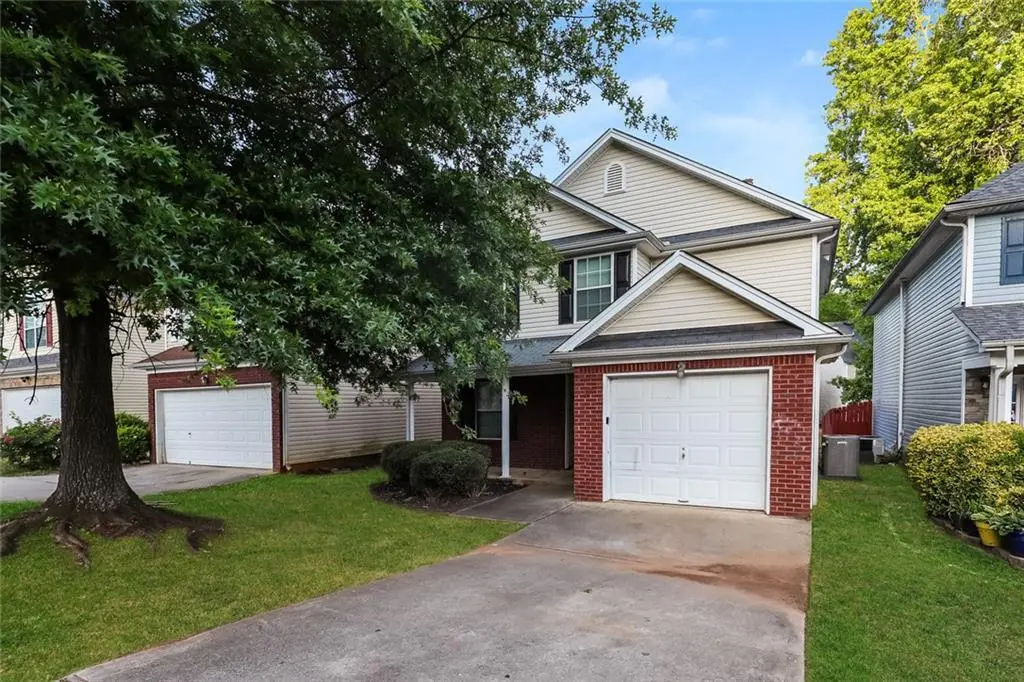
11235 James Madison Dr · Bonanza, GA
Flood risk 1/10 · Minimal
- FEMA flood zone
- X (unshaded)
- Chance of flooding over 30 yrs
- 0.0%
- Est. flood insurance / yr
- $507 – $1,088
Fire risk 3/10 · Minor
- Est. fire insurance / yr
- $963 – $1,789
Heat risk 6/10 · Moderate
- Hot days now (above 105°F)
- 7 days/yr
- Hot days in 30 yrs
- 19 days/yr
Wind risk 6/10 · Moderate
- Chance of severe wind over 30 yrs
- 27.0%
Air-quality risk 4/10 · Minor
- Unhealthy air days now
- 4 days/yr
- Unhealthy air days in 30 yrs
- 5 days/yr
Risk factors via First Street. Map © Google.
Why this score? — see what drove the D- grade
The composite is a weighted blend of 9 inputs, each scored 0–100. Each bar is that input's sub-score; the figure is the points it added to the 100-point composite (weight × sub-score).
- ARV discount +13.1/15.0
- Cash flow +10.2/30.0
- 1% rule +3.3/10.0
- Rent growth +3.1/5.0
- Livability +3.1/5.0
- DSCR +2.9/10.0
- Condition / age +2.5/5.0
- Schools +1.3/10.0
- Appreciation +0.0/10.0
$235,000
🖨 Deal sheet 📄 Offer letter ✓ Due diligence
Listing remarks MLS
New Paint inside out, new carpet. Seller never live in the house. No seller disclose and selling as is.
Key facts
- Functional peninsula
- Attached garage
- Walk-in closet
Tags
Property features AI
Finance
- HOA & community: Annual association fee of $560 covering grounds maintenance
Exterior
- Parking: Garage (1 garage space); Room for a total of 4 vehicles
- Utilities: Public water; Public sewer; Satellite dish
- Home design: Two levels; Resale property
- Construction: Composition roof; Slab foundation; Built with vinyl siding
- Exterior features: Vinyl siding; Other exterior features
Interior
- Kitchen: Electric range; Microwave; Refrigerator; Dishwasher; Stained cabinets with laminate countertops
- Bedrooms: Three upper-level bedrooms; Oversized master bedroom
- Flooring: Carpet; Luxury vinyl
- Bathrooms: Two full bathrooms; One half bathroom (main level); Master bath with separate tub and shower
- Heating & cooling: Central air conditioning
- Interior features: One fireplace located in the family room; Open-concept dining area; Bonus room and family room; No shared/common walls; Other interior features
- Laundry & utility: Laundry area located in hall
Neighborhood map
What this means for you Summary
Snapshot
- This is a 3-bed/2.0-bath single-family listed at $235k.
Deal economics
- At list price, monthly cash flow is $-133 ($-2k/yr) — negative.
- To cash-flow at today's rent, offer at most $212k (10.0% below list).
- To meet the 1% rule (rent ≥ 1% of price), the offer needs to be $195k (16.9% below list).
- Recommended offer: $195k (16.9% below list) — sets the bar for 1% rule.
Location & tenants
- Location reads 62/100 on livability (#314 in GA) — a middle-class / working-renter tenant base. Strengths: cost of living A+, housing A+, crime A; Watch: employment C-, schools F, amenities F.
- Clayton County (suburban): math 11% / reading 20% proficiency, ranked #155 of 174 in GA (top 89%) — low school quality limits family demand, transient renter base, plan for 1-2y turnover; 78% free/reduced lunch — lower-income household profile, screen leases tightly.
- Market conditions: Rents rising (+2.2%/yr); 547 active listings in the ZIP; 40 comparable units currently listed for rent nearby; rentals at typical pace (median 25d on market — plan ~3-4 weeks tenant-placement turnaround); 45% of comp listings sitting > 30 days — soft ceiling on asking rent; solid renter incomes; 865 units permitted in Clayton County in 2024 (448 in 5+ unit buildings).
Forward outlook
- Local home prices are declining (-3.0%/yr); year-one equity from $2k of loan paydown is wiped out by about $7k of value loss. Plan a longer hold.
- Clayton County population projected at +29% by 2050 — long-run rental-demand tailwind backs the buy-and-hold thesis.
Negotiation context
- It's been on market 28 days — a 2% lower offer ($231k) is reasonable based on typical stale-listing flexibility.
- 7 sale attempts since 6y ago with the ask held roughly flat each time — persistent listings suggest the price (not the market) is what's stuck; bring a comps-based counter.
- Current owner paid $138k; list at $235k implies a 70% gain — meaningful room to come down on a strong offer.
Risks & watch-outs
- Climate carrying-cost: major wind risk, 27% chance of damaging wind over 30y; extreme-heat days projected 7→19/yr by 2055 (HVAC capex compounding) — expect insurance premiums to compound above CPI over the hold.
Questions for the listing agent
- What do current leases actually rent for vs. the listed asking? Can we see a recent rent roll and the last 12 months of T-12 income?
- What does the HOA fee cover, when was the last increase, and are there any pending special assessments or reserve-fund shortfalls?
- Is there a deadline driving the sale (1031 exchange, divorce, estate, relocation)? That informs how much negotiation room exists.
- Schools are F-rated, which usually means shorter tenancies and higher turnover. Who's the typical renter profile here, and what's been the actual vacancy rate?
- The area grade is low — what's the realistic commute time and amenity access for the typical tenant pool here? Any planned neighborhood developments (good or bad) we should know about?
- What's the average days-on-market for RENTAL listings here right now (not sales)? A rising rental-DOM trend means longer vacancies and softer asking-rent achievability than the comps imply.
- What's the recent tenant-quality profile in this submarket — average credit score on applications, eviction rate, late-payment / NSF rate, and stable-employment percentage? A property-management company in the area should have these aggregated.
- How much new for-sale + rental construction is in the pipeline within 1–3 miles? Heavy new supply typically softens prices + rents 12–24 months out; constrained supply supports both.
Investment metrics
- 1% rule
- 0.83% ✗
- Cap rate
- 5.62%
- Cash-on-cash
- -2.42%
- DSCR
- 0.89
- GRM
- 10.0
CMA / ARV
- ARV (median comp)
- $268,192
- List price
- $235,000
- Delta
- -12.38%
- Verdict
- UNDERPRICED
- Comps
- 20 within 1.0 mi
Show comp detail 12 sales within ~0.75 mi
| Address | Dist | Beds/Ba | Sqft | Sold | Price | $/sf | Match |
|---|---|---|---|---|---|---|---|
| 11139 Silver Aspen Ct | 0.35mi | 3/2.0 | 1,464 (-4%) | 8mo | $210,000 | $143 | 72 |
| 11203 Knotty Pine Pl | 0.42mi | 3/2.0 | 1,444 (-5%) | 1mo | $195,000 | $135 | 71 |
| 11224 Aliyah Dr | 0.03mi | 3/2.5 | 1,719 (+13%) | 5mo | $250,000 | $145 | 70 |
| 11120 Tara Glynn Dr | 0.48mi | 3/2.0 | 1,459 (-4%) | 3mo | $249,000 | $171 | 69 |
| 1623 Elizabeth Ln | 0.49mi | 3/2.0 | 1,392 (-8%) | 3mo | $213,000 | $153 | 61 |
| 11045 Knotty Pine Pl | 0.51mi | 3/2.0 | 1,410 (-7%) | 6mo | $183,000 | $130 | 59 |
| 11171 Knotty Pine Pl | 0.42mi | 3/2.0 | 1,338 (-12%) | 4mo | $235,000 | $176 | 58 |
| 11581 Kades Trl | 0.71mi | 3/2.0 | 1,456 (-4%) | 7mo | $249,000 | $171 | 54 |
| 10959 Thrasher Rd | 0.63mi | 3/2.0 | 1,395 (-8%) | 3mo | $205,000 | $147 | 54 |
| 1684 Lovejoy Rd | 0.63mi | 3/2.0 | 1,688 (+11%) | 5mo | $255,000 | $151 | 48 |
| 1741 Portwest Way | 0.71mi | 3/2.0 | 1,374 (-10%) | 6mo | $250,000 | $182 | 46 |
| 1652 Thorn Ridge Trl | 0.67mi | 3/2.0 | 1,360 (-10%) | 7mo | $201,000 | $148 | 46 |
Match score weights: distance 35% · size 25% · config 20% · recency 20%. Top-matched comps best support the ARV.
Projected returns pro-forma
-3.0% appreciation · 2.2% rent growth · sell at horizon
- IRR
- -21.2%
- Equity multiple
- 0.27×
- Total profit
- $-48,024
- Equity at exit
- $35,039
- IRR
- -16.7%
- Equity multiple
- 0.11×
- Total profit
- $-58,744
- Equity at exit
- $20,319
Cash invested: $65,800 (down + closing). Projections, not guarantees.
Landlord ↔ Tenant lean methodology
- Overall (STATE)
- 90 Strongly Landlord-Friendly
- State Georgia
- 90 Strongly Landlord-Friendly · R+3
- County
- — inherits STATE
- City
- — inherits STATE
ZIP-level market 30228
- Home prices YoY
- -24.3%
- Rents YoY
- 2.2%
- Active inventory
- 547
- Price-to-rent
- 10.0×
Monthly cashflow live
- Estimated rent
- $1,953 high interval (Pro) →
- Mortgage (P&I)
- −$1,232
- Tax from tax record
- −$298 /mo · $3,581/yr
- Insurance
- −$98
- HOA
- −$47
- Vacancy / Maint / Mgmt
- −$410
- Net cashflow
- $-133
Break-even live
UW: 25.0% down · 7.5% · 30yr · 1.5% tax · 5.0% vac · 8.0% maint · 8.0% mgmt
Financing live
Cash to close
- Down payment
- $58,750
- Closing costs
- $7,050
- Reserves months
- —
- Total cash needed
- —
Loan-product check · same deal, 3 products live
Conventional
25% down · 7.5% · 30yr
- Down + closing
- —
- Monthly P&I
- —
- Monthly cashflow
- —
- DSCR
- —
- Eligible?
- —
Personal DTI + credit; lowest rate.
DSCR
20% down · 8.5% · 30yr
- Down + closing
- —
- Monthly P&I
- —
- Monthly cashflow
- —
- DSCR
- —
- Eligible?
- —
No personal income docs; deal must DSCR.
Hard money
10% down · 12.0% · 12mo
- Down + closing
- —
- Monthly P&I
- —
- Monthly cashflow
- —
- DSCR
- —
- Eligible?
- —
Short-term bridge; refi at stabilization.
Rent comps 40 comps
| Address | Beds | Baths | Sqft | Rent | $/sqft | DOM | Units | Dist |
|---|---|---|---|---|---|---|---|---|
| 11248 James Madison Dr Hampton, GA | 3.0 | 2.5 | 1986 | $1,980 | $1.00 | 11d | 1 | 0.01mi |
| 11236 James Madison Dr Hampton, GA | 3.0 | 2.5 | 1518 | $1,870 | $1.23 | 44d | 1 | 0.02mi |
| 1578 Onalee Dr Hampton, GA | 3.0 | 2.5 | 1709 | $1,800 | $1.05 | 24d | 1 | 0.20mi |
| 1562 Onalee Dr Hampton, GA | 3.0 | 2.0 | 2125 | $1,800 | $0.85 | 44d | 1 | 0.20mi |
| 1562 Onalee Dr Hampton, GA | 3.0 | 2.5 | 2125 | $1,775 | $0.84 | 19d | 1 | 0.20mi |
| 11015 Tara Blvd Lovejoy, GA | 1.0–3.0 | 1.0–2.0 | 1113 | $1,815 | $1.63 | 44d | 1 | 0.33mi |
| 1902 Grove Way Lovejoy, GA | 3.0 | 2.5 | 1592 | $1,555 | $0.98 | 4d | 1 | 0.42mi |
| 11035 Shannon Cir Hampton, GA | 3.0 | 2.0 | 1320 | $1,606 | $1.22 | 13d | 1 | 0.43mi |
| 1992 Lovejoy Rd Lovejoy, GA | 1.0–3.0 | 1.0–2.0 | 1085 | $1,902 | $1.75 | 2d | 25 | 0.45mi |
| 1863 Grove Way Lovejoy, GA | 3.0 | 2.5 | 1592 | $1,660 | $1.04 | 24d | 1 | 0.45mi |
| 2019 Grove Way Lovejoy, GA | 3.0 | 2.5 | 1524 | $1,395 | $0.92 | 44d | 1 | 0.46mi |
| 1781 Fielding Way Lovejoy, GA | 3.0 | 2.5 | 1370 | $1,545 | $1.13 | 44d | 1 | 0.51mi |
| 10911 Tara Blvd Lovejoy, GA | 1.0–3.0 | 1.0–2.0 | 1150 | $1,795 | $1.56 | 44d | 1 | 0.55mi |
| 11517 Haleigh St Lovejoy, GA | 3.0 | 3.0 | 2228 | $2,000 | $0.90 | 44d | 1 | 0.57mi |
| 1591 Elizabeth Ln Hampton, GA | 3.0 | 2.0 | 1352 | $1,591 | $1.18 | 44d | 1 | 0.58mi |
| 2355 Brianna Dr Lovejoy, GA | 3.0 | 2.5 | 1876 | $1,476 | $0.79 | 13d | 1 | 0.63mi |
| 1906 Dalton Way Lovejoy, GA | 3.0 | 3.0 | 2228 | $2,100 | $0.94 | 44d | 1 | 0.63mi |
| 2361 Brianna Dr Lovejoy, GA | 3.0 | 2.5 | 1384 | $1,525 | $1.10 | 22d | 1 | 0.64mi |
| 2306 Nicole Dr Lovejoy, GA | 3.0 | 2.5 | 1324 | $1,800 | $1.36 | 44d | 1 | 0.65mi |
| 2367 Brianna Dr Lovejoy, GA | 3.0 | 2.5 | 1440 | $1,695 | $1.18 | 44d | 1 | 0.65mi |
| 11531 Kimberly Way Lovejoy, GA | 3.0 | 2.5 | 1579 | $2,200 | $1.39 | 4d | 1 | 0.66mi |
| 11522 Kimberly Way Lovejoy, GA | 3.0 | 2.5 | 1700 | $2,200 | $1.29 | 4d | 1 | 0.66mi |
| 2275 Nicole Dr Lovejoy, GA | 4.0 | 2.0 | 1800 | $1,835 | $1.02 | 5d | 1 | 0.67mi |
| 1652 Thorn Ridge Trl Hampton, GA | 3.0 | 2.0 | 1360 | $1,960 | $1.44 | 44d | 1 | 0.69mi |
| 2251 Nicole Dr #119 Hampton, GA | 3.0 | 2.5 | 1324 | $1,700 | $1.28 | 24d | 1 | 0.70mi |
| 11352 Michelle Way Lovejoy, GA | 3.0 | 2.5 | 1440 | $1,485 | $1.03 | 13d | 1 | 0.71mi |
| 2411 Brianna Dr Lovejoy, GA | 3.0 | 2.0 | 1432 | $1,826 | $1.28 | 3d | 1 | 0.72mi |
| 11540 Alicias Ct Lovejoy, GA | 3.0 | 2.5 | 1876 | $1,711 | $0.91 | 5d | 1 | 0.72mi |
| 2051 Registry Ct Lovejoy, GA | 4.0 | 3.0 | 2188 | $1,940 | $0.89 | 44d | 1 | 0.75mi |
| 10887 Tara Blvd Hampton, GA | 3.0 | 2.5 | 1756 | $2,032 | $1.16 | 4d | 10 | 0.75mi |
| 11523 Vinea Ln Lovejoy, GA | 3.0 | 2.0 | 1557 | $1,850 | $1.19 | 44d | 1 | 0.76mi |
| 11866 Registry Blvd Unit 1 Hampton, GA | 3.0 | 2.0 | 1488 | $1,650 | $1.11 | 24d | 1 | 0.77mi |
| 10903 Thrasher Rd Hampton, GA | 3.0 | 2.0 | 1412 | $1,725 | $1.22 | 22d | 1 | 0.78mi |
| 10784 Knotty Pine Pl Hampton, GA | 3.0 | 2.0 | 1329 | $1,795 | $1.35 | 44d | 1 | 0.78mi |
| 2257 Sugarleaf Trl Lovejoy, GA | 3.0 | 2.0 | 1624 | $1,775 | $1.09 | 44d | 1 | 0.81mi |
| 2056 Registry Pl Lovejoy, GA | 3.0 | 2.0 | 1488 | $1,825 | $1.23 | 44d | 1 | 0.82mi |
| 11664 Flemming Ct Lovejoy, GA | 3.0 | 2.5 | 2025 | $2,060 | $1.02 | 5d | 1 | 0.83mi |
| 11649 Mendenhall Ct Hampton, GA | 3.0 | 2.5 | 1568 | $2,300 | $1.47 | 21d | 1 | 0.86mi |
| 11116 Shadow Creek Ter Hampton, GA | 3.0 | 2.5 | 2195 | $2,035 | $0.93 | 13d | 1 | 0.87mi |
| 11560 Winston Dr Lovejoy, GA | 3.0 | 3.0 | 1710 | $2,710 | $1.58 | 44d | 1 | 0.90mi |
HOA detail
- Monthly dues
- $47 · $564/yr
Listing history 30 events
-
2026-06-09days on market $235,000 Active 28 DOM
-
2026-06-08days on market $235,000 Active 27 DOM
-
2026-06-07days on market $235,000 Active 26 DOM
-
2026-06-04days on market $235,000 Active 23 DOM
-
2026-06-03days on market $235,000 Active 22 DOM
-
2026-06-02days on market $235,000 Active 21 DOM
-
2026-06-01days on market $235,000 Active 20 DOM
-
2026-05-31days on market $235,000 Active 19 DOM
-
2026-05-12$235,000 New 950-char remark
-
2026-05-12$235,000 Active 950-char remark
-
2024-04-27historical $1,695
-
2024-04-13$1,695
-
2024-04-07historical $1,745
-
2024-04-03$1,745
-
2024-03-17historical $1,745
-
2024-03-02$1,745
-
2020-07-14soldstatus $138,500
-
2020-07-10soldstatus $138,500 Closed
Show marketing remark (103 chars)
New Paint inside out, new carpet. Seller never live in the house. No seller disclose and selling as is.
-
2020-07-10soldstatus $138,500 Sold
Show marketing remark (103 chars)
New Paint inside out, new carpet. Seller never live in the house. No seller disclose and selling as is.
-
2020-06-10status Pending
Show marketing remark (103 chars)
New Paint inside out, new carpet. Seller never live in the house. No seller disclose and selling as is.
-
2020-05-28status Under Contract
Show marketing remark (103 chars)
New Paint inside out, new carpet. Seller never live in the house. No seller disclose and selling as is.
-
2020-05-28historical Active Under Contract
Show marketing remark (103 chars)
New Paint inside out, new carpet. Seller never live in the house. No seller disclose and selling as is.
-
2020-05-21price $159,900
Show marketing remark (103 chars)
New Paint inside out, new carpet. Seller never live in the house. No seller disclose and selling as is.
-
2020-05-21price $159,900
Show marketing remark (103 chars)
New Paint inside out, new carpet. Seller never live in the house. No seller disclose and selling as is.
-
2020-04-07price $165,000
Show marketing remark (103 chars)
New Paint inside out, new carpet. Seller never live in the house. No seller disclose and selling as is.
-
2020-04-07price $165,000
Show marketing remark (103 chars)
New Paint inside out, new carpet. Seller never live in the house. No seller disclose and selling as is.
-
2020-03-30price $167,000
Show marketing remark (103 chars)
New Paint inside out, new carpet. Seller never live in the house. No seller disclose and selling as is.
-
2020-03-30price $167,000
Show marketing remark (103 chars)
New Paint inside out, new carpet. Seller never live in the house. No seller disclose and selling as is.
-
2020-02-25$169,500 Active
Show marketing remark (103 chars)
New Paint inside out, new carpet. Seller never live in the house. No seller disclose and selling as is.
-
2020-02-25$169,500 New
Show marketing remark (103 chars)
New Paint inside out, new carpet. Seller never live in the house. No seller disclose and selling as is.
ⓘ Source: listings_history table (triggers on properties + properties_extension) + one-shot
backfill from property_details.listing_events for pre-trigger history.
Tax reassessment forecast GA · Resets to sale price
- Current annual tax
- $3,581 · $298/mo
- Projected year-2 tax
- $3,581 · $298/mo
- Expected delta
- $0/yr ($0/mo · 0.0%)
ⓘ Screening estimate from a state-policy table — verify with the county assessor before closing.
Climate risk First Street
- Flood 1/10 Low FEMA zone X (unshaded) · 0% chance over 30 yrs
- Wildfire 3/10 Moderate
- Heat 6/10 Major 7 d/yr ≥105°F today · 19 d/yr by 30 yrs out
- Wind 6/10 Major 27% chance of damaging wind over 30 yrs
- Air quality 4/10 Moderate 4 unhealthy d/yr today · 5 by 30 yrs out
Nearby sold comps map
Loading sold comps map…
Walkable amenities ~0.75 mi
Loading nearby amenities…
Taxation est. · year 1
- Rental income
- $23,440
- − Mortgage interest
- −$13,164
- − Property taxes
- −$3,581
- − Insurance
- −$1,175
- − Repairs & maintenance
- −$1,875
- − Management
- −$1,875
- − HOA
- −$564
- − Depreciation
- −$6,836
- Taxable loss
- −$5,631
- Est. tax savings @ 24.0%
- +$1,351
- After-tax cash flow
- $-240/yr
For passive investors: Depreciation is non-cash, so a rental often shows a tax loss while cash-flowing — sheltering income. Rental losses are passive: they offset passive income freely, and up to $25,000/yr can offset ordinary (W-2) income if you actively participate and your MAGI is under $100k (phasing out to $0 by $150k); unused losses carry forward. On sale, claimed depreciation is recaptured at up to 25%, and gains may owe capital-gains tax (a 1031 exchange can defer both). Figures are a year-1 estimate at your 24.0% rate — not tax advice; consult a CPA.
Schools (NCES district)
- District
- Clayton County
- NCES district ID
- 1301230
- Math proficiency
- 11% ▼ -13.00%
- Reading proficiency
- 20% ▼ -9.00%
- Median HH income
- $42,266
- Composite
- 13.41/100
- National rank
- #9527
- State rank
- #155 of 174 in GA
Livability — Bonanza
- Score
- 62/100
- State rank
- #314
- US rank
- #16994
Category grades
Schools grade is shown separately in the Schools card above.
Census & demographics
- Census place
- Bonanza, GA
- County
- Henry County · 316,359 people
- City population
- 606
- Metro
- Atlanta-Sandy Springs-Alpharetta, GA
- Population (ZIP)
- 52,402
- Household income
- $82,619
- Rent vs Own
- Severe rent burden
- 1285.0
Population outlook (Clayton County) Hauer SSP2
- Today (2025)
- 310,777 people
- By 2030
- 329,762 · +6.1%
- By 2040
- 368,052 · +18.4%
- By 2050
- 401,196 · +29.1%
- By 2075
- 472,488 · +52.0%
- By 2100
- 500,446 · +61.0%
Race, ethnicity, and origin ACS 2023
- Neighborhood character
- Majority Black (63%)
- Race & ethnicity
- Black 63% White 23% Hispanic / Latino 8% Two or more races 6% Asian 2%
- Hispanic origin (detail)
- Mexican 5% Puerto Rican 1%
- Common ancestry
- Hispanic 4% Lithuanian 1% Italian 1%
- Foreign-born
- 9% · Canada, Vietnam, Jamaica
- Languages at home
- 89% English-only · Spanish 6% French/Haitian/Cajun 2% Vietnamese 1%
Political lean MEDSL · Clayton
- 2024 margin
- Solid D (+69.2) · D 84.3% · R 15.1%
- 2008→2024 swing
- +2.8pp toward D · 2008: 66.4pp · 2024: 69.2pp
- All cycles
- 2024: D+69.2 2020: D+70.9 2016: D+71.9 2012: D+70.1 2008: D+66.4
Not yet ingested
- Civics
- —
Market trends
- HPI YoY
- ▼ -71.11%
- Current HPI
- 222.0357
- Rent YoY
- ▲ 2.20%
- Metro
- Atlanta-Sandy Springs-Alpharetta, GA
- State GDP YoY
- ▲ 2.66%
- F500 in state
- 28
Industry mix (Fortune 500 HQ in GA)
| Industry | F500 HQs | Revenue |
|---|---|---|
| Paper / Packaging | 2 | $29B |
|
||
| Retail | 1 | $160B |
|
||
| Transportation / Logistics | 1 | $91B |
|
||
| Airlines | 1 | $62B |
|
||
| Consumer Goods | 1 | $47B |
|
||
| Utilities | 1 | $25B |
|
||
Price history
+38.6% since first listed24 events — show timeline
- 2026-06-12 Listing Removed — FMLS
- 2026-06-12 Listing Removed — GAMLS
- 2026-05-12 Listed $235,000 FMLS
- 2026-05-12 Listed $235,000 GAMLS
- 2024-04-27 Rental Removed $1,695 RENTLY
- 2024-04-13 Listed for Rent $1,695 RENTLY
- 2024-04-07 Rental Removed $1,745 RENTLY
- 2024-04-03 Listed for Rent $1,745 RENTLY
- 2024-03-17 Rental Removed $1,745 RENTLY
- 2024-03-02 Listed for Rent $1,745 RENTLY
- 2020-07-14 Sold (Public Records) $138,500 Public Records
- 2020-07-10 Sold (MLS) $138,500 GAMLS
- 2020-07-10 Sold (MLS) $138,500 FMLS
- 2020-06-10 Pending — FMLS
- 2020-05-28 Pending — GAMLS
- 2020-05-28 Contingent — FMLS
- 2020-05-21 Price Changed $159,900 GAMLS
- 2020-05-21 Price Changed $159,900 FMLS
- 2020-04-07 Price Changed $165,000 GAMLS
- 2020-04-07 Price Changed $165,000 FMLS
- 2020-03-30 Price Changed $167,000 GAMLS
- 2020-03-30 Price Changed $167,000 FMLS
- 2020-02-25 Listed $169,500 GAMLS
- 2020-02-25 Listed $169,500 FMLS
Property tax history
+7.0%/yrLatest (2025): $3,581 · +15.1% YoY. Source: county tax records.
Cash-flow waterfall
monthlySold comps — $/sqft
last 12 mo · ≤1 miLoading sold comps…