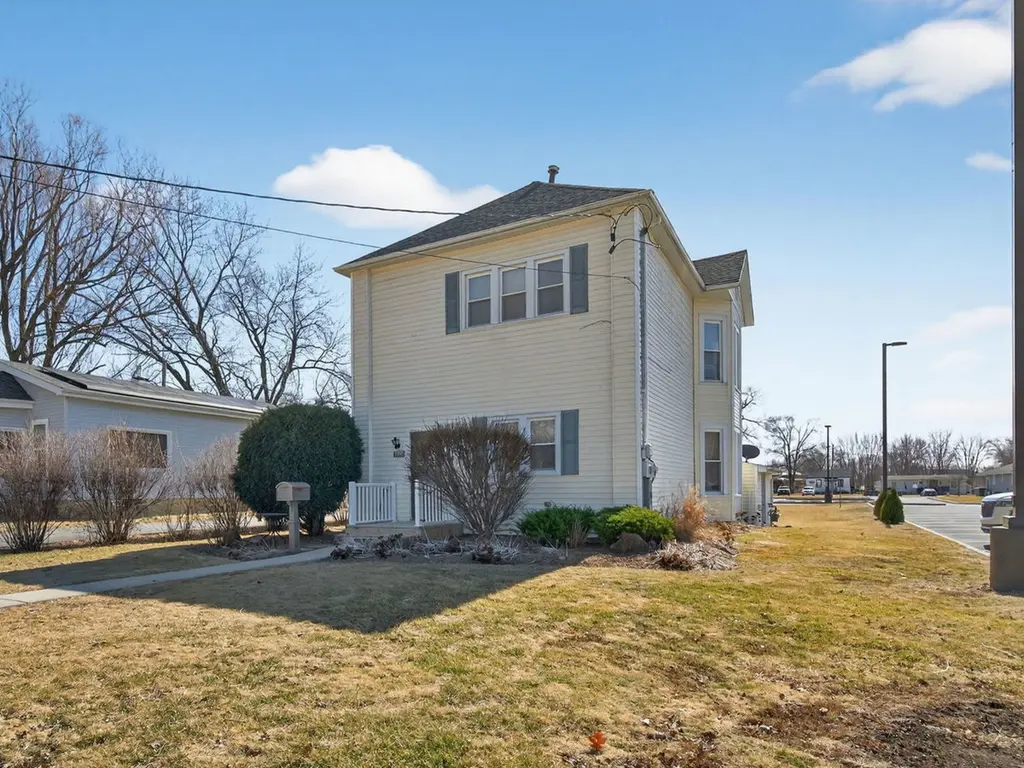
159 E Church St · Coal City, IL
Flood risk 3/10 · Minor
- FEMA flood zone
- X (unshaded)
- Chance of flooding over 30 yrs
- 0.2%
- Est. flood insurance / yr
- $473 – $860
Fire risk 1/10 · Minimal
- Est. fire insurance / yr
- $804 – $1,492
Heat risk 3/10 · Minor
- Hot days now (above 104°F)
- 7 days/yr
- Hot days in 30 yrs
- 16 days/yr
Wind risk 2/10 · Minimal
- Chance of severe wind over 30 yrs
- 1.0%
Air-quality risk 2/10 · Minimal
- Unhealthy air days now
- 1 days/yr
- Unhealthy air days in 30 yrs
- 2 days/yr
Risk factors via First Street. Map © Google.
Why this score? — see what drove the D grade
The composite is a weighted blend of 9 inputs, each scored 0–100. Each bar is that input's sub-score; the figure is the points it added to the 100-point composite (weight × sub-score).
- ARV discount +14.2/15.0
- Cash flow +11.4/30.0
- Schools +4.3/10.0
- Livability +3.8/5.0
- DSCR +3.3/10.0
- 1% rule +2.8/10.0
- Rent growth +2.5/5.0
- Condition / age +2.5/5.0
- Appreciation +0.0/10.0
$247,000
🖨 Deal sheet (PDF) 📄 Offer letter ✓ Due diligence
Listing remarks MLS
Room for everyone! This home offers a versatile layout perfect for related living, extended family, guests, or multi generational living. Main level includes full kitchen, 2 bedrooms and 1.1 baths. The upper level features a full kitchen, 3 bedrooms and 2 full baths.
Key facts
- 0.23 acre lot
- 2 parking spots
- Built 1900
Neighborhood map
What this means for you Summary
Snapshot
- This is a 5-bed/2.0-bath single-family listed at $247k.
Deal economics
- At list price, monthly cash flow is $-86 ($-1k/yr) — negative.
- To cash-flow at today's rent, offer at most $232k (6.1% below list).
- To meet the 1% rule (rent ≥ 1% of price), the offer needs to be $192k (22.4% below list).
- Recommended offer: $192k (22.4% below list) — sets the bar for 1% rule.
- Cap rate 5.9% vs local median 4.3% in Coal City — top-decile yield for the area; either an underpriced asset or a hidden risk that comps aren't pricing in. Stress-test before assuming the spread holds.
Location & tenants
- Location reads 76/100 on livability (#190 in IL, #3,602 nationally) — a middle-class / working-renter tenant base. Strengths: crime A+, housing A+, health & safety A+; Watch: amenities F, commute F.
- Coal City CUSD 1 (town): math 46% / reading 50% proficiency, ranked #65 of 620 in IL (top 10%) — families likely to look elsewhere, expect single-tenant / working-renter base with shorter leases.
- Zoned schools: Coal City Early Childhood Center (413 students, 0% FRL); Coal City Middle School (math 50% / reading 55%, grade C+, #40 of 665 statewide, top 6%, 494 students, 0% FRL); Coal City High School (math 32% / reading 32%, grade F, #157 of 693 statewide, top 25%, 631 students, 0% FRL) — zoned schools average 0% FRL vs 23% district-wide (23 pts lower); this property's tenant base skews higher-income than the district average.
- Market conditions: 41 active listings in the ZIP; 84 units permitted in Grundy County in 2024 (0 in 5+ unit buildings).
Forward outlook
- Local home prices are declining (-3.0%/yr); year-one equity from $2k of loan paydown is wiped out by about $7k of value loss. Plan a longer hold.
- Grundy County population projected to shrink 9% by 2050 — rents likely to lag national; underwrite the cash flow, not the appreciation.
Negotiation context
- It's been on market 109 days — a 9% lower offer ($225k) is reasonable based on typical stale-listing flexibility.
- 7 sale attempts since 19y ago with the ask held roughly flat each time — persistent listings suggest the price (not the market) is what's stuck; bring a comps-based counter.
- Current owner paid $205k; 20% above their basis — modest negotiation headroom, anchor on the comps not their cost.
Risks & watch-outs
- Watch-outs: built in 1900 — expect roof / HVAC / electrical / plumbing capex.
Questions for the listing agent
- What do current leases actually rent for vs. the listed asking? Can we see a recent rent roll and the last 12 months of T-12 income?
- It's been on market 109 days. Have you received any prior offers? Is the seller open to a 22% concession, seller financing, or rate buy-down credit?
- Built in 1900 — when were the roof, HVAC, electrical panel, plumbing, and water heater last replaced?
- Why hasn't it sold? Are there any deal-killer items the seller is aware of (foundation, flood, title, zoning, code violations)?
- Is there a deadline driving the sale (1031 exchange, divorce, estate, relocation)? That informs how much negotiation room exists.
- The area grade is low — what's the realistic commute time and amenity access for the typical tenant pool here? Any planned neighborhood developments (good or bad) we should know about?
- What's the average days-on-market for RENTAL listings here right now (not sales)? A rising rental-DOM trend means longer vacancies and softer asking-rent achievability than the comps imply.
- What's the recent tenant-quality profile in this submarket — average credit score on applications, eviction rate, late-payment / NSF rate, and stable-employment percentage? A property-management company in the area should have these aggregated.
- How much new for-sale + rental construction is in the pipeline within 1–3 miles? Heavy new supply typically softens prices + rents 12–24 months out; constrained supply supports both.
Investment metrics
- 1% rule
- 0.78% ✗
- Cap rate
- 5.88%
- Cash-on-cash
- -1.49%
- DSCR
- 0.93
- GRM
- 10.7
CMA / ARV
- ARV (median comp)
- $290,324
- List price
- $247,000
- Delta
- -14.92%
- Verdict
- UNDERPRICED
- Comps
- 20 within 1.0 mi
Show comp detail 7 sales within ~0.75 mi
| Address | Dist | Beds/Ba | Sqft | Sold | Price | $/sf | Match |
|---|---|---|---|---|---|---|---|
| 170 E Church St | 0.03mi | 4/3.0 (-1) | 2,079 (-0%) | 11mo | $137,500 | $66 | 80 |
| 495 Trotter Dr | 0.71mi | 4/1.5 (-1) | 2,027 (-2%) | 6mo | $271,000 | $134 | 51 |
| 120 E Elm St | 0.52mi | 4/2.0 (-1) | 2,311 (+11%) | 6mo | $372,500 | $161 | 48 |
| 981 S Foxgrove Dr | 0.75mi | 4/2.5 (-1) | 2,041 (-2%) | 20mo | $300,000 | $147 | 39 |
| 100 W 1st St | 0.35mi | 4/3.5 (-1) | 2,316 (+11%) | 18mo | $350,000 | $151 | 38 |
| 380 E 2nd St | 0.39mi | 4/3.5 (-1) | 1,800 (-14%) | 16mo | $365,000 | $203 | 35 |
| 170 W 1st St | 0.41mi | 4/2.5 (-1) | 2,384 (+15%) | 18mo | $365,000 | $153 | 34 |
Match score weights: distance 35% · size 25% · config 20% · recency 20%. Top-matched comps best support the ARV.
Projected returns pro-forma
-3.0% appreciation · 3.0% rent growth · sell at horizon
- IRR
- -18.8%
- Equity multiple
- 0.34×
- Total profit
- $-45,518
- Equity at exit
- $36,829
- IRR
- -11.3%
- Equity multiple
- 0.32×
- Total profit
- $-46,813
- Equity at exit
- $21,356
Cash invested: $69,160 (down + closing). Projections, not guarantees.
Landlord ↔ Tenant lean methodology
- Overall (STATE)
- 43 Moderately Tenant-Leaning
- State Illinois
- 43 Moderately Tenant-Leaning · D+7
- County
- — inherits STATE
- City
- — inherits STATE
ZIP-level market 60416
- Active inventory
- 41
- Price-to-rent
- 10.7×
Monthly cashflow live
- Estimated rent
- $1,917 medium interval (Pro) →
- Mortgage (P&I)
- −$1,295
- Tax from tax record
- −$202 /mo · $2,422/yr
- Insurance
- −$103
- HOA
- −$0
- Vacancy / Maint / Mgmt
- −$403
- Net cashflow
- $-86
Break-even live
Sensitivity live
| Price | -10% $54 | -5% $-16 | +0% $-86 | +5% $-156 | +10% $-225 |
|---|---|---|---|---|---|
| Rent | -10% $-237 | -5% $-161 | +0% $-86 | +5% $-10 | +10% $66 |
| Rate | -1.0pp $39 | -0.5pp $-23 | base $-86 | +0.5pp $-150 | +1.0pp $-215 |
UW: 25.0% down · 7.5% · 30yr · 1.5% tax · 5.0% vac · 8.0% maint · 8.0% mgmt
Financing live
Cash to close
- Down payment
- $61,750
- Closing costs
- $7,410
- Reserves months
- —
- Total cash needed
- —
Loan-product check · same deal, 3 products live
Conventional
25% down · 7.5% · 30yr
- Down + closing
- —
- Monthly P&I
- —
- Monthly cashflow
- —
- DSCR
- —
- Eligible?
- —
Personal DTI + credit; lowest rate.
DSCR
20% down · 8.5% · 30yr
- Down + closing
- —
- Monthly P&I
- —
- Monthly cashflow
- —
- DSCR
- —
- Eligible?
- —
No personal income docs; deal must DSCR.
Hard money
10% down · 12.0% · 12mo
- Down + closing
- —
- Monthly P&I
- —
- Monthly cashflow
- —
- DSCR
- —
- Eligible?
- —
Short-term bridge; refi at stabilization.
Listing history 31 events
-
2026-06-21days on market $247,000 Active 109 DOM
-
2026-06-18days on market $247,000 Active 106 DOM
-
2026-06-17days on market $247,000 Active 105 DOM
-
2026-06-16days on market $247,000 Active 104 DOM
-
2026-06-15days on market $247,000 Active 103 DOM
-
2026-06-13days on market $247,000 Active 101 DOM
-
2026-06-13days on market $247,000 Active 100 DOM
-
2026-06-09days on market $247,000 Active 97 DOM
-
2026-06-08days on market $247,000 Active 96 DOM
-
2026-06-07days on market $247,000 Active 95 DOM
-
2026-06-04days on market $247,000 Active 92 DOM
-
2026-06-03days on market $247,000 Active 91 DOM
-
2026-06-02days on market $247,000 Active 90 DOM
-
2026-06-01days on market $247,000 Active 89 DOM
-
2026-05-31days on market $247,000 Active 88 DOM
-
2026-03-31price $250,000 267-char remark
Show marketing remark (267 chars)
Room for everyone! This home offers a versatile layout perfect for related living, extended family, guests, or multi generational living. Main level includes full kitchen, 2 bedrooms and 1.1 baths. The upper level features a full kitchen, 3 bedrooms and 2 full baths.
-
2026-03-09status Active 267-char remark
Show marketing remark (267 chars)
Room for everyone! This home offers a versatile layout perfect for related living, extended family, guests, or multi generational living. Main level includes full kitchen, 2 bedrooms and 1.1 baths. The upper level features a full kitchen, 3 bedrooms and 2 full baths.
-
2026-03-04historical Contingent - No Showings 267-char remark
Show marketing remark (267 chars)
Room for everyone! This home offers a versatile layout perfect for related living, extended family, guests, or multi generational living. Main level includes full kitchen, 2 bedrooms and 1.1 baths. The upper level features a full kitchen, 3 bedrooms and 2 full baths.
-
2026-03-04$255,000 Active 267-char remark
Show marketing remark (267 chars)
Room for everyone! This home offers a versatile layout perfect for related living, extended family, guests, or multi generational living. Main level includes full kitchen, 2 bedrooms and 1.1 baths. The upper level features a full kitchen, 3 bedrooms and 2 full baths.
-
2009-09-30historical
-
2009-07-21New
-
2009-07-21historical
-
2009-04-24price
-
2009-01-24
-
2008-11-06historical
-
2008-05-05
-
2008-04-26historical
-
2007-10-27
-
2007-09-04historical
-
2007-03-04
-
2006-01-19soldstatus $205,000
ⓘ Source: listings_history table (triggers on properties + properties_extension) + one-shot
backfill from property_details.listing_events for pre-trigger history.
Tax reassessment forecast IL · Partial reset (capped growth)
- Current annual tax
- $2,422 · $202/mo
- Projected year-2 tax
- $4,014 · $335/mo
- Expected delta
- +$1,592/yr (+$133/mo · 65.7%)
ⓘ Screening estimate from a state-policy table — verify with the county assessor before closing.
Climate risk First Street
- Flood 3/10 Moderate FEMA zone X (unshaded) · 20% chance over 30 yrs
- Wildfire 1/10 Low
- Heat 3/10 Moderate 7 d/yr ≥104°F today · 16 d/yr by 30 yrs out
- Wind 2/10 Low 100% chance of damaging wind over 30 yrs
- Air quality 2/10 Low 1 unhealthy d/yr today · 2 by 30 yrs out
Nearby sold comps map
Loading sold comps map…
Walkable amenities ~0.75 mi
Loading nearby amenities…
Taxation est. · year 1
- Rental income
- $23,003
- − Mortgage interest
- −$13,836
- − Property taxes
- −$2,422
- − Insurance
- −$1,235
- − Repairs & maintenance
- −$1,840
- − Management
- −$1,840
- − Depreciation
- −$7,185
- Taxable loss
- −$5,356
- Est. tax savings @ 24.0%
- +$1,285
- After-tax cash flow
- $257/yr
For passive investors: Depreciation is non-cash, so a rental often shows a tax loss while cash-flowing — sheltering income. Rental losses are passive: they offset passive income freely, and up to $25,000/yr can offset ordinary (W-2) income if you actively participate and your MAGI is under $100k (phasing out to $0 by $150k); unused losses carry forward. On sale, claimed depreciation is recaptured at up to 25%, and gains may owe capital-gains tax (a 1031 exchange can defer both). Figures are a year-1 estimate at your 24.0% rate — not tax advice; consult a CPA.
Schools (NCES district)
- District
- Coal City CUSD 1
- NCES district ID
- 1710530
- Math proficiency
- 46% ▬ 0.00%
- Reading proficiency
- 50% ▼ -7.00%
- Median HH income
- $67,347
- Composite
- 42.77/100
- National rank
- #3151
- State rank
- #65 of 620 in IL
Livability — Coal City
- Score
- 76/100
- State rank
- #190
- US rank
- #3602
Category grades
Schools grade is shown separately in the Schools card above.
Census & demographics
- Census place
- Coal City, IL
- City population
- 9,277
- Population (ZIP)
- 9,277
Population outlook (Grundy County) Hauer SSP2
- Today (2025)
- 50,716 people
- By 2030
- 50,218 · -1.0%
- By 2040
- 48,599 · -4.2%
- By 2050
- 46,212 · -8.9%
- By 2075
- 40,033 · -21.1%
- By 2100
- 32,966 · -35.0%
Race, ethnicity, and origin ACS 2023
- Neighborhood character
- Predominantly White (91%)
- Race & ethnicity
- White 91% Hispanic / Latino 7% Two or more races 3%
- Hispanic origin (detail)
- Mexican 6%
- Common ancestry
- Romanian 12% Iranian 4% Portuguese 3%
- Foreign-born
- 2% · Canada
- Languages at home
- 96% English-only · Spanish 3%
Political lean MEDSL · Grundy
- 2024 margin
- Strong R (+29.6) · D 34.5% · R 64.0% · Other 1.5%
- 2008→2024 swing
- -31.3pp toward R · 2008: 1.7pp · 2024: -29.6pp
- All cycles
- 2024: R+29.6 2020: R+25.8 2016: R+23.6 2012: R+9.0 2008: D+1.7
Not yet ingested
- Civics
- —
Market trends
- HPI YoY
- ▼ -129.40%
- Current HPI
- 154.913
- Rent YoY
- —
- Metro
- —
- State GDP YoY
- ▲ 1.59%
- F500 in state
- 60
Industry mix (Fortune 500 HQ in IL)
| Industry | F500 HQs | Revenue |
|---|---|---|
| Insurance | 4 | $201B |
|
||
| Consumer Goods | 4 | $87B |
|
||
| Industrial Machinery | 3 | $64B |
|
||
| Healthcare | 2 | $55B |
|
||
| Retail / Pharmacy | 1 | $148B |
|
||
| Agriculture / Food | 1 | $86B |
|
||
Price history
+22.0% since first listed16 events — show timeline
- 2026-03-31 Price Changed $250,000 MRED as Distributed by MLS Grid
- 2026-03-09 Relisted — MRED as Distributed by MLS Grid
- 2026-03-04 Contingent — MRED as Distributed by MLS Grid
- 2026-03-04 Listed $255,000 MRED as Distributed by MLS Grid
- 2009-09-30 Listing Removed — MRED as Distributed by MLS Grid
- 2009-07-21 Listed — MRED as Distributed by MLS Grid
- 2009-07-21 Listing Removed — MRED as Distributed by MLS Grid
- 2009-04-24 Price Changed — MRED as Distributed by MLS Grid
- 2009-01-24 Listed — MRED as Distributed by MLS Grid
- 2008-11-06 Listing Removed — MRED as Distributed by MLS Grid
- 2008-05-05 Listed — MRED as Distributed by MLS Grid
- 2008-04-26 Listing Removed — MRED as Distributed by MLS Grid
- 2007-10-27 Listed — MRED as Distributed by MLS Grid
- 2007-09-04 Listing Removed — MRED as Distributed by MLS Grid
- 2007-03-04 Listed — MRED as Distributed by MLS Grid
- 2006-01-19 Sold (Public Records) $205,000 Public Records
Property tax history
+4.6%/yrLatest (2024): $2,422 · +7.0% YoY. Source: county tax records.
Cash-flow waterfall
monthlySold comps — $/sqft
last 12 mo · ≤1 miLoading sold comps…