1103 Sky Forest Ln · Crandall, TX
Flood risk No data
- FEMA flood zone
- —
- Chance of flooding over 30 yrs
- —
- Est. flood insurance / yr
- —
Fire risk No data
- Est. fire insurance / yr
- —
Heat risk No data
- Hot days now (above threshold)
- —
- Hot days in 30 yrs
- —
Wind risk No data
- Chance of severe wind over 30 yrs
- —
Air-quality risk No data
- Unhealthy air days now
- —
- Unhealthy air days in 30 yrs
- —
Risk factors via First Street. Map © Google.
Why this score? — see what drove the D+ grade
The composite is a weighted blend of 9 inputs, each scored 0–100. Each bar is that input's sub-score; the figure is the points it added to the 100-point composite (weight × sub-score).
- Cash flow +17.1/30.0
- ARV discount +7.5/15.0
- DSCR +5.3/10.0
- 1% rule +3.7/10.0
- Schools +3.6/10.0
- Livability +3.4/5.0
- Rent growth +2.5/5.0
- Condition / age +2.5/5.0
- Appreciation +0.0/10.0
$288,049
🖨 Deal sheet 📄 Offer letter ✓ Due diligence
Listing remarks
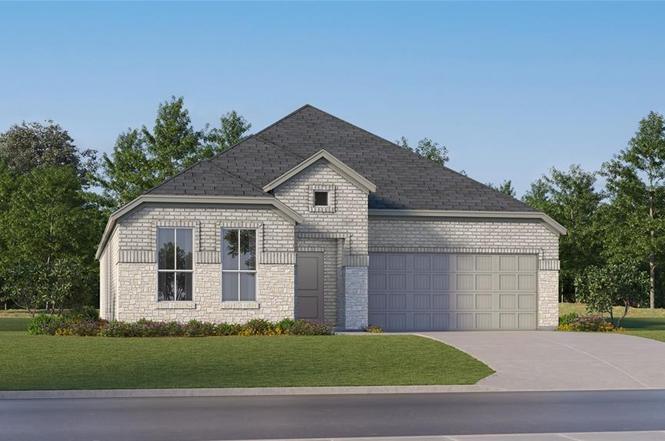
LENNAR - Arbors at Eastland - Joplin Floorplan - This single-story home shares an open layout between the kitchen, nook and family room for easy entertaining, along with access to the covered patio for year-round outdoor lounging. A luxe owner's suite is in a rear of the home and comes complete with an en-suite bathroom and walk-in closet. There are two secondary bedrooms at the front of the home, ideal for household members and overnight guests. Prices, dimensions and features may vary and are subject to change. Photos are for illustrative purposes only.
Key facts
- Walk-in closet
- Open layout
- Covered patio
Tags
Neighborhood map
What this means for you Summary
Snapshot
- This is a 3-bed/2.0-bath land listed at $288k.
Deal economics
- At list price, monthly cash flow is $200 ($2k/yr) — positive.
- The deal already cash-flows at list — no discount required.
- To meet the 1% rule (rent ≥ 1% of price), the offer needs to be $250k (13.1% below list).
- Recommended offer: $250k (13.1% below list) — sets the bar for 1% rule.
- Cap rate 7.1% vs local median 5.3% in Crandall — top-decile yield for the area; either an underpriced asset or a hidden risk that comps aren't pricing in. Stress-test before assuming the spread holds.
Location & tenants
- Location reads 68/100 on livability (#507 in TX) — a middle-class / working-renter tenant base. Strengths: employment A+, cost of living A+, housing A+; Watch: crime F, amenities F, commute F.
- Crandall ISD (rural): math 36% / reading 42% proficiency, ranked #351 of 826 in TX (top 42%) — families likely to look elsewhere, expect single-tenant / working-renter base with shorter leases.
- Zoned schools: Barbara Walker El (math 35% / reading 36%, grade F, #1,946 of 4,322 statewide, top 45%, 663 students, 67% FRL) — zoned schools average 67% FRL vs 41% district-wide (26 pts higher); higher-poverty schools than district average — tighter screening recommended.
- Market conditions: 787 active listings in the ZIP; 4 comparable units currently listed for rent nearby; rentals lingering (median 44d on market — plan ~5-8 weeks vacancy on turnover, expect pricing pressure); 50% of comp listings sitting > 30 days — soft ceiling on asking rent; solid renter incomes; 1,747 units permitted in Kaufman County in 2024 (180 in 5+ unit buildings).
- This rent runs 34% of the median local income ($88k/yr) — at the standard rent-burdened threshold; future hikes will face affordability resistance.
Forward outlook
- Local home prices are declining (-3.0%/yr); year-one equity from $2k of loan paydown is wiped out by about $9k of value loss. Plan a longer hold.
- Kaufman County population projected at +43% by 2050 — long-run rental-demand tailwind backs the buy-and-hold thesis.
Negotiation context
- It's been on market 50 days — a 3% lower offer ($279k) is reasonable based on typical stale-listing flexibility.
Questions for the listing agent
- It's been on market 50 days. Have you received any prior offers? Is the seller open to a 13% concession, seller financing, or rate buy-down credit?
- What does the HOA fee cover, when was the last increase, and are there any pending special assessments or reserve-fund shortfalls?
- Is there a deadline driving the sale (1031 exchange, divorce, estate, relocation)? That informs how much negotiation room exists.
- Schools are B-rated — typically a magnet for longer-tenancy family renters. What's the average tenant stay here, and is there a school-zone premium baked into asking?
- Crime grade is F in this area — have there been break-ins, vandalism, or insurance claims at this property in the last 3 years? What carrier currently insures it and at what premium?
- The area grade is low — what's the realistic commute time and amenity access for the typical tenant pool here? Any planned neighborhood developments (good or bad) we should know about?
- What's the average days-on-market for RENTAL listings here right now (not sales)? A rising rental-DOM trend means longer vacancies and softer asking-rent achievability than the comps imply.
- What's the recent tenant-quality profile in this submarket — average credit score on applications, eviction rate, late-payment / NSF rate, and stable-employment percentage? A property-management company in the area should have these aggregated.
- How much new for-sale + rental construction is in the pipeline within 1–3 miles? Heavy new supply typically softens prices + rents 12–24 months out; constrained supply supports both.
Investment metrics
- 1% rule
- 0.87% ✗
- Cap rate
- 7.13%
- Cash-on-cash
- 2.98%
- DSCR
- 1.13
- GRM
- 9.6
CMA / ARV
No comps found within radius.
Projected returns pro-forma
-3.0% appreciation · 3.0% rent growth · sell at horizon
- IRR
- -11.6%
- Equity multiple
- 0.58×
- Total profit
- $-34,026
- Equity at exit
- $42,949
- IRR
- -2.5%
- Equity multiple
- 0.83×
- Total profit
- $-13,598
- Equity at exit
- $24,905
Cash invested: $80,654 (down + closing). Projections, not guarantees.
Landlord ↔ Tenant lean methodology
- Overall (STATE)
- 87 Strongly Landlord-Friendly
- State Texas
- 87 Strongly Landlord-Friendly · R+5
- County
- — inherits STATE
- City
- — inherits STATE
ZIP-level market 75114
- Home prices YoY
- -26.7%
- Active inventory
- 787
- Price-to-rent
- 9.6×
Monthly cashflow live
- Estimated rent
- $2,504 medium interval (Pro) →
- Mortgage (P&I)
- −$1,511
- Tax from tax record
- −$105 /mo · $1,264/yr
- Insurance
- −$120
- HOA
- −$42
- Vacancy / Maint / Mgmt
- −$526
- Net cashflow
- $200
Break-even live
UW: 25.0% down · 7.5% · 30yr · 1.5% tax · 5.0% vac · 8.0% maint · 8.0% mgmt
Financing live
Cash to close
- Down payment
- $72,012
- Closing costs
- $8,641
- Reserves months
- —
- Total cash needed
- —
Loan-product check · same deal, 3 products live
Conventional
25% down · 7.5% · 30yr
- Down + closing
- —
- Monthly P&I
- —
- Monthly cashflow
- —
- DSCR
- —
- Eligible?
- —
Personal DTI + credit; lowest rate.
DSCR
20% down · 8.5% · 30yr
- Down + closing
- —
- Monthly P&I
- —
- Monthly cashflow
- —
- DSCR
- —
- Eligible?
- —
No personal income docs; deal must DSCR.
Hard money
10% down · 12.0% · 12mo
- Down + closing
- —
- Monthly P&I
- —
- Monthly cashflow
- —
- DSCR
- —
- Eligible?
- —
Short-term bridge; refi at stabilization.
Rent comps 4 comps
| Address | Beds | Baths | Sqft | Rent | $/sqft | DOM | Units | Dist |
|---|---|---|---|---|---|---|---|---|
| 2204 Boiling Springs Rd Crandall, TX | 3.0–4.0 | 2.0 | 1497 | $2,131 | $1.42 | 1d | 5 | 1.22mi |
| 3147 Blossom Trl Crandall, TX | 4.0 | 3.0 | 2177 | $2,700 | $1.24 | 43d | 1 | 1.33mi |
| 4101 Valley Mills Dr Crandall, TX | 4.0 | 2.5 | 2278 | $2,550 | $1.12 | 1d | 1 | 1.35mi |
| 3028 Willow Wood Ct Crandall, TX | 3.0 | 2.5 | 1764 | $2,600 | $1.47 | 43d | 1 | 1.42mi |
HOA detail
- Monthly dues
- $42 · $504/yr
Listing history 5 events
-
2026-02-25status Pending
-
2026-02-24price $288,049
-
2026-02-13price $289,099
-
2026-02-06price $291,099
-
2026-01-06$297,099 Active
ⓘ Source: listings_history table (triggers on properties + properties_extension) + one-shot
backfill from property_details.listing_events for pre-trigger history.
Tax reassessment forecast TX · Resets to sale price
- Current annual tax
- $1,264 · $105/mo
- Projected year-2 tax
- $5,271 · $439/mo
- Expected delta
- +$4,008/yr (+$334/mo · 317.1%)
ⓘ Screening estimate from a state-policy table — verify with the county assessor before closing.
Nearby sold comps map
Loading sold comps map…
Walkable amenities ~0.75 mi
Loading nearby amenities…
Taxation est. · year 1
- Rental income
- $30,045
- − Mortgage interest
- −$16,135
- − Property taxes
- −$1,264
- − Insurance
- −$1,440
- − Repairs & maintenance
- −$2,404
- − Management
- −$2,404
- − HOA
- −$504
- − Depreciation
- −$8,380
- Taxable loss
- −$2,485
- Est. tax savings @ 24.0%
- +$596
- After-tax cash flow
- $2,997/yr
For passive investors: Depreciation is non-cash, so a rental often shows a tax loss while cash-flowing — sheltering income. Rental losses are passive: they offset passive income freely, and up to $25,000/yr can offset ordinary (W-2) income if you actively participate and your MAGI is under $100k (phasing out to $0 by $150k); unused losses carry forward. On sale, claimed depreciation is recaptured at up to 25%, and gains may owe capital-gains tax (a 1031 exchange can defer both). Figures are a year-1 estimate at your 24.0% rate — not tax advice; consult a CPA.
Schools (NCES district)
- District
- Crandall ISD
- NCES district ID
- 4815510
- Math proficiency
- 36% ▼ -13.00%
- Reading proficiency
- 42% ▼ -8.00%
- Median HH income
- $70,076
- Composite
- 35.57/100
- National rank
- #4901
- State rank
- #351 of 826 in TX
Livability — Crandall
- Score
- 68/100
- State rank
- #507
- US rank
- #10022
Category grades
Schools grade is shown separately in the Schools card above.
Census & demographics
- County
- Kaufman County · 122,338 people
- City population
- 9,333
- Metro
- Dallas-Fort Worth-Arlington, TX
- Population (ZIP)
- 9,333
- Household income
- $88,013
- Rent vs Own
- Severe rent burden
- 33.0
Population outlook (Kaufman County) Hauer SSP2
- Today (2025)
- 138,716 people
- By 2030
- 150,815 · +8.7%
- By 2040
- 174,877 · +26.1%
- By 2050
- 198,020 · +42.8%
- By 2075
- 251,908 · +81.6%
- By 2100
- 285,325 · +105.7%
Race, ethnicity, and origin ACS 2023
- Neighborhood character
- Diverse neighborhood (Simpson 0.62)
- Race & ethnicity
- White 48% Hispanic / Latino 36% Two or more races 14% Black 14%
- Hispanic origin (detail)
- Mexican 34%
- Common ancestry
- Slovak 1%
- Foreign-born
- 18% · Canada, China
- Languages at home
- 71% English-only · Spanish 27% Other Indo-European 1%
Political lean MEDSL · Kaufman
- 2024 margin
- Strong R (+27.9) · D 35.6% · R 63.5%
- 2008→2024 swing
- +7.9pp toward D · 2008: -35.8pp · 2024: -27.9pp
- All cycles
- 2024: R+27.9 2020: R+33.9 2016: R+47.0 2012: R+44.4 2008: R+35.8
Not yet ingested
- Civics
- —
Market trends
- HPI YoY
- ▼ -71.61%
- Current HPI
- 196.4773
- Rent YoY
- —
- Metro
- Dallas-Fort Worth-Arlington, TX
- State GDP YoY
- ▲ 3.95%
- F500 in state
- 110
Industry mix (Fortune 500 HQ in TX)
| Industry | F500 HQs | Revenue |
|---|---|---|
| Energy | 16 | $1,198B |
|
||
| Technology | 5 | $198B |
|
||
| Engineering / Construction | 4 | $72B |
|
||
| Energy Services | 3 | $60B |
|
||
| Utilities | 3 | $41B |
|
||
| Healthcare | 2 | $330B |
|
||
Price history
-3.0% since first listed5 events — show timeline
- 2026-02-25 Pending — NTREIS
- 2026-02-24 Price Changed $288,049 NTREIS
- 2026-02-13 Price Changed $289,099 NTREIS
- 2026-02-06 Price Changed $291,099 NTREIS
- 2026-01-06 Listed $297,099 NTREIS
Cash-flow waterfall
monthlySold comps — $/sqft
last 12 mo · ≤1 miLoading sold comps…