58 Canal St · Enfield, NC
Flood risk 1/10 · Minimal
- FEMA flood zone
- X (unshaded)
- Chance of flooding over 30 yrs
- 0.0%
- Est. flood insurance / yr
- $473 – $860
Fire risk 3/10 · Minor
- Est. fire insurance / yr
- $906 – $1,684
Heat risk 7/10 · Major
- Hot days now (above 107°F)
- 7 days/yr
- Hot days in 30 yrs
- 16 days/yr
Wind risk 6/10 · Moderate
- Chance of severe wind over 30 yrs
- 67.0%
Air-quality risk 1/10 · Minimal
- Unhealthy air days now
- 0 days/yr
- Unhealthy air days in 30 yrs
- 0 days/yr
Risk factors via First Street. Map © Google.
Why this score? — see what drove the B grade
The composite is a weighted blend of 9 inputs, each scored 0–100. Each bar is that input's sub-score; the figure is the points it added to the 100-point composite (weight × sub-score).
- Cash flow +30.0/30.0
- 1% rule +10.0/10.0
- DSCR +10.0/10.0
- Appreciation +7.9/10.0
- ARV discount +7.5/15.0
- Livability +3.0/5.0
- Rent growth +2.5/5.0
- Condition / age +2.5/5.0
- Schools +1.2/10.0
$59,000
🖨 Deal sheet 📄 Offer letter ✓ Due diligence
Listing remarks MLS
ONLINE AUCTION Cash, AS IS terms. One of 46 Enfield properties in an investment portfolio. Go to our website for all addresses. Price shown is value range only, name your price at auction or early offer.
Key facts
- 0.52 acre lot
- Built 1996
- Listed 30 days
Property features AI
Finance
- Other: Lot size approximately 0.52 acres
- HOA & community: No homeowners association
Exterior
- Utilities: Public water; Community sewer; Sewer and water connected
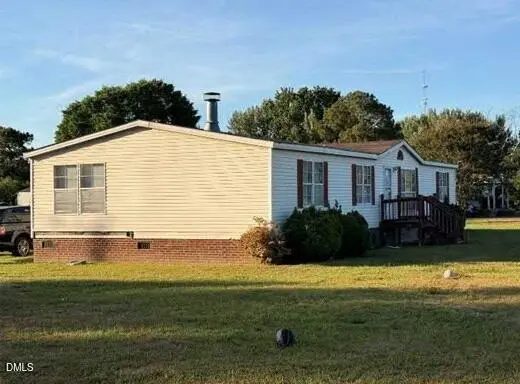
- Home design: Manufactured double-wide home; One story
- Construction: Vinyl siding; Brick/mortar foundation; Aluminum roof; Built as a manufactured house
- Exterior features: Cleared lot; Publicly maintained asphalt road access; Not waterfront
Interior
- Bedrooms: Three bedrooms (all on the main level)
- Flooring: Carpet; Vinyl
- Bathrooms: Two full bathrooms
- Heating & cooling: Electric heating; Central air conditioning
- Interior features: Carpet and vinyl flooring
Neighborhood map
What this means for you Summary
Snapshot
- This is a 3-bed/2.0-bath manufactured listed at $59k.
Deal economics
- At list price, monthly cash flow is $487 ($6k/yr) — positive.
- The deal already cash-flows at list — no discount required.
- Meets the 1% rule at list price ($1k rent vs $59k).
- Recommended offer: $57k (3.0% below list) — sets the bar for market timing.
Location & tenants
- Location reads 59/100 on livability (#556 in NC) — a working-class tenant base; expect higher turnover. Strengths: cost of living A+, health & safety A, crime B; Watch: schools F, amenities F, commute F.
- Halifax County Schools (rural): math 6% / reading 24% proficiency, ranked #177 of 178 in NC (top 99%) — low school quality limits family demand, transient renter base, plan for 1-2y turnover; 82% free/reduced lunch — lower-income household profile, screen leases tightly.
- Market conditions: 28 active listings in the ZIP; 55 units permitted in Halifax County in 2024 (0 in 5+ unit buildings).
Forward outlook
- In year one you build about $4k of equity ($408 loan paydown + $3k appreciation (5.8% local appreciation)).
- Halifax County population projected at -27% by 2050 — secular population decline; favor cash flow + early exit over multi-decade hold.
- At projected returns (5.8% appreciation + 3.0% rent growth), your $17k cash investment doubles in ~2 years — after that, you're playing with house money.
- By year 9, paydown + projected appreciation supports a ~$34k cash-out refi (75% LTV) — recoverable capital for the next deal without selling this one.
Negotiation context
- It's been on market 31 days — a 3% lower offer ($57k) is reasonable based on typical stale-listing flexibility.
- 2 sale attempts with the ask held roughly flat each time — persistent listings suggest the price (not the market) is what's stuck; bring a comps-based counter.
Risks & watch-outs
- Climate carrying-cost: major wind risk, 67% chance of damaging wind over 30y; extreme-heat days projected 7→16/yr by 2055 (HVAC capex compounding) — expect insurance premiums to compound above CPI over the hold.
Questions for the listing agent
- It's been on market 31 days. Have you received any prior offers? Is the seller open to a 3% concession, seller financing, or rate buy-down credit?
- Is there a deadline driving the sale (1031 exchange, divorce, estate, relocation)? That informs how much negotiation room exists.
- Schools are F-rated, which usually means shorter tenancies and higher turnover. Who's the typical renter profile here, and what's been the actual vacancy rate?
- What's the average days-on-market for RENTAL listings here right now (not sales)? A rising rental-DOM trend means longer vacancies and softer asking-rent achievability than the comps imply.
- What's the recent tenant-quality profile in this submarket — average credit score on applications, eviction rate, late-payment / NSF rate, and stable-employment percentage? A property-management company in the area should have these aggregated.
- How much new for-sale + rental construction is in the pipeline within 1–3 miles? Heavy new supply typically softens prices + rents 12–24 months out; constrained supply supports both.
Investment metrics
- 1% rule
- 1.95% ✓
- Cap rate
- 16.20%
- Cash-on-cash
- 35.39%
- DSCR
- 2.57
- GRM
- 4.3
CMA / ARV
No comps found within radius.
Projected returns pro-forma
5.76% appreciation · 3.0% rent growth · sell at horizon
- IRR
- 45.3%
- Equity multiple
- 3.86×
- Total profit
- $47,247
- Equity at exit
- $36,189
- IRR
- 42.5%
- Equity multiple
- 7.96×
- Total profit
- $114,961
- Equity at exit
- $64,863
Cash invested: $16,520 (down + closing). Projections, not guarantees.
Landlord ↔ Tenant lean methodology
- Overall (STATE)
- 85 Strongly Landlord-Friendly
- State North Carolina
- 85 Strongly Landlord-Friendly · R+3
- County
- — inherits STATE
- City
- — inherits STATE
ZIP-level market 27823
- Home prices YoY
- 3.1%
- Active inventory
- 28
- Price-to-rent
- 4.3×
Monthly cashflow live
- Estimated rent
- $1,149 medium interval (Pro) →
- Mortgage (P&I)
- −$309
- Tax from tax record
- −$87 /mo · $1,040/yr
- Insurance
- −$25
- HOA
- −$0
- Vacancy / Maint / Mgmt
- −$241
- Net cashflow
- $487
Break-even live
UW: 25.0% down · 7.5% · 30yr · 1.5% tax · 5.0% vac · 8.0% maint · 8.0% mgmt
Financing live
Cash to close
- Down payment
- $14,750
- Closing costs
- $1,770
- Reserves months
- —
- Total cash needed
- —
Loan-product check · same deal, 3 products live
Conventional
25% down · 7.5% · 30yr
- Down + closing
- —
- Monthly P&I
- —
- Monthly cashflow
- —
- DSCR
- —
- Eligible?
- —
Personal DTI + credit; lowest rate.
DSCR
20% down · 8.5% · 30yr
- Down + closing
- —
- Monthly P&I
- —
- Monthly cashflow
- —
- DSCR
- —
- Eligible?
- —
No personal income docs; deal must DSCR.
Hard money
10% down · 12.0% · 12mo
- Down + closing
- —
- Monthly P&I
- —
- Monthly cashflow
- —
- DSCR
- —
- Eligible?
- —
Short-term bridge; refi at stabilization.
Listing history 17 events
-
2026-06-19days on market $59,000 Active 31 DOM
-
2026-06-18days on market $59,000 Active 30 DOM
-
2026-06-17days on market $59,000 Active 29 DOM
-
2026-06-16days on market $59,000 Active 28 DOM
-
2026-06-15days on market $59,000 Active 27 DOM
-
2026-06-14days on market $59,000 Active 25 DOM
-
2026-06-12days on market $59,000 Active 24 DOM
-
2026-06-09days on market $59,000 Active 21 DOM
-
2026-06-08days on market $59,000 Active 20 DOM
-
2026-06-07days on market $59,000 Active 19 DOM
-
2026-06-07days on market $59,000 Active 18 DOM
-
2026-06-02days on market $59,000 Active 14 DOM
-
2026-06-01days on market $59,000 Active 13 DOM
-
2026-05-31days on market $59,000 Active 12 DOM
-
2026-05-30days on market $59,000 Active 11 DOM
-
2026-05-19$59,000 Active
-
2026-05-18$59,000 Active 203-char remark
Show marketing remark (203 chars)
ONLINE AUCTION Cash, AS IS terms. One of 46 Enfield properties in an investment portfolio. Go to our website for all addresses. Price shown is value range only, name your price at auction or early offer.
ⓘ Source: listings_history table (triggers on properties + properties_extension) + one-shot
backfill from property_details.listing_events for pre-trigger history.
Tax reassessment forecast NC · Resets to sale price
- Current annual tax
- $1,040 · $87/mo
- Projected year-2 tax
- $1,040 · $87/mo
- Expected delta
- $0/yr ($0/mo · 0.0%)
ⓘ Screening estimate from a state-policy table — verify with the county assessor before closing.
Climate risk First Street
- Flood 1/10 Low FEMA zone X (unshaded) · 0% chance over 30 yrs
- Wildfire 3/10 Moderate
- Heat 7/10 Severe 7 d/yr ≥107°F today · 16 d/yr by 30 yrs out
- Wind 6/10 Major 67% chance of damaging wind over 30 yrs
- Air quality 1/10 Low 0 unhealthy d/yr today · 0 by 30 yrs out
Nearby sold comps map
Loading sold comps map…
Walkable amenities ~0.75 mi
Loading nearby amenities…
Taxation est. · year 1
- Rental income
- $13,792
- − Mortgage interest
- −$3,305
- − Property taxes
- −$1,040
- − Insurance
- −$295
- − Repairs & maintenance
- −$1,103
- − Management
- −$1,103
- − Depreciation
- −$1,716
- Taxable income
- $5,228
- Est. tax owed @ 24.0%
- −$1,255
- After-tax cash flow
- $4,592/yr
For passive investors: Depreciation is non-cash, so a rental often shows a tax loss while cash-flowing — sheltering income. Rental losses are passive: they offset passive income freely, and up to $25,000/yr can offset ordinary (W-2) income if you actively participate and your MAGI is under $100k (phasing out to $0 by $150k); unused losses carry forward. On sale, claimed depreciation is recaptured at up to 25%, and gains may owe capital-gains tax (a 1031 exchange can defer both). Figures are a year-1 estimate at your 24.0% rate — not tax advice; consult a CPA.
Schools (NCES district)
- District
- Halifax County Schools
- NCES district ID
- 3701950
- Math proficiency
- 6% ▼ -11.00%
- Reading proficiency
- 24% ▼ -1.00%
- Median HH income
- $29,104
- Composite
- 11.7/100
- National rank
- #9690
- State rank
- #177 of 178 in NC
Livability — Enfield
- Score
- 59/100
- State rank
- #556
- US rank
- #20483
Category grades
Schools grade is shown separately in the Schools card above.
Census & demographics
- Census place
- Enfield, NC
- Population (ZIP)
- 6,498
Population outlook (Halifax County) Hauer SSP2
- Today (2025)
- 47,976 people
- By 2030
- 45,450 · -5.3%
- By 2040
- 39,980 · -16.7%
- By 2050
- 34,863 · -27.3%
- By 2075
- 25,577 · -46.7%
- By 2100
- 18,365 · -61.7%
Race, ethnicity, and origin ACS 2023
- Neighborhood character
- Predominantly Black (82%)
- Race & ethnicity
- Black 82% White 12% Two or more races 3% Native American 2% Hispanic / Latino 2%
- Foreign-born
- 1% · Canada
- Languages at home
- 98% English-only · Spanish 1% French/Haitian/Cajun 0%
Political lean MEDSL · Halifax
- 2024 margin
- D (+17.7) · D 58.5% · R 40.9%
- 2008→2024 swing
- -10.6pp toward R · 2008: 28.2pp · 2024: 17.7pp
- All cycles
- 2024: D+17.7 2020: D+21.2 2016: D+26.9 2012: D+32.0 2008: D+28.2
Not yet ingested
- Civics
- —
Market trends
- HPI YoY
- ▲ 5.76%
- Current HPI
- 188.4289
- Rent YoY
- —
- Metro
- —
- State GDP YoY
- ▲ 3.28%
- F500 in state
- 26
Industry mix (Fortune 500 HQ in NC)
| Industry | F500 HQs | Revenue |
|---|---|---|
| Financial Services | 2 | $213B |
|
||
| Retail | 2 | $95B |
|
||
| Industrial Conglomerate | 1 | $38B |
|
||
| Metals / Steel | 1 | $35B |
|
||
| Utilities | 1 | $30B |
|
||
| Industrial Machinery | 1 | $19B |
|
||
Price history
+0.0% since first listed2 events — show timeline
- 2026-05-19 Listed $59,000 TMLS
- 2026-05-18 Listed $59,000 Hive MLS
Property tax history
+4.4%/yrLatest (2025): $1,040 · +1.1% YoY. Source: county tax records.
Cash-flow waterfall
monthlySold comps — $/sqft
last 12 mo · ≤1 miLoading sold comps…