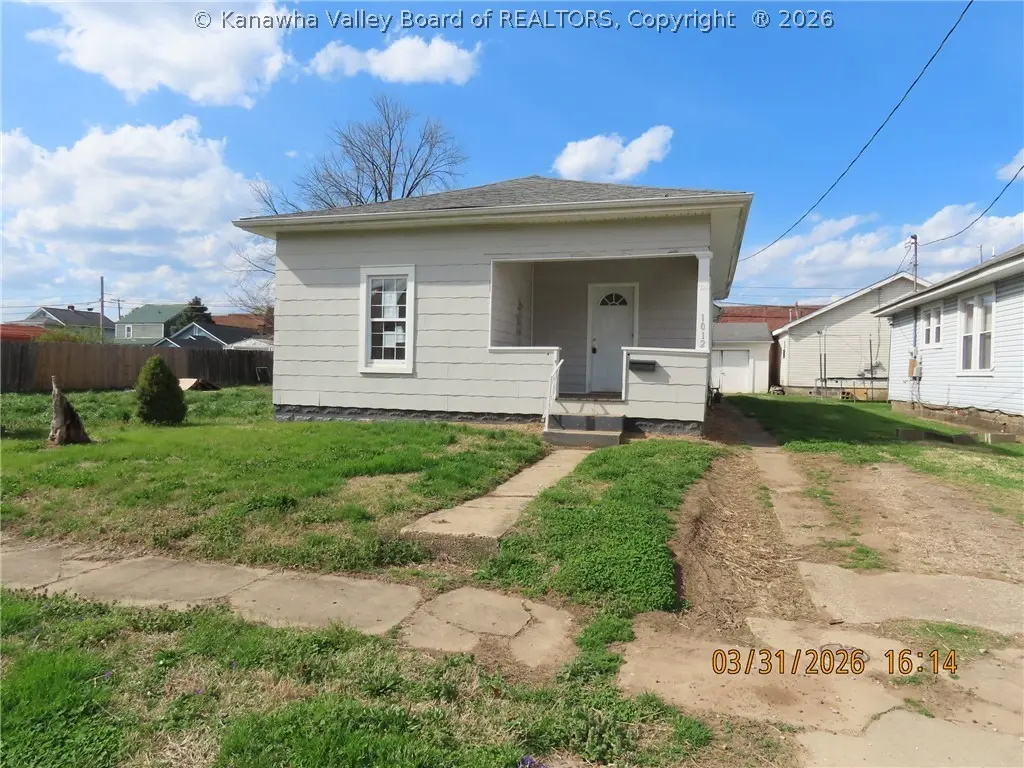
1012 West Virgina Ave · Dunbar, WV
Flood risk 8/10 · Major
- FEMA flood zone
- X (shaded)
- Chance of flooding over 30 yrs
- 0.99%
- Est. flood insurance / yr
- $473 – $860
Fire risk 4/10 · Minor
- Est. fire insurance / yr
- $787 – $1,461
Heat risk 6/10 · Moderate
- Hot days now (above 101°F)
- 7 days/yr
- Hot days in 30 yrs
- 20 days/yr
Wind risk 2/10 · Minimal
- Chance of severe wind over 30 yrs
- 1.0%
Air-quality risk 1/10 · Minimal
- Unhealthy air days now
- 0 days/yr
- Unhealthy air days in 30 yrs
- 0 days/yr
Risk factors via First Street. Map © Google.
Why this score? — see what drove the B- grade
The composite is a weighted blend of 9 inputs, each scored 0–100. Each bar is that input's sub-score; the figure is the points it added to the 100-point composite (weight × sub-score).
- Cash flow +30.0/30.0
- 1% rule +10.0/10.0
- DSCR +10.0/10.0
- ARV discount +7.5/15.0
- Livability +3.5/5.0
- Schools +2.9/10.0
- Rent growth +2.5/5.0
- Condition / age +2.5/5.0
- Appreciation +0.0/10.0
$32,500
🖨 Deal sheet 📄 Offer letter ✓ Due diligence
Listing remarks MLS
This one story home offers 3 bedrooms, 2 full baths, nice kitchen with new appliances, newly refinished wood floors, main floor laundry, partially fenced flat lot with garage/storage out back, on and off street parking, convenient location
Key facts
- 4,792 sq ft lot
- Garage
- Built 1916
Property features AI
Exterior
- Parking: Detached garage (1 car)
- Utilities: Public water; Public sewer
- Home design: Single-family residence; Residential property
- Construction: Vinyl siding; Composition/shingle roof
- Exterior features: Front porch
Interior
- Kitchen: Eat-in kitchen
- Bedrooms: 5 total rooms (bedroom count not specified)
- Flooring: Hardwood flooring; Vinyl flooring
- Bathrooms: 2 full bathrooms
- Heating & cooling: Forced air heating; Cooling system (type: Other)
- Interior features: Eat-in kitchen; Insulated windows; Partial basement
- Laundry & utility: Basement space (partial) — may accommodate utilities
Neighborhood map
What this means for you Summary
Snapshot
- This is a 3-bed/2.0-bath single-family listed at $32k.
Deal economics
- At list price, monthly cash flow is $483 ($6k/yr) — positive.
- The deal already cash-flows at list — no discount required.
- Meets the 1% rule at list price ($1k rent vs $32k).
- Cap rate 26.2% vs local median 4.2% in Dunbar — top-decile yield for the area; either an underpriced asset or a hidden risk that comps aren't pricing in. Stress-test before assuming the spread holds.
Location & tenants
- Location reads 70/100 on livability (#62 in WV) — a middle-class / working-renter tenant base. Strengths: cost of living A+, housing A+, health & safety B+; Watch: employment D+, amenities F, commute F.
- Kanawha County Schools (suburban): math 29% / reading 40% proficiency, ranked #17 of 55 in WV (top 31%) — families likely to look elsewhere, expect single-tenant / working-renter base with shorter leases.
- Zoned schools: Dunbar Primary Center (297 students, 0% FRL); Dunbar Middle School (math 22% / reading 37%, grade F, #61 of 109 statewide, top 56%, 300 students, 0% FRL); South Charleston High School (math 22% / reading 47%, grade F, #42 of 110 statewide, top 47%, 952 students, 0% FRL) — zoned schools average 0% FRL vs 46% district-wide (46 pts lower); this property's tenant base skews higher-income than the district average.
- Market conditions: 46 active listings in the ZIP; 103 units permitted in Kanawha County in 2024 (0 in 5+ unit buildings).
Forward outlook
- Local home prices are declining (-3.0%/yr); year-one equity from $225 of loan paydown is wiped out by about $975 of value loss. Plan a longer hold.
- Kanawha County population projected at -17% by 2050 — secular population decline; favor cash flow + early exit over multi-decade hold.
- At projected returns (-3.0% appreciation + 3.0% rent growth), your $9k cash investment doubles in ~2 years — after that, you're playing with house money.
Negotiation context
- Only 14 days on market — expect competitive offers; lowballing is unlikely to land.
- 2 sale attempts since 5y ago with the ask held roughly flat each time — persistent listings suggest the price (not the market) is what's stuck; bring a comps-based counter.
Risks & watch-outs
- Watch-outs: property tax is 3.0% of price; flood insurance adds $56/mo; built in 1916 — expect roof / HVAC / electrical / plumbing capex.
- Climate carrying-cost: severe flood risk; extreme-heat days projected 7→20/yr by 2055 (HVAC capex compounding) — expect insurance premiums to compound above CPI over the hold.
Questions for the listing agent
- Built in 1916 — when were the roof, HVAC, electrical panel, plumbing, and water heater last replaced?
- Property tax is high relative to price — has the assessment been appealed recently, and will the sale trigger a re-assessment?
- What's the actual annual flood-insurance premium (NFIP or private), and is the property in a SFHA with mandatory coverage?
- Is there a deadline driving the sale (1031 exchange, divorce, estate, relocation)? That informs how much negotiation room exists.
- Schools are F-rated, which usually means shorter tenancies and higher turnover. Who's the typical renter profile here, and what's been the actual vacancy rate?
- What's the average days-on-market for RENTAL listings here right now (not sales)? A rising rental-DOM trend means longer vacancies and softer asking-rent achievability than the comps imply.
- What's the recent tenant-quality profile in this submarket — average credit score on applications, eviction rate, late-payment / NSF rate, and stable-employment percentage? A property-management company in the area should have these aggregated.
- How much new for-sale + rental construction is in the pipeline within 1–3 miles? Heavy new supply typically softens prices + rents 12–24 months out; constrained supply supports both.
Investment metrics
- 1% rule
- 3.13% ✓
- Cap rate
- 26.19%
- Cash-on-cash
- 71.08%
- DSCR
- 4.16
- GRM
- 2.7
CMA / ARV
- ARV (on-the-fly)
- $120,000
- Comps found
- 12
Show comp detail 12 sales within ~0.75 mi
| Address | Dist | Beds/Ba | Sqft | Sold | Price | $/sf | Match |
|---|---|---|---|---|---|---|---|
| 1328 Lightner Ave | 0.41mi | 2/1.0 (-1) | 936 (-2%) | 7mo | $100,000 | $107 | 62 |
| 448 18th St | 0.57mi | 3/1.0 | 993 (+3%) | 9mo | $111,000 | $112 | 56 |
| 708 Beech St | 0.60mi | 2/1.0 (-1) | 960 (0%) | 8mo | $125,000 | $130 | 56 |
| 5307 Ohio St | 0.42mi | 2/1.0 (-1) | 884 (-8%) | 4mo | $150,000 | $170 | 55 |
| 133 7th St | 0.40mi | 2/1.0 (-1) | 836 (-13%) | 1mo | $41,400 | $50 | 50 |
| 5600 Habitat St | 0.65mi | 3/1.0 | 1,054 (+10%) | 1mo | $161,000 | $153 | 49 |
| 456 18th St | 0.58mi | 2/1.0 (-1) | 1,027 (+7%) | 6mo | $85,000 | $83 | 47 |
| 1908 West Virginia Ave | 0.69mi | 3/1.5 | 1,056 (+10%) | 2mo | $155,000 | $147 | 47 |
| 908 Overlook Way | 0.64mi | 2/1.0 (-1) | 1,000 (+4%) | 11mo | $125,000 | $125 | 45 |
| 4834 Ohio St | 0.52mi | 2/1.0 (-1) | 863 (-10%) | 6mo | $82,000 | $95 | 45 |
| 5314 Main Dr | 0.59mi | 3/1.0 | 1,056 (+10%) | 13mo | $150,000 | $142 | 41 |
| 332 21st St | 0.71mi | 2/1.0 (-1) | 1,074 (+12%) | 8mo | $48,000 | $45 | 31 |
Match score weights: distance 35% · size 25% · config 20% · recency 20%. Top-matched comps best support the ARV.
Projected returns pro-forma
-3.0% appreciation · 3.0% rent growth · sell at horizon
- IRR
- 62.9%
- Equity multiple
- 3.81×
- Total profit
- $25,600
- Equity at exit
- $4,846
- IRR
- 67.4%
- Equity multiple
- 7.84×
- Total profit
- $62,243
- Equity at exit
- $2,810
Cash invested: $9,100 (down + closing). Projections, not guarantees.
Landlord ↔ Tenant lean methodology
- Overall (STATE)
- 83 Strongly Landlord-Friendly
- State West Virginia
- 83 Strongly Landlord-Friendly · R+22
- County
- — inherits STATE
- City
- — inherits STATE
ZIP-level market 25064
- Home prices YoY
- -14.2%
- Active inventory
- 46
- Price-to-rent
- 2.7×
Monthly cashflow live
- Estimated rent
- $1,017 medium interval (Pro) →
- Mortgage (P&I)
- −$170
- Tax from tax record
- −$80 /mo · $965/yr
- Insurance
- −$14
- Flood insurance flood zone
- −$56 /mo · $666/yr
- HOA
- −$0
- Vacancy / Maint / Mgmt
- −$214
- Net cashflow
- $483
Break-even live
UW: 25.0% down · 7.5% · 30yr · 1.5% tax · 5.0% vac · 8.0% maint · 8.0% mgmt
Financing live
Cash to close
- Down payment
- $8,125
- Closing costs
- $975
- Reserves months
- —
- Total cash needed
- —
Loan-product check · same deal, 3 products live
Conventional
25% down · 7.5% · 30yr
- Down + closing
- —
- Monthly P&I
- —
- Monthly cashflow
- —
- DSCR
- —
- Eligible?
- —
Personal DTI + credit; lowest rate.
DSCR
20% down · 8.5% · 30yr
- Down + closing
- —
- Monthly P&I
- —
- Monthly cashflow
- —
- DSCR
- —
- Eligible?
- —
No personal income docs; deal must DSCR.
Hard money
10% down · 12.0% · 12mo
- Down + closing
- —
- Monthly P&I
- —
- Monthly cashflow
- —
- DSCR
- —
- Eligible?
- —
Short-term bridge; refi at stabilization.
Listing history 11 events
-
2026-06-17status $32,500 Pending 14 DOM
-
2026-06-17days on market $32,500 Active 14 DOM
-
2026-06-16days on market $32,500 Active 13 DOM
-
2026-06-15days on market $32,500 Active 12 DOM
-
2026-06-14days on market $32,500 Active 10 DOM
-
2026-06-12days on market $32,500 Active 9 DOM
-
2026-06-09days on market $32,500 Active 6 DOM
-
2026-06-08days on market $32,500 Active 5 DOM
-
2026-06-07days on market $32,500 Active 4 DOM
-
2026-06-03remarks 286-char remark
-
2026-06-03$32,500 Active 1 DOM
ⓘ Source: listings_history table (triggers on properties + properties_extension) + one-shot
backfill from property_details.listing_events for pre-trigger history.
Tax reassessment forecast WV · Resets to sale price
- Current annual tax
- $965 · $80/mo
- Projected year-2 tax
- $965 · $80/mo
- Expected delta
- $0/yr ($0/mo · 0.0%)
ⓘ Screening estimate from a state-policy table — verify with the county assessor before closing.
Climate risk First Street
- Flood 8/10 Severe FEMA zone X (shaded) · 99% chance over 30 yrs
- Wildfire 4/10 Moderate
- Heat 6/10 Major 7 d/yr ≥101°F today · 20 d/yr by 30 yrs out
- Wind 2/10 Low 100% chance of damaging wind over 30 yrs
- Air quality 1/10 Low 0 unhealthy d/yr today · 0 by 30 yrs out
Nearby sold comps map
Loading sold comps map…
Walkable amenities ~0.75 mi
Loading nearby amenities…
Taxation est. · year 1
- Rental income
- $12,204
- − Mortgage interest
- −$1,821
- − Property taxes
- −$965
- − Insurance
- −$829
- − Repairs & maintenance
- −$976
- − Management
- −$976
- − Depreciation
- −$945
- Taxable income
- $5,691
- Est. tax owed @ 24.0%
- −$1,366
- After-tax cash flow
- $4,436/yr
For passive investors: Depreciation is non-cash, so a rental often shows a tax loss while cash-flowing — sheltering income. Rental losses are passive: they offset passive income freely, and up to $25,000/yr can offset ordinary (W-2) income if you actively participate and your MAGI is under $100k (phasing out to $0 by $150k); unused losses carry forward. On sale, claimed depreciation is recaptured at up to 25%, and gains may owe capital-gains tax (a 1031 exchange can defer both). Figures are a year-1 estimate at your 24.0% rate — not tax advice; consult a CPA.
Schools (NCES district)
- District
- Kanawha County Schools
- NCES district ID
- 5400600
- Math proficiency
- 29% ▼ -13.00%
- Reading proficiency
- 40% ▼ -7.00%
- Median HH income
- $44,329
- Composite
- 29.35/100
- National rank
- #6540
- State rank
- #17 of 55 in WV
Livability — Dunbar
- Score
- 70/100
- State rank
- #62
- US rank
- #7810
Category grades
Schools grade is shown separately in the Schools card above.
Census & demographics
- Census place
- Dunbar, WV
- Population (ZIP)
- 9,182
Population outlook (Kanawha County) Hauer SSP2
- Today (2025)
- 178,946 people
- By 2030
- 172,906 · -3.4%
- By 2040
- 159,874 · -10.7%
- By 2050
- 148,148 · -17.2%
- By 2075
- 123,257 · -31.1%
- By 2100
- 96,454 · -46.1%
Race, ethnicity, and origin ACS 2023
- Neighborhood character
- Predominantly White (72%)
- Race & ethnicity
- White 72% Black 16% Two or more races 7% Hispanic / Latino 3% Pacific Islander 2% Asian 1%
- Common ancestry
- Serbian 2% Italian 2% Slovak 2%
- Foreign-born
- 1% · Canada
- Languages at home
- 97% English-only · Spanish 1% Tagalog/Filipino 1%
Political lean MEDSL · Kanawha
- 2024 margin
- R (+17.4) · D 40.2% · R 57.6% · Other 2.2%
- 2008→2024 swing
- -17.0pp toward R · 2008: -0.4pp · 2024: -17.4pp
- All cycles
- 2024: R+17.4 2020: R+14.7 2016: R+20.6 2012: R+11.9 2008: R+0.4
Not yet ingested
- Civics
- —
Market trends
- HPI YoY
- ▼ -28.70%
- Current HPI
- 172.7534
- Rent YoY
- —
- Metro
- —
- State GDP YoY
- —
- F500 in state
- 0
Price history
+71.1% since first listed4 events — show timeline
- 2026-06-01 Listed $32,500 KVBOR
- 2021-08-18 Sold (MLS) $99,900 KVBOR
- 2021-05-13 Listed $99,900 KVBOR
- 1995-05-19 Sold (Public Records) $19,000 Public Records
Property tax history
+1.4%/yrLatest (2025): $965 · +0.0% YoY. Source: county tax records.
Cash-flow waterfall
monthlySold comps — $/sqft
last 12 mo · ≤1 miLoading sold comps…