1129 Skyline Dr · Blandburg, PA
Flood risk 1/10 · Minimal
- FEMA flood zone
- X (unshaded)
- Chance of flooding over 30 yrs
- 0.0%
- Est. flood insurance / yr
- $473 – $860
Fire risk 3/10 · Minor
- Est. fire insurance / yr
- $511 – $949
Heat risk 2/10 · Minimal
- Hot days now (above 89°F)
- 7 days/yr
- Hot days in 30 yrs
- 18 days/yr
Wind risk 2/10 · Minimal
- Chance of severe wind over 30 yrs
- —
Air-quality risk 2/10 · Minimal
- Unhealthy air days now
- 1 days/yr
- Unhealthy air days in 30 yrs
- 2 days/yr
Risk factors via First Street. Map © Google.
Why this score? — see what drove the B grade
The composite is a weighted blend of 9 inputs, each scored 0–100. Each bar is that input's sub-score; the figure is the points it added to the 100-point composite (weight × sub-score).
- Cash flow +30.0/30.0
- 1% rule +10.0/10.0
- DSCR +10.0/10.0
- ARV discount +7.5/15.0
- Appreciation +5.0/10.0
- Schools +4.2/10.0
- Livability +3.2/5.0
- Rent growth +2.5/5.0
- Condition / age +2.5/5.0
$42,000
🖨 Deal sheet 📄 Offer letter ✓ Due diligence
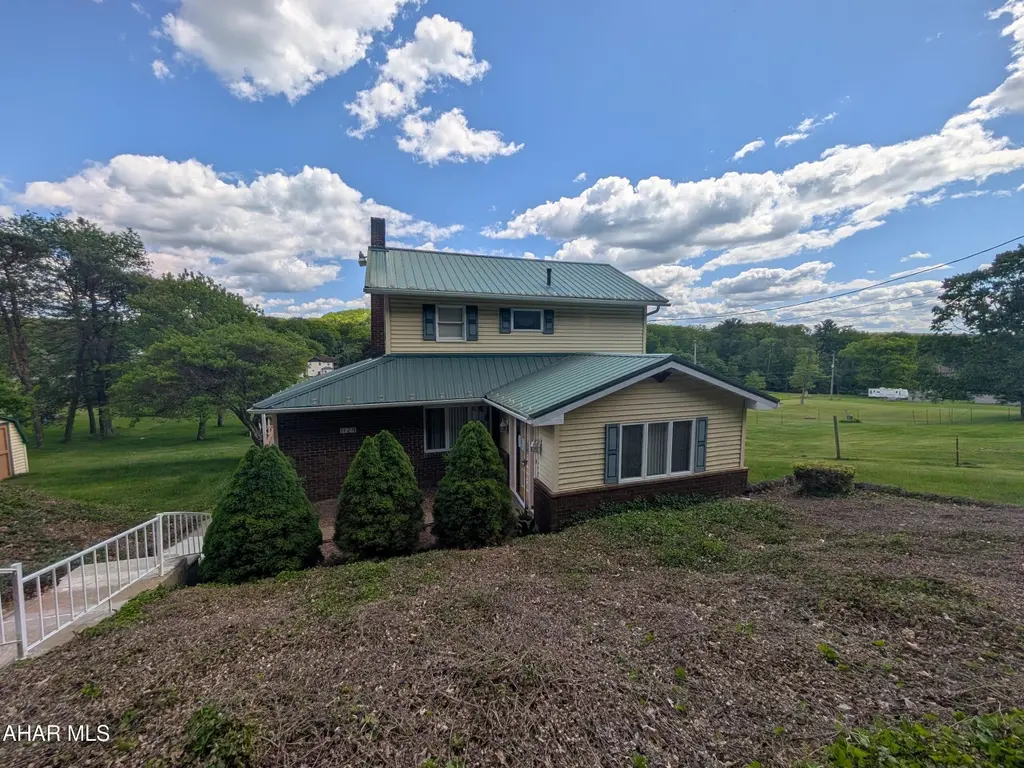
Listing remarks
Blandburg area 2 story vinyl home features large formal living room and dining room, kitchen with dininig penninsula, forst floor laundry plus 2 bedroom and full bath upstairs. Large rear deck overlooks 0.59 acre lot and 2 large storage sheds. Property sold AS-IS. Seller will make no repairs. Buyer to pay any required municipal sewer testing and/or repair escrow. Offers must be submitted through HUD approved broker. Buyer pays both transfer taxes. Exclusive Agency. Equal Housing Opportunity. www. HUDHomestore.com. Property was built pre-1978 - requiring LBP disclosures. Subject to Appraisal - If the purchaser is utilizing FHA financing the purchaser's appraisal will determine final insurabi
Key facts
- 0.59 acre lot
- First floor laundry
- Dining room
Tags
Property features AI
Exterior
- Utilities: Public water
- Home design: Single-family residence; Two levels; Residential property
- Construction: Vinyl siding; Metal roof
- Exterior features: Deck; Shed(s); Sloped lot
Interior
- Kitchen: Includes dishwasher
- Bedrooms: Total of 8 rooms (bedroom count not specified)
- Flooring: Vinyl flooring; Carpeted areas
- Bathrooms: 1 full bathroom
- Heating & cooling: Baseboard heating; Hot water heating; Oil-fired heating
- Interior features: Dishwasher; Vinyl and carpet flooring; Basement
Neighborhood map
What this means for you Summary
Snapshot
- This is a 2-bed/1.0-bath other listed at $42k.
Deal economics
- At list price, monthly cash flow is $470 ($6k/yr) — positive.
- The deal already cash-flows at list — no discount required.
- Meets the 1% rule at list price ($1k rent vs $42k).
Location & tenants
- Location reads 63/100 on livability (#1,309 in PA) — a middle-class / working-renter tenant base. Strengths: cost of living A+, housing A+; Watch: schools D, employment D, amenities F.
- Glendale SD (rural): math 39% / reading 62% proficiency, ranked #195 of 539 in PA (top 36%) — acceptable for families but not a draw, mixed tenant base, ~2y average lease.
- Market conditions: 6 active listings in the ZIP; 64 units permitted in Cambria County in 2024 (0 in 5+ unit buildings).
Forward outlook
- In year one you build about $2k of equity ($290 loan paydown + $1k appreciation (3.0% local appreciation)).
- Cambria County population projected at -28% by 2050 — secular population decline; favor cash flow + early exit over multi-decade hold.
- At projected returns (3.0% appreciation + 3.0% rent growth), your $12k cash investment doubles in ~2 years — after that, you're playing with house money.
Negotiation context
- Only 11 days on market — expect competitive offers; lowballing is unlikely to land.
Risks & watch-outs
- Watch-outs: built in 1900 — expect roof / HVAC / electrical / plumbing capex.
Questions for the listing agent
- Built in 1900 — when were the roof, HVAC, electrical panel, plumbing, and water heater last replaced?
- Is there a deadline driving the sale (1031 exchange, divorce, estate, relocation)? That informs how much negotiation room exists.
- Schools are D-rated, which usually means shorter tenancies and higher turnover. Who's the typical renter profile here, and what's been the actual vacancy rate?
- What's the average days-on-market for RENTAL listings here right now (not sales)? A rising rental-DOM trend means longer vacancies and softer asking-rent achievability than the comps imply.
- What's the recent tenant-quality profile in this submarket — average credit score on applications, eviction rate, late-payment / NSF rate, and stable-employment percentage? A property-management company in the area should have these aggregated.
- How much new for-sale + rental construction is in the pipeline within 1–3 miles? Heavy new supply typically softens prices + rents 12–24 months out; constrained supply supports both.
Investment metrics
- 1% rule
- 2.39% ✓
- Cap rate
- 19.72%
- Cash-on-cash
- 47.95%
- DSCR
- 3.13
- GRM
- 3.5
CMA / ARV
No comps found within radius.
Projected returns pro-forma
3.0% appreciation · 3.0% rent growth · sell at horizon
- IRR
- 53.2%
- Equity multiple
- 3.98×
- Total profit
- $35,026
- Equity at exit
- $18,885
- IRR
- 52.8%
- Equity multiple
- 8.04×
- Total profit
- $82,795
- Equity at exit
- $29,104
Cash invested: $11,760 (down + closing). Projections, not guarantees.
Landlord ↔ Tenant lean methodology
- Overall (STATE)
- 62 Landlord-Friendly
- State Pennsylvania
- 62 Landlord-Friendly · EVEN
- County
- — inherits STATE
- City
- — inherits STATE
ZIP-level market 16619
- Active inventory
- 6
- Price-to-rent
- 3.5×
Monthly cashflow live
- Estimated rent
- $1,003 medium interval (Pro) →
- Mortgage (P&I)
- −$220
- Tax from tax record
- −$85 /mo · $1,016/yr
- Insurance
- −$18
- HOA
- −$0
- Vacancy / Maint / Mgmt
- −$211
- Net cashflow
- $470
Break-even live
UW: 25.0% down · 7.5% · 30yr · 1.5% tax · 5.0% vac · 8.0% maint · 8.0% mgmt
Financing live
Cash to close
- Down payment
- $10,500
- Closing costs
- $1,260
- Reserves months
- —
- Total cash needed
- —
Loan-product check · same deal, 3 products live
Conventional
25% down · 7.5% · 30yr
- Down + closing
- —
- Monthly P&I
- —
- Monthly cashflow
- —
- DSCR
- —
- Eligible?
- —
Personal DTI + credit; lowest rate.
DSCR
20% down · 8.5% · 30yr
- Down + closing
- —
- Monthly P&I
- —
- Monthly cashflow
- —
- DSCR
- —
- Eligible?
- —
No personal income docs; deal must DSCR.
Hard money
10% down · 12.0% · 12mo
- Down + closing
- —
- Monthly P&I
- —
- Monthly cashflow
- —
- DSCR
- —
- Eligible?
- —
Short-term bridge; refi at stabilization.
Listing history 11 events
-
2026-06-17status $42,000 Pending 11 DOM
-
2026-06-17days on market $42,000 Active 11 DOM
-
2026-06-16days on market $42,000 Active 10 DOM
-
2026-06-15days on market $42,000 Active 9 DOM
-
2026-06-14days on market $42,000 Active 7 DOM
-
2026-06-13days on market $42,000 Active 6 DOM
-
2026-06-10days on market $42,000 Active 4 DOM
-
2026-06-09days on market $42,000 Active 3 DOM
-
2026-06-08days on market $42,000 Active 2 DOM
-
2026-06-07remarks 699-char remark
-
2026-06-07$42,000 Active 1 DOM
ⓘ Source: listings_history table (triggers on properties + properties_extension) + one-shot
backfill from property_details.listing_events for pre-trigger history.
Tax reassessment forecast PA · Partial reset (capped growth)
- Current annual tax
- $1,016 · $85/mo
- Projected year-2 tax
- $1,016 · $85/mo
- Expected delta
- $0/yr ($0/mo · 0.0%)
ⓘ Screening estimate from a state-policy table — verify with the county assessor before closing.
Climate risk First Street
- Flood 1/10 Low FEMA zone X (unshaded) · 0% chance over 30 yrs
- Wildfire 3/10 Moderate
- Heat 2/10 Low 7 d/yr ≥89°F today · 18 d/yr by 30 yrs out
- Wind 2/10 Low
- Air quality 2/10 Low 1 unhealthy d/yr today · 2 by 30 yrs out
Nearby sold comps map
Loading sold comps map…
Walkable amenities ~0.75 mi
Loading nearby amenities…
Taxation est. · year 1
- Rental income
- $12,036
- − Mortgage interest
- −$2,353
- − Property taxes
- −$1,016
- − Insurance
- −$210
- − Repairs & maintenance
- −$963
- − Management
- −$963
- − Depreciation
- −$1,222
- Taxable income
- $5,310
- Est. tax owed @ 24.0%
- −$1,274
- After-tax cash flow
- $4,365/yr
For passive investors: Depreciation is non-cash, so a rental often shows a tax loss while cash-flowing — sheltering income. Rental losses are passive: they offset passive income freely, and up to $25,000/yr can offset ordinary (W-2) income if you actively participate and your MAGI is under $100k (phasing out to $0 by $150k); unused losses carry forward. On sale, claimed depreciation is recaptured at up to 25%, and gains may owe capital-gains tax (a 1031 exchange can defer both). Figures are a year-1 estimate at your 24.0% rate — not tax advice; consult a CPA.
Schools (NCES district)
- District
- Glendale SD
- NCES district ID
- 4210830
- Math proficiency
- 39% ▼ -9.00%
- Reading proficiency
- 62% ▼ -3.00%
- Median HH income
- $37,869
- Composite
- 41.95/100
- National rank
- #3350
- State rank
- #195 of 539 in PA
Livability — Blandburg
- Score
- 63/100
- State rank
- #1309
- US rank
- #16092
Category grades
Schools grade is shown separately in the Schools card above.
Census & demographics
- Census place
- Blandburg, PA
- City population
- 315
- Population (ZIP)
- 315
Population outlook (Cambria County) Hauer SSP2
- Today (2025)
- 122,754 people
- By 2030
- 115,827 · -5.6%
- By 2040
- 101,309 · -17.5%
- By 2050
- 88,379 · -28.0%
- By 2075
- 65,237 · -46.9%
- By 2100
- 46,909 · -61.8%
Race, ethnicity, and origin ACS 2023
- Neighborhood character
- Predominantly White (89%)
- Race & ethnicity
- White 89% Two or more races 8% Hispanic / Latino 4% Black 3%
- Common ancestry
- Subsaharan African 3% Romanian 2% Polish 1%
- Languages at home
- 99% English-only · Other Indo-European 1%
Political lean MEDSL · Cambria
- 2024 margin
- Solid R (+39.7) · D 29.8% · R 69.5%
- 2008→2024 swing
- -40.4pp toward R · 2008: 0.7pp · 2024: -39.7pp
- All cycles
- 2024: R+39.7 2020: R+37.3 2016: R+37.8 2012: R+17.8 2008: D+0.7
Not yet ingested
- Civics
- —
Market trends
- HPI YoY
- —
- Current HPI
- —
- Rent YoY
- —
- Metro
- —
- State GDP YoY
- ▲ 1.68%
- F500 in state
- 34
Industry mix (Fortune 500 HQ in PA)
| Industry | F500 HQs | Revenue |
|---|---|---|
| Healthcare | 2 | $309B |
|
||
| Insurance | 2 | $27B |
|
||
| Telecommunications / Media | 1 | $124B |
|
||
| Industrial Distribution | 1 | $22B |
|
||
| Financial Services | 1 | $20B |
|
||
| Chemicals / Materials | 1 | $18B |
|
||
Price history
1 event — show timeline
- 2026-06-05 Listed $42,000 AHARMLS
Property tax history
+2.1%/yrLatest (2026): $1,016 · +4.3% YoY. Source: county tax records.
Cash-flow waterfall
monthlySold comps — $/sqft
last 12 mo · ≤1 miLoading sold comps…