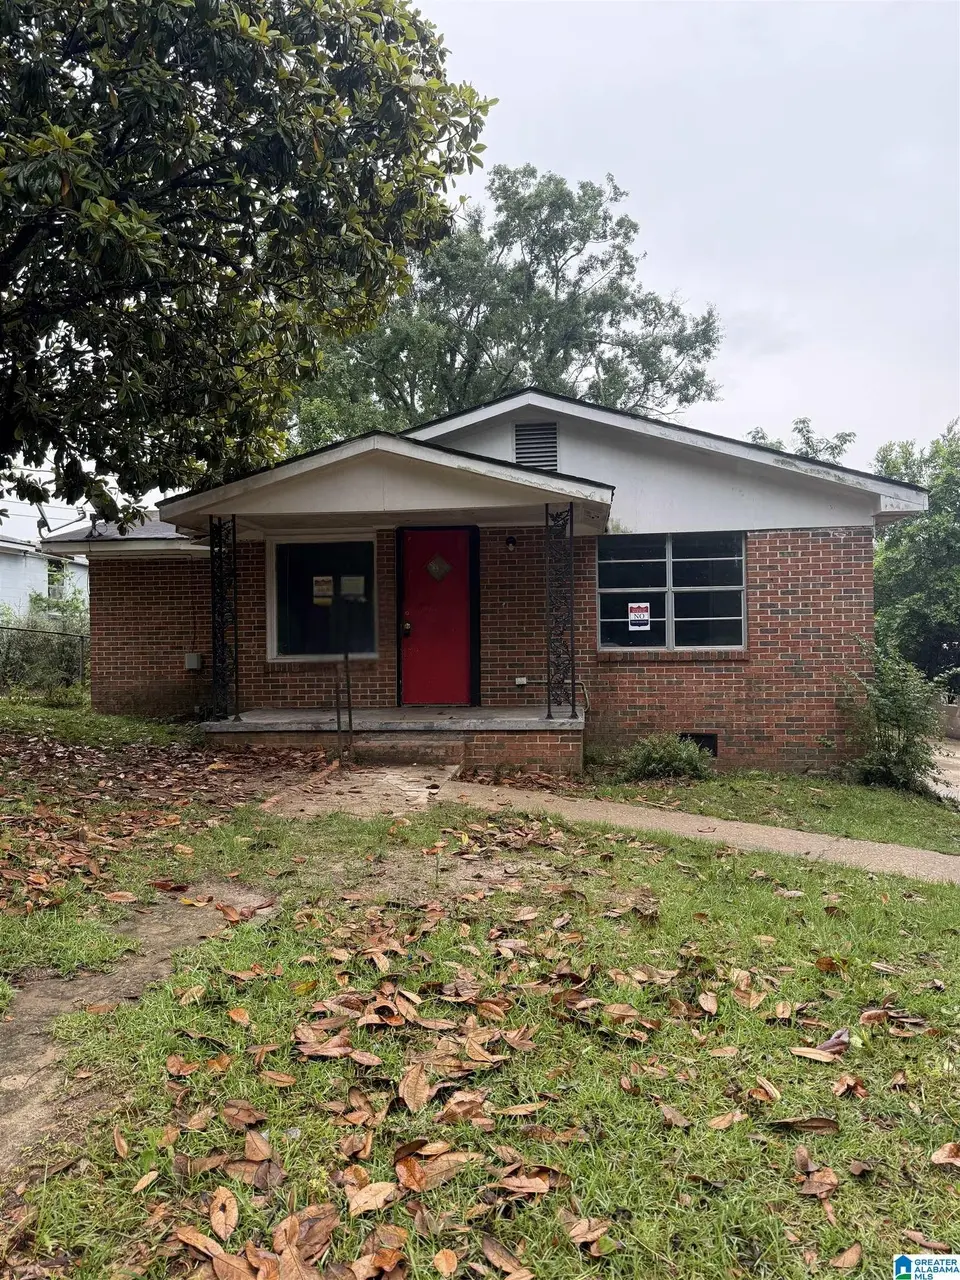
105 Fox St · Troy, AL
Flood risk 1/10 · Minimal
- FEMA flood zone
- X (unshaded)
- Chance of flooding over 30 yrs
- 0.0%
- Est. flood insurance / yr
- $507 – $1,088
Fire risk 3/10 · Minor
- Est. fire insurance / yr
- $916 – $1,700
Heat risk 8/10 · Major
- Hot days now (above 107°F)
- 7 days/yr
- Hot days in 30 yrs
- 19 days/yr
Wind risk 8/10 · Major
- Chance of severe wind over 30 yrs
- 90.0%
Air-quality risk 2/10 · Minimal
- Unhealthy air days now
- 1 days/yr
- Unhealthy air days in 30 yrs
- 1 days/yr
Risk factors via First Street. Map © Google.
Why this score? — see what drove the D grade
The composite is a weighted blend of 9 inputs, each scored 0–100. Each bar is that input's sub-score; the figure is the points it added to the 100-point composite (weight × sub-score).
- Cash flow +15.0/30.0
- ARV discount +7.5/15.0
- 1% rule +5.0/10.0
- DSCR +5.0/10.0
- Livability +3.2/5.0
- Rent growth +2.5/5.0
- Condition / age +2.5/5.0
- Schools +2.3/10.0
- Appreciation +0.0/10.0
$30,000
🖨 Deal sheet 📄 Offer letter ✓ Due diligence
Listing remarks
FINAL CALL FOR OFFERS!!! All offers due 6/12/2026 by 5:00 PM Central. Great opportunity to own property just 5 minutes from Troy University! This home in need of extensive renovation, but offers strong potential for investors, flippers, or those looking to build new in a convenient location! Property sold "As-Is". Buyer and/or buyer's agent responsible for verifying all pertinent information deemed relevant by the prospective buyer, including but not limited to square footage, acreage, utilities, taxes, zoning, permitting, condition, school zones, HOAs, etc.
Key facts
- 6,098 sq ft lot
- Built 1965
- Listed 36 days
Property features AI
Finance
- Other: Lot size approximately 0.14 acres; Located in the Henderson subdivision
Exterior
- Parking: Driveway parking
- Utilities: Public water; Connected sewer; Electric water heater; Internet service availability unknown
- Home design: Existing (previously built) property; 4-sided brick construction; Crawl space foundation
- Construction: 4-side brick construction; Crawl space foundation
- Exterior features: Front porch; No deck, patio, pool, or garden listed; Property not on waterfront
Interior
- Kitchen: Solid surface countertops
- Bedrooms: Four bedrooms, all on the main level
- Flooring: Hardwood
- Bathrooms: One full bathroom; One half bathroom
- Heating & cooling: Window unit heating; Window unit cooling
- Interior features: Hardwood floors; Ceilings: Other (see remarks); Attic; No additional interior features listed
- Laundry & utility: Main-level laundry room; Washer hookup; Electric dryer hookup
Neighborhood map
What this means for you Summary
Snapshot
- This is a 4-bed/1.0-bath single-family listed at $30k.
Deal economics
- At list price, monthly cash flow is $1k ($12k/yr) — positive.
- The deal already cash-flows at list — no discount required.
- Meets the 1% rule at list price ($2k rent vs $30k).
- Recommended offer: $29k (3.0% below list) — sets the bar for market timing.
- Cap rate 48.0% vs local median 2.0% in Troy — top-decile yield for the area; either an underpriced asset or a hidden risk that comps aren't pricing in. Stress-test before assuming the spread holds.
Location & tenants
- Location reads 64/100 on livability (#148 in AL) — a middle-class / working-renter tenant base. Strengths: cost of living A+, housing B; Watch: amenities C-, crime F, commute F.
- Troy City (rural): math 21% / reading 36% proficiency, ranked #80 of 129 in AL (top 62%) — low school quality limits family demand, transient renter base, plan for 1-2y turnover; 62% free/reduced lunch — lower-income household profile, screen leases tightly.
- Zoned schools: Troy Elementary School (math 28% / reading 41%, grade F, #296 of 627 statewide, top 49%, 982 students, 68% FRL); Charles Henderson High School (math 12% / reading 12%, grade F, #242 of 305 statewide, top 80%, 515 students, 56% FRL) — zoned schools at 62% FRL track the district average.
- Market conditions: 26 active listings in the ZIP; 1 comparable units currently listed for rent nearby; lower-income renter base — watch delinquency; 42 units permitted in Pike County in 2024 (0 in 5+ unit buildings).
- This rent runs 43% of the median local income ($44k/yr) — at the standard rent-burdened threshold; future hikes will face affordability resistance.
Forward outlook
- Local home prices are declining (-3.0%/yr); year-one equity from $207 of loan paydown is wiped out by about $900 of value loss. Plan a longer hold.
- Pike County population projected at +11% by 2050 — modest demand growth; plan on rents tracking national, not racing it.
- At projected returns (-3.0% appreciation + 3.0% rent growth), your $8k cash investment doubles in ~1 year — after that, you're playing with house money.
Negotiation context
- It's been on market 37 days — a 3% lower offer ($29k) is reasonable based on typical stale-listing flexibility.
- Current owner paid $6k; list at $30k implies a 400% gain — meaningful room to come down on a strong offer.
Risks & watch-outs
- Climate carrying-cost: severe wind risk, 90% chance of damaging wind over 30y; extreme-heat days projected 7→19/yr by 2055 (HVAC capex compounding) — expect insurance premiums to compound above CPI over the hold.
Questions for the listing agent
- It's been on market 37 days. Have you received any prior offers? Is the seller open to a 3% concession, seller financing, or rate buy-down credit?
- Built in 1965 — when were the roof, HVAC, electrical panel, plumbing, and water heater last replaced?
- Is there a deadline driving the sale (1031 exchange, divorce, estate, relocation)? That informs how much negotiation room exists.
- Schools are D-rated, which usually means shorter tenancies and higher turnover. Who's the typical renter profile here, and what's been the actual vacancy rate?
- Crime grade is F in this area — have there been break-ins, vandalism, or insurance claims at this property in the last 3 years? What carrier currently insures it and at what premium?
- The area grade is low — what's the realistic commute time and amenity access for the typical tenant pool here? Any planned neighborhood developments (good or bad) we should know about?
- What's the average days-on-market for RENTAL listings here right now (not sales)? A rising rental-DOM trend means longer vacancies and softer asking-rent achievability than the comps imply.
- What's the recent tenant-quality profile in this submarket — average credit score on applications, eviction rate, late-payment / NSF rate, and stable-employment percentage? A property-management company in the area should have these aggregated.
- How much new for-sale + rental construction is in the pipeline within 1–3 miles? Heavy new supply typically softens prices + rents 12–24 months out; constrained supply supports both.
Investment metrics
- 1% rule
- 5.31% ✓
- Cap rate
- 47.95%
- Cash-on-cash
- 148.79%
- DSCR
- 7.62
- GRM
- 1.6
CMA / ARV
- ARV (median comp)
- $109,279
- List price
- $30,000
- Delta
- -72.55%
- Verdict
- UNDERPRICED
- Comps
- 2 within 1.0 mi
Projected returns pro-forma
-3.0% appreciation · 3.0% rent growth · sell at horizon
- IRR
- —
- Equity multiple
- 8.32×
- Total profit
- $61,504
- Equity at exit
- $4,473
- IRR
- —
- Equity multiple
- 17.56×
- Total profit
- $139,094
- Equity at exit
- $2,594
Cash invested: $8,400 (down + closing). Projections, not guarantees.
Landlord ↔ Tenant lean methodology
- Overall (STATE)
- 90 Strongly Landlord-Friendly
- State Alabama
- 90 Strongly Landlord-Friendly · R+15
- County
- — inherits STATE
- City
- — inherits STATE
ZIP-level market 36081
- Home prices YoY
- -30.4%
- Active inventory
- 26
- Price-to-rent
- 1.6×
Monthly cashflow live
- Estimated rent
- $1,592 medium interval (Pro) →
- Mortgage (P&I)
- −$157
- Tax from tax record
- −$46 /mo · $556/yr
- Insurance
- −$12
- HOA
- −$0
- Vacancy / Maint / Mgmt
- −$334
- Net cashflow
- $1,042
Break-even live
UW: 25.0% down · 7.5% · 30yr · 1.5% tax · 5.0% vac · 8.0% maint · 8.0% mgmt
Financing live
Cash to close
- Down payment
- $7,500
- Closing costs
- $900
- Reserves months
- —
- Total cash needed
- —
Loan-product check · same deal, 3 products live
Conventional
25% down · 7.5% · 30yr
- Down + closing
- —
- Monthly P&I
- —
- Monthly cashflow
- —
- DSCR
- —
- Eligible?
- —
Personal DTI + credit; lowest rate.
DSCR
20% down · 8.5% · 30yr
- Down + closing
- —
- Monthly P&I
- —
- Monthly cashflow
- —
- DSCR
- —
- Eligible?
- —
No personal income docs; deal must DSCR.
Hard money
10% down · 12.0% · 12mo
- Down + closing
- —
- Monthly P&I
- —
- Monthly cashflow
- —
- DSCR
- —
- Eligible?
- —
Short-term bridge; refi at stabilization.
Rent comps 1 comps
| Address | Beds | Baths | Sqft | Rent | $/sqft | DOM | Units | Dist |
|---|---|---|---|---|---|---|---|---|
| 217 Orion St Troy, AL | 3.0 | 2.0 | 1770 | $1,925 | $1.09 | 43d | 1 | 0.92mi |
Listing history 18 events
-
2026-06-19days on market $30,000 Active 37 DOM
-
2026-06-18days on market $30,000 Active 36 DOM
-
2026-06-17days on market $30,000 Active 35 DOM
-
2026-06-16days on market $30,000 Active 34 DOM
-
2026-06-15days on market $30,000 Active 33 DOM
-
2026-06-14days on market $30,000 Active 31 DOM
-
2026-06-12remarks 564-char remark
-
2026-06-12days on market $30,000 Active 30 DOM
-
2026-06-09days on market $30,000 Active 27 DOM
-
2026-06-08days on market $30,000 Active 26 DOM
-
2026-06-07pricedays on market $30,000 Active 25 DOM
-
2026-06-04days on market $38,000 Active 21 DOM
-
2026-06-02days on market $38,000 Active 20 DOM
-
2026-06-01days on market $38,000 Active 19 DOM
-
2026-05-31days on market $38,000 Active 18 DOM
-
2026-05-31days on market $38,000 Active 17 DOM
-
2026-05-13$38,000 Active 504-char remark
-
2019-02-13soldstatus $6,000
ⓘ Source: listings_history table (triggers on properties + properties_extension) + one-shot
backfill from property_details.listing_events for pre-trigger history.
Tax reassessment forecast AL · Resets to sale price
- Current annual tax
- $556 · $46/mo
- Projected year-2 tax
- $556 · $46/mo
- Expected delta
- $0/yr ($0/mo · 0.0%)
ⓘ Screening estimate from a state-policy table — verify with the county assessor before closing.
Climate risk First Street
- Flood 1/10 Low FEMA zone X (unshaded) · 0% chance over 30 yrs
- Wildfire 3/10 Moderate
- Heat 8/10 Severe 7 d/yr ≥107°F today · 19 d/yr by 30 yrs out
- Wind 8/10 Severe 90% chance of damaging wind over 30 yrs
- Air quality 2/10 Low 1 unhealthy d/yr today · 1 by 30 yrs out
Nearby sold comps map
Loading sold comps map…
Walkable amenities ~0.75 mi
Loading nearby amenities…
Taxation est. · year 1
- Rental income
- $19,105
- − Mortgage interest
- −$1,680
- − Property taxes
- −$556
- − Insurance
- −$150
- − Repairs & maintenance
- −$1,528
- − Management
- −$1,528
- − Depreciation
- −$873
- Taxable income
- $12,788
- Est. tax owed @ 24.0%
- −$3,069
- After-tax cash flow
- $9,429/yr
For passive investors: Depreciation is non-cash, so a rental often shows a tax loss while cash-flowing — sheltering income. Rental losses are passive: they offset passive income freely, and up to $25,000/yr can offset ordinary (W-2) income if you actively participate and your MAGI is under $100k (phasing out to $0 by $150k); unused losses carry forward. On sale, claimed depreciation is recaptured at up to 25%, and gains may owe capital-gains tax (a 1031 exchange can defer both). Figures are a year-1 estimate at your 24.0% rate — not tax advice; consult a CPA.
Schools (NCES district)
- District
- Troy City
- NCES district ID
- 0103330
- Math proficiency
- 21% ▼ -26.00%
- Reading proficiency
- 36% ▼ -3.00%
- Median HH income
- $30,426
- Composite
- 23.03/100
- National rank
- #7973
- State rank
- #80 of 129 in AL
Livability — Troy
- Score
- 64/100
- State rank
- #148
- US rank
- #13713
Category grades
Schools grade is shown separately in the Schools card above.
Census & demographics
- Census place
- Troy, AL
- County
- Pike County · 15,143 people
- City population
- 15,143
- Metro
- Troy, AL
- Population (ZIP)
- 15,143
- Household income
- $44,375
- Rent vs Own
- Severe rent burden
- 934.0
Population outlook (Pike County) Hauer SSP2
- Today (2025)
- 34,683 people
- By 2030
- 35,552 · +2.5%
- By 2040
- 37,056 · +6.8%
- By 2050
- 38,617 · +11.3%
- By 2075
- 43,393 · +25.1%
- By 2100
- 45,455 · +31.1%
Race, ethnicity, and origin ACS 2023
- Neighborhood character
- Diverse neighborhood (Simpson 0.56)
- Race & ethnicity
- White 51% Black 42% Asian 3% Two or more races 3%
- Common ancestry
- Italian 2% Lithuanian 1% Slovak 1%
- Foreign-born
- 4% · China, Canada
- Languages at home
- 96% English-only · Other Indo-European 2% Korean 1% Chinese 1%
Political lean MEDSL · Pike
- 2024 margin
- Strong R (+25.2) · D 37.1% · R 62.2%
- 2008→2024 swing
- -9.9pp toward R · 2008: -15.2pp · 2024: -25.2pp
- All cycles
- 2024: R+25.2 2020: R+17.4 2016: R+20.3 2012: R+13.7 2008: R+15.2
Not yet ingested
- Civics
- —
Market trends
- HPI YoY
- ▼ -55.93%
- Current HPI
- 128.0786
- Rent YoY
- —
- Metro
- Troy, AL
- State GDP YoY
- ▲ 2.94%
- F500 in state
- 4
Industry mix (Fortune 500 HQ in AL)
| Industry | F500 HQs | Revenue |
|---|---|---|
| Financial Services | 1 | $8B |
|
||
| Healthcare | 1 | $5B |
|
||
Price history
+400.0% since first listed3 events — show timeline
- 2026-06-06 Price Changed $30,000 Greater Alabama MLS
- 2026-05-13 Listed $38,000 Greater Alabama MLS
- 2019-02-13 Sold (Public Records) $6,000 Public Records
Property tax history
+2.7%/yrLatest (2025): $556 · +0.0% YoY. Source: county tax records.
Cash-flow waterfall
monthlySold comps — $/sqft
last 12 mo · ≤1 miLoading sold comps…