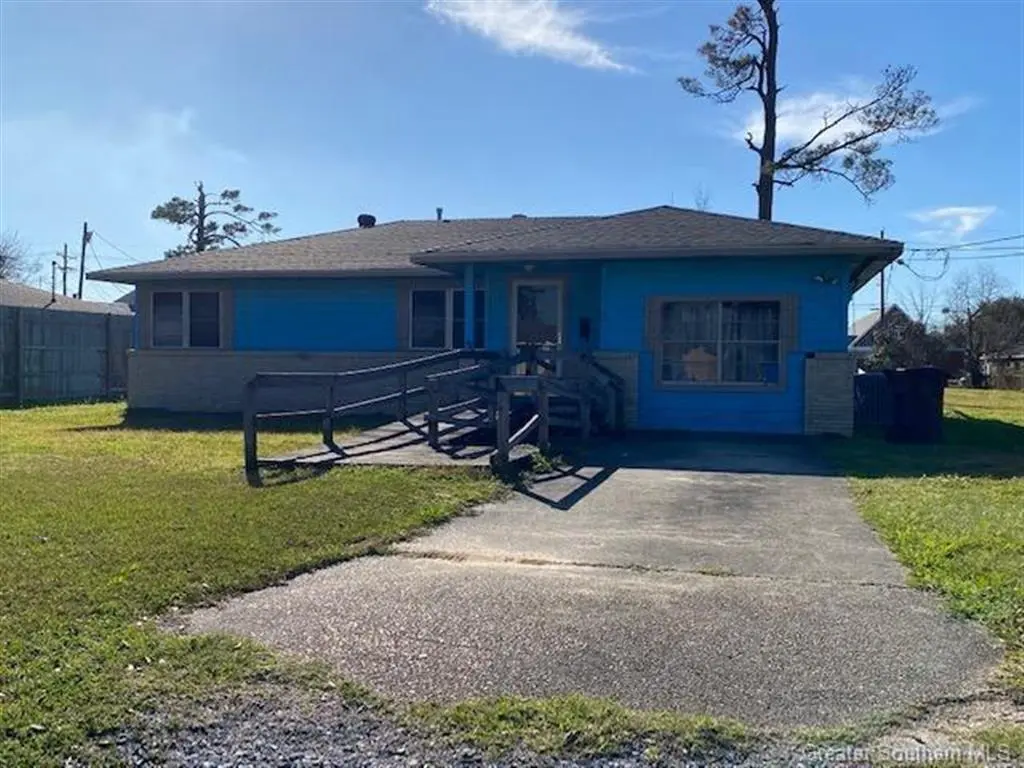
1313 Greenroad St · Westlake, LA
Flood risk 1/10 · Minimal
- FEMA flood zone
- X (unshaded)
- Chance of flooding over 30 yrs
- 0.0%
- Est. flood insurance / yr
- $507 – $1,088
Fire risk 2/10 · Minimal
- Est. fire insurance / yr
- $1,269 – $2,357
Heat risk 9/10 · Severe
- Hot days now (above 109°F)
- 7 days/yr
- Hot days in 30 yrs
- 22 days/yr
Wind risk 9/10 · Severe
- Chance of severe wind over 30 yrs
- 99.0%
Air-quality risk 2/10 · Minimal
- Unhealthy air days now
- 1 days/yr
- Unhealthy air days in 30 yrs
- 1 days/yr
Risk factors via First Street. Map © Google.
Why this score? — see what drove the B- grade
The composite is a weighted blend of 9 inputs, each scored 0–100. Each bar is that input's sub-score; the figure is the points it added to the 100-point composite (weight × sub-score).
- Cash flow +30.0/30.0
- 1% rule +10.0/10.0
- DSCR +10.0/10.0
- ARV discount +7.5/15.0
- Livability +3.3/5.0
- Schools +3.1/10.0
- Rent growth +2.5/5.0
- Condition / age +2.5/5.0
- Appreciation +0.0/10.0
$79,000
🖨 Deal sheet 📄 Offer letter ✓ Due diligence
Listing remarks MLS
GREAT INVESTMENT PROPERTY LOCATED IN WESTLAKE. 3 BEDROOM 1 1/2 BATHS. LOTS OF POTENTIAL. HOME BEING SOLD AS IS. LIVING ROOM HAS SOME DAMAGE NOTED TO THE FLOOR. USE CAUTION WHEN SHOWING THE HOME. AGE AND MEASUREMENTS M/L.
Key facts
- 0.32 acre lot
- Built 1960
- Listed 301 days
Neighborhood map
What this means for you Summary
Snapshot
- This is a 3-bed/1.5-bath single-family listed at $79k.
Deal economics
- At list price, monthly cash flow is $955 ($11k/yr) — positive.
- The deal already cash-flows at list — no discount required.
- Meets the 1% rule at list price ($2k rent vs $79k).
- Recommended offer: $70k (12.0% below list) — sets the bar for market timing.
- Cap rate 20.8% vs local median 6.4% in Westlake — top-decile yield for the area; either an underpriced asset or a hidden risk that comps aren't pricing in. Stress-test before assuming the spread holds.
Location & tenants
- Location reads 66/100 on livability (#120 in LA) — a middle-class / working-renter tenant base. Strengths: cost of living A+, housing A+, schools A; Watch: amenities F, commute F.
- Calcasieu Parish (other): math 30% / reading 44% proficiency, ranked #29 of 98 in LA (top 30%) — families likely to look elsewhere, expect single-tenant / working-renter base with shorter leases.
- Market conditions: 148 active listings in the ZIP; 1 comparable units currently listed for rent nearby; 1,298 units permitted in Calcasieu Parish in 2024 (526 in 5+ unit buildings).
- This rent runs 32% of the median local income ($69k/yr) — at the standard rent-burdened threshold; future hikes will face affordability resistance.
Forward outlook
- Local home prices are declining (-3.0%/yr); year-one equity from $546 of loan paydown is wiped out by about $2k of value loss. Plan a longer hold.
- Calcasieu County population projected at +11% by 2050 — modest demand growth; plan on rents tracking national, not racing it.
- At projected returns (-3.0% appreciation + 3.0% rent growth), your $22k cash investment doubles in ~3 years — after that, you're playing with house money.
Negotiation context
- It's been on market 301 days — a 12% lower offer ($70k) is reasonable based on typical stale-listing flexibility.
Risks & watch-outs
- Climate carrying-cost: severe wind risk, 99% chance of damaging wind over 30y; extreme-heat days projected 7→22/yr by 2055 (HVAC capex compounding) — expect insurance premiums to compound above CPI over the hold.
Questions for the listing agent
- It's been on market 301 days. Have you received any prior offers? Is the seller open to a 12% concession, seller financing, or rate buy-down credit?
- Built in 1960 — when were the roof, HVAC, electrical panel, plumbing, and water heater last replaced?
- Why hasn't it sold? Are there any deal-killer items the seller is aware of (foundation, flood, title, zoning, code violations)?
- Is there a deadline driving the sale (1031 exchange, divorce, estate, relocation)? That informs how much negotiation room exists.
- Schools are A-rated — typically a magnet for longer-tenancy family renters. What's the average tenant stay here, and is there a school-zone premium baked into asking?
- What's the average days-on-market for RENTAL listings here right now (not sales)? A rising rental-DOM trend means longer vacancies and softer asking-rent achievability than the comps imply.
- What's the recent tenant-quality profile in this submarket — average credit score on applications, eviction rate, late-payment / NSF rate, and stable-employment percentage? A property-management company in the area should have these aggregated.
- How much new for-sale + rental construction is in the pipeline within 1–3 miles? Heavy new supply typically softens prices + rents 12–24 months out; constrained supply supports both.
Investment metrics
- 1% rule
- 2.33% ✓
- Cap rate
- 20.80%
- Cash-on-cash
- 51.81%
- DSCR
- 3.31
- GRM
- 3.6
CMA / ARV
- ARV (median comp)
- $160,688
- List price
- $79,000
- Delta
- -50.84%
- Verdict
- UNDERPRICED
- Comps
- 20 within 1.0 mi
Show comp detail 12 sales within ~0.75 mi
| Address | Dist | Beds/Ba | Sqft | Sold | Price | $/sf | Match |
|---|---|---|---|---|---|---|---|
| 1521 Matilda St | 0.18mi | 3/2.0 | 1,352 (+1%) | 3mo | $200,000 | $148 | 86 |
| 1216 Continental Blvd | 0.13mi | 3/1.0 | 1,308 (-3%) | 3mo | $132,000 | $101 | 85 |
| 800 Tillman St | 0.09mi | 3/1.0 | 1,312 (-2%) | 18mo | $155,000 | $118 | 75 |
| 815 Wehrt St | 0.06mi | 3/1.0 | 1,264 (-6%) | 21mo | $148,700 | $118 | 68 |
| 801 Cedar St | 0.34mi | 3/2.0 | 1,311 (-2%) | 13mo | $190,000 | $145 | 67 |
| 1112 Dewey St | 0.26mi | 3/2.0 | 1,435 (+7%) | 10mo | $117,000 | $82 | 66 |
| 1301 Matilda St St | 0.13mi | 3/2.0 | 1,516 (+13%) | 6mo | $80,000 | $53 | 65 |
| 1513 Guillory St | 0.59mi | 3/2.0 | 1,368 (+2%) | 6mo | $178,000 | $130 | 62 |
| 1724 Saint John Bosco St | 0.63mi | 3/1.0 | 1,250 (-7%) | 15mo | $135,000 | $108 | 45 |
| 920 Live Oak St | 0.66mi | 3/2.0 | 1,500 (+12%) | 13mo | $208,000 | $139 | 37 |
| 215 River Oaks Dr | 0.71mi | 3/2.0 | 1,470 (+9%) | 19mo | $223,000 | $152 | 33 |
| 923 Live Oak St | 0.62mi | 3/2.0 | 1,496 (+11%) | 21mo | $185,000 | $124 | 33 |
Match score weights: distance 35% · size 25% · config 20% · recency 20%. Top-matched comps best support the ARV.
Projected returns pro-forma
-3.0% appreciation · 3.0% rent growth · sell at horizon
- IRR
- 49.7%
- Equity multiple
- 3.17×
- Total profit
- $48,023
- Equity at exit
- $11,779
- IRR
- 55.2%
- Equity multiple
- 6.43×
- Total profit
- $120,136
- Equity at exit
- $6,830
Cash invested: $22,120 (down + closing). Projections, not guarantees.
Landlord ↔ Tenant lean methodology
- Overall (STATE)
- 90 Strongly Landlord-Friendly
- State Louisiana
- 90 Strongly Landlord-Friendly · R+12
- County
- — inherits STATE
- City
- — inherits STATE
ZIP-level market 70669
- Active inventory
- 148
- Price-to-rent
- 3.6×
Monthly cashflow live
- Estimated rent
- $1,841 medium interval (Pro) →
- Mortgage (P&I)
- −$414
- Tax from tax record
- −$52 /mo · $625/yr
- Insurance
- −$33
- HOA
- −$0
- Vacancy / Maint / Mgmt
- −$387
- Net cashflow
- $955
Break-even live
UW: 25.0% down · 7.5% · 30yr · 1.5% tax · 5.0% vac · 8.0% maint · 8.0% mgmt
Financing live
Cash to close
- Down payment
- $19,750
- Closing costs
- $2,370
- Reserves months
- —
- Total cash needed
- —
Loan-product check · same deal, 3 products live
Conventional
25% down · 7.5% · 30yr
- Down + closing
- —
- Monthly P&I
- —
- Monthly cashflow
- —
- DSCR
- —
- Eligible?
- —
Personal DTI + credit; lowest rate.
DSCR
20% down · 8.5% · 30yr
- Down + closing
- —
- Monthly P&I
- —
- Monthly cashflow
- —
- DSCR
- —
- Eligible?
- —
No personal income docs; deal must DSCR.
Hard money
10% down · 12.0% · 12mo
- Down + closing
- —
- Monthly P&I
- —
- Monthly cashflow
- —
- DSCR
- —
- Eligible?
- —
Short-term bridge; refi at stabilization.
Rent comps 1 comps
| Address | Beds | Baths | Sqft | Rent | $/sqft | DOM | Units | Dist |
|---|---|---|---|---|---|---|---|---|
| 909 Wehrt St Westlake, LA | 4.0 | 2.0 | 1819 | $4,250 | $2.34 | 43d | 1 | 0.06mi |
Listing history 8 events
-
2026-06-03status $79,000 Pending 301 DOM
-
2026-06-02days on market $79,000 Active 301 DOM
-
2026-06-01days on market $79,000 Active 300 DOM
-
2026-05-31days on market $79,000 Active 299 DOM
-
2026-05-30days on market $79,000 Active 298 DOM
-
2026-04-29price $79,000 220-char remark
Show marketing remark (220 chars)
GREAT INVESTMENT PROPERTY LOCATED IN WESTLAKE. 3 BEDROOM 1 1/2 BATHS. LOTS OF POTENTIAL. HOME BEING SOLD AS IS. LIVING ROOM HAS SOME DAMAGE NOTED TO THE FLOOR. USE CAUTION WHEN SHOWING THE HOME. AGE AND MEASUREMENTS M/L.
-
2025-08-31price $89,000 220-char remark
Show marketing remark (220 chars)
GREAT INVESTMENT PROPERTY LOCATED IN WESTLAKE. 3 BEDROOM 1 1/2 BATHS. LOTS OF POTENTIAL. HOME BEING SOLD AS IS. LIVING ROOM HAS SOME DAMAGE NOTED TO THE FLOOR. USE CAUTION WHEN SHOWING THE HOME. AGE AND MEASUREMENTS M/L.
-
2025-02-26$109,900 Active 220-char remark
Show marketing remark (220 chars)
GREAT INVESTMENT PROPERTY LOCATED IN WESTLAKE. 3 BEDROOM 1 1/2 BATHS. LOTS OF POTENTIAL. HOME BEING SOLD AS IS. LIVING ROOM HAS SOME DAMAGE NOTED TO THE FLOOR. USE CAUTION WHEN SHOWING THE HOME. AGE AND MEASUREMENTS M/L.
ⓘ Source: listings_history table (triggers on properties + properties_extension) + one-shot
backfill from property_details.listing_events for pre-trigger history.
Tax reassessment forecast LA · Resets to sale price
- Current annual tax
- $625 · $52/mo
- Projected year-2 tax
- $625 · $52/mo
- Expected delta
- $0/yr ($0/mo · 0.0%)
ⓘ Screening estimate from a state-policy table — verify with the county assessor before closing.
Climate risk First Street
- Flood 1/10 Low FEMA zone X (unshaded) · 0% chance over 30 yrs
- Wildfire 2/10 Low
- Heat 9/10 Extreme 7 d/yr ≥109°F today · 22 d/yr by 30 yrs out
- Wind 9/10 Extreme 99% chance of damaging wind over 30 yrs
- Air quality 2/10 Low 1 unhealthy d/yr today · 1 by 30 yrs out
Nearby sold comps map
Loading sold comps map…
Walkable amenities ~0.75 mi
Loading nearby amenities…
Taxation est. · year 1
- Rental income
- $22,090
- − Mortgage interest
- −$4,425
- − Property taxes
- −$625
- − Insurance
- −$395
- − Repairs & maintenance
- −$1,767
- − Management
- −$1,767
- − Depreciation
- −$2,298
- Taxable income
- $10,813
- Est. tax owed @ 24.0%
- −$2,595
- After-tax cash flow
- $8,865/yr
For passive investors: Depreciation is non-cash, so a rental often shows a tax loss while cash-flowing — sheltering income. Rental losses are passive: they offset passive income freely, and up to $25,000/yr can offset ordinary (W-2) income if you actively participate and your MAGI is under $100k (phasing out to $0 by $150k); unused losses carry forward. On sale, claimed depreciation is recaptured at up to 25%, and gains may owe capital-gains tax (a 1031 exchange can defer both). Figures are a year-1 estimate at your 24.0% rate — not tax advice; consult a CPA.
Schools (NCES district)
- District
- Calcasieu Parish
- NCES district ID
- 2200330
- Math proficiency
- 30% ▼ -39.00%
- Reading proficiency
- 44% ▼ -33.00%
- Median HH income
- $44,700
- Composite
- 31.45/100
- National rank
- #5979
- State rank
- #29 of 98 in LA
Livability — Westlake
- Score
- 66/100
- State rank
- #120
- US rank
- #11457
Category grades
Schools grade is shown separately in the Schools card above.
Census & demographics
- Census place
- Westlake, LA
- County
- Calcasieu Parish · 170,889 people
- City population
- 9,552
- Metro
- Lake Charles, LA
- Population (ZIP)
- 9,552
- Household income
- $69,106
- Rent vs Own
- Severe rent burden
- 178.0
Population outlook (Calcasieu County) Hauer SSP2
- Today (2025)
- 212,179 people
- By 2030
- 218,199 · +2.8%
- By 2040
- 228,486 · +7.7%
- By 2050
- 236,208 · +11.3%
- By 2075
- 251,696 · +18.6%
- By 2100
- 247,848 · +16.8%
Race, ethnicity, and origin ACS 2023
- Neighborhood character
- Predominantly White (82%)
- Race & ethnicity
- White 82% Black 9% Two or more races 4% Hispanic / Latino 4% Asian 3%
- Common ancestry
- Lithuanian 7% Serbian 2% Italian 1%
- Foreign-born
- 3% · Canada, South Korea
- Languages at home
- 93% English-only · Other Asian/Pacific 3% Spanish 2% French/Haitian/Cajun 1%
Political lean MEDSL · Calcasieu
- 2024 margin
- Solid R (+39.6) · D 29.5% · R 69.0% · Other 1.5%
- 2008→2024 swing
- -15.0pp toward R · 2008: -24.6pp · 2024: -39.6pp
- All cycles
- 2024: R+39.6 2020: R+35.2 2016: R+33.3 2012: R+28.7 2008: R+24.6
Not yet ingested
- Civics
- —
Market trends
- HPI YoY
- ▼ -107.45%
- Current HPI
- 81.9801
- Rent YoY
- —
- Metro
- Lake Charles, LA
- State GDP YoY
- ▲ 3.29%
- F500 in state
- 10
Industry mix (Fortune 500 HQ in LA)
| Industry | F500 HQs | Revenue |
|---|---|---|
| Telecommunications | 2 | $23B |
|
||
| Utilities | 1 | $12B |
|
||
| Wholesale / Distribution | 1 | $5B |
|
||
| Advertising | 1 | $2B |
|
||
Price history
-28.1% since first listed3 events — show timeline
- 2026-04-29 Price Changed $79,000 SWLAR
- 2025-08-31 Price Changed $89,000 SWLAR
- 2025-02-26 Listed $109,900 SWLAR
Property tax history
+1.5%/yrLatest (2025): $625 · +3.2% YoY. Source: county tax records.
Cash-flow waterfall
monthlySold comps — $/sqft
last 12 mo · ≤1 miLoading sold comps…