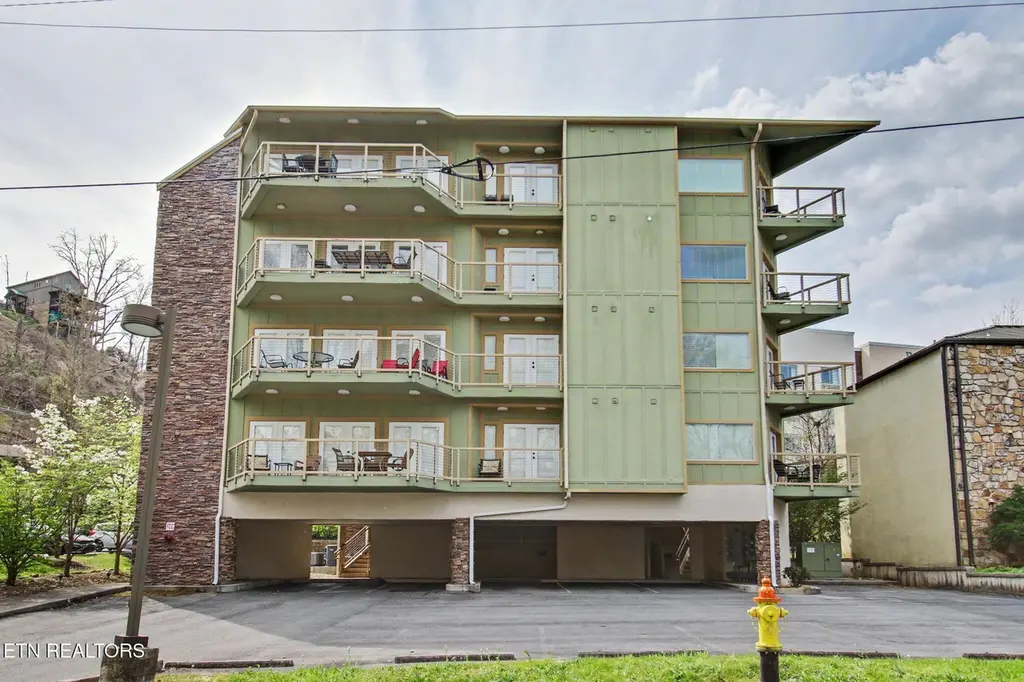
513 Mccarter Rd Unit 4 m · Gatlinburg, TN
Flood risk 9/10 · Severe
- FEMA flood zone
- X (unshaded)
- Chance of flooding over 30 yrs
- 0.99%
- Est. flood insurance / yr
- $507 – $1,088
Fire risk 4/10 · Minor
- Est. fire insurance / yr
- $949 – $1,763
Heat risk 5/10 · Moderate
- Hot days now (above 92°F)
- 8 days/yr
- Hot days in 30 yrs
- 25 days/yr
Wind risk 2/10 · Minimal
- Chance of severe wind over 30 yrs
- —
Air-quality risk 4/10 · Minor
- Unhealthy air days now
- 5 days/yr
- Unhealthy air days in 30 yrs
- 5 days/yr
Risk factors via First Street. Map © Google.
Why this score? — see what drove the C grade
The composite is a weighted blend of 9 inputs, each scored 0–100. Each bar is that input's sub-score; the figure is the points it added to the 100-point composite (weight × sub-score).
- Cash flow +19.9/30.0
- ARV discount +13.7/15.0
- DSCR +6.3/10.0
- 1% rule +6.1/10.0
- Condition / age +3.8/5.0
- Livability +3.7/5.0
- Rent growth +2.5/5.0
- Schools +2.5/10.0
- Appreciation +0.0/10.0
$449,000
🖨 Deal sheet 📄 Offer letter ✓ Due diligence
Listing remarks MLS
Location Location Location. Appropriately named The Heart of Gatlinburg!. This walk to the Parkway 2/2 Luxury Gatlinburg condo is a limited opportunity with only 8 units so they don't come up for sale very often. The unit is facing the direction of the parkway and you have the whole level on this side of the building. The balconies are amazing. Beautiful interior and furnishings make this unit a winner for the person that wants to own an amazing property to use, as well as a come and park kind of vacation experience for all your guests and renters...
Key facts
- Heart of gatlinburg
- Amazing balconies
- Walk to the parkway
Tags
Neighborhood map
What this means for you Summary
Snapshot
- This is a 2-bed/2.0-bath condo listed at $449k. Condition is rated good.
Deal economics
- At list price, monthly cash flow is $477 ($6k/yr) — positive.
- The deal already cash-flows at list — no discount required.
- Meets the 1% rule at list price ($5k rent vs $449k).
- Recommended offer: $422k (6.0% below list) — sets the bar for market timing.
- Cap rate 7.7% vs local median 1.3% in Gatlinburg — top-decile yield for the area; either an underpriced asset or a hidden risk that comps aren't pricing in. Stress-test before assuming the spread holds.
Location & tenants
- Location reads 73/100 on livability (#27 in TN) — a middle-class / working-renter tenant base. Strengths: commute A+, cost of living A; Watch: schools D-, crime F, amenities F.
- Sevier County (rural): math 31% / reading 28% proficiency, ranked #62 of 139 in TN (top 45%) — low school quality limits family demand, transient renter base, plan for 1-2y turnover.
- Market conditions: 696 active listings in the ZIP; 1 comparable units currently listed for rent nearby; 1,594 units permitted in Sevier County in 2024 (456 in 5+ unit buildings).
Forward outlook
- Local home prices are declining (-3.0%/yr); year-one equity from $3k of loan paydown is wiped out by about $13k of value loss. Plan a longer hold.
- Sevier County population projected at +22% by 2050 — long-run rental-demand tailwind backs the buy-and-hold thesis.
Negotiation context
- It's been on market 65 days — a 6% lower offer ($422k) is reasonable based on typical stale-listing flexibility.
- 4 sale attempts since 14y ago; this cycle's ask has dropped $50k (10%) from the opening price — seller is motivated, your offer sets the floor, not the list.
- Current owner paid $224k; list at $449k implies a 101% gain — meaningful room to come down on a strong offer.
Risks & watch-outs
- Watch-outs: flood insurance adds $66/mo.
- Climate carrying-cost: severe flood risk; extreme-heat days projected 8→25/yr by 2055 (HVAC capex compounding) — expect insurance premiums to compound above CPI over the hold.
Questions for the listing agent
- It's been on market 65 days. Have you received any prior offers? Is the seller open to a 6% concession, seller financing, or rate buy-down credit?
- What's the actual annual flood-insurance premium (NFIP or private), and is the property in a SFHA with mandatory coverage?
- What does the HOA fee cover, when was the last increase, and are there any pending special assessments or reserve-fund shortfalls?
- Any open or pending special assessments — roof, HVAC, plumbing, elevator, façade? What's the per-unit balance and payoff schedule, and is the seller paying it off at close or rolling it to the buyer?
- Why hasn't it sold? Are there any deal-killer items the seller is aware of (foundation, flood, title, zoning, code violations)?
- Is there a deadline driving the sale (1031 exchange, divorce, estate, relocation)? That informs how much negotiation room exists.
- Schools are D-rated, which usually means shorter tenancies and higher turnover. Who's the typical renter profile here, and what's been the actual vacancy rate?
- Crime grade is F in this area — have there been break-ins, vandalism, or insurance claims at this property in the last 3 years? What carrier currently insures it and at what premium?
- What's the average days-on-market for RENTAL listings here right now (not sales)? A rising rental-DOM trend means longer vacancies and softer asking-rent achievability than the comps imply.
- What's the recent tenant-quality profile in this submarket — average credit score on applications, eviction rate, late-payment / NSF rate, and stable-employment percentage? A property-management company in the area should have these aggregated.
- How much new apartment / multifamily construction is in the pipeline within 1–3 miles? Heavy new supply (>2% of stock underway) typically softens rents 12–24 months out; light construction supports rent growth.
Investment metrics
- 1% rule
- 1.11% ✓
- Cap rate
- 7.74%
- Cash-on-cash
- 5.18%
- DSCR
- 1.23
- GRM
- 7.5
CMA / ARV
- ARV (median comp)
- $520,475
- List price
- $449,000
- Delta
- -13.73%
- Verdict
- UNDERPRICED
- Comps
- 20 within 1.0 mi
Projected returns pro-forma
-3.0% appreciation · 3.0% rent growth · sell at horizon
- IRR
- -9.1%
- Equity multiple
- 0.67×
- Total profit
- $-42,098
- Equity at exit
- $66,947
- IRR
- 0.4%
- Equity multiple
- 1.03×
- Total profit
- $3,654
- Equity at exit
- $38,821
Cash invested: $125,720 (down + closing). Projections, not guarantees.
Landlord ↔ Tenant lean methodology
- Overall (STATE)
- 87 Strongly Landlord-Friendly
- State Tennessee
- 87 Strongly Landlord-Friendly · R+13
- County
- — inherits STATE
- City
- — inherits STATE
ZIP-level market 37738
- Home prices YoY
- -28.5%
- Active inventory
- 696
- Price-to-rent
- 7.5×
Monthly cashflow live
- Estimated rent
- $4,995 medium interval (Pro) →
- Mortgage (P&I)
- −$2,355
- Tax est. 1.5%
- −$561 /mo · $6,735/yr
- Insurance
- −$187
- Flood insurance flood zone
- −$66 /mo · $798/yr
- HOA
- −$300
- Vacancy / Maint / Mgmt
- −$1,049
- Net cashflow
- $477
Break-even live
UW: 25.0% down · 7.5% · 30yr · 1.5% tax · 5.0% vac · 8.0% maint · 8.0% mgmt
Financing live
Cash to close
- Down payment
- $112,250
- Closing costs
- $13,470
- Reserves months
- —
- Total cash needed
- —
Loan-product check · same deal, 3 products live
Conventional
25% down · 7.5% · 30yr
- Down + closing
- —
- Monthly P&I
- —
- Monthly cashflow
- —
- DSCR
- —
- Eligible?
- —
Personal DTI + credit; lowest rate.
DSCR
20% down · 8.5% · 30yr
- Down + closing
- —
- Monthly P&I
- —
- Monthly cashflow
- —
- DSCR
- —
- Eligible?
- —
No personal income docs; deal must DSCR.
Hard money
10% down · 12.0% · 12mo
- Down + closing
- —
- Monthly P&I
- —
- Monthly cashflow
- —
- DSCR
- —
- Eligible?
- —
Short-term bridge; refi at stabilization.
Rent comps 1 comps
| Address | Beds | Baths | Sqft | Rent | $/sqft | DOM | Units | Dist |
|---|---|---|---|---|---|---|---|---|
| 327 E Holly Ridge Rd Gatlinburg, TN | 3.0 | 3.0 | 1657 | $4,995 | $3.01 | 23d | 1 | 0.39mi |
HOA detail condo
- Monthly dues
- $300 · $3,600/yr
- Assessments
- None detected in remarks — confirm with the listing agent.
Listing history 21 events
-
2026-06-19days on market $449,000 Active 65 DOM
-
2026-06-18days on market $449,000 Active 64 DOM
-
2026-06-17days on market $449,000 Active 63 DOM
-
2026-06-16days on market $449,000 Active 62 DOM
-
2026-06-15days on market $449,000 Active 61 DOM
-
2026-06-14days on market $449,000 Active 59 DOM
-
2026-06-13days on market $449,000 Active 58 DOM
-
2026-06-10days on market $449,000 Active 56 DOM
-
2026-06-09days on market $449,000 Active 55 DOM
-
2026-06-08days on market $449,000 Active 54 DOM
-
2026-06-07pricedays on market $449,000 Active 53 DOM
-
2026-06-02days on market $499,000 Active 48 DOM
-
2026-06-01days on market $499,000 Active 47 DOM
-
2026-05-31days on market $499,000 Active 46 DOM
-
2026-05-30days on market $499,000 Active 45 DOM
-
2026-04-06$499,000 Active 556-char remark
Show marketing remark (556 chars)
Location Location Location. Appropriately named The Heart of Gatlinburg!. This walk to the Parkway 2/2 Luxury Gatlinburg condo is a limited opportunity with only 8 units so they don't come up for sale very often. The unit is facing the direction of the parkway and you have the whole level on this side of the building. The balconies are amazing. Beautiful interior and furnishings make this unit a winner for the person that wants to own an amazing property to use, as well as a come and park kind of vacation experience for all your guests and renters...
-
2026-04-02$499,000 Active 557-char remark
Show marketing remark (557 chars)
Location Location Location. Appropriately named The Heart of Gatlinburg!. This walk to the Parkway 2/2 Luxury Gatlinburg condo is a limited opportunity with only 8 units so they don't come up for sale very often. The unit is facing the direction of the parkway and you have the whole level on this side of the building. The balconies are amazing. Beautiful interior and furnishings make this unit a winner for the person that wants to own an amazing property to use, as well as a come and park kind of vacation experience for all your guests and renters. ..
-
2018-11-30soldstatus $223,900
-
2015-12-11soldstatus $174,500
-
2014-04-25$185,000
-
2012-11-14$184,900
ⓘ Source: listings_history table (triggers on properties + properties_extension) + one-shot
backfill from property_details.listing_events for pre-trigger history.
Climate risk First Street
- Flood 9/10 Extreme FEMA zone X (unshaded) · 99% chance over 30 yrs
- Wildfire 4/10 Moderate
- Heat 5/10 Major 8 d/yr ≥92°F today · 25 d/yr by 30 yrs out
- Wind 2/10 Low
- Air quality 4/10 Moderate 5 unhealthy d/yr today · 5 by 30 yrs out
Nearby sold comps map
Loading sold comps map…
Walkable amenities ~0.75 mi
Loading nearby amenities…
Taxation est. · year 1
- Rental income
- $59,940
- − Mortgage interest
- −$25,151
- − Property taxes
- −$6,735
- − Insurance
- −$3,042
- − Repairs & maintenance
- −$4,795
- − Management
- −$4,795
- − HOA
- −$3,600
- − Depreciation
- −$13,062
- Taxable loss
- −$1,241
- Est. tax savings @ 24.0%
- +$298
- After-tax cash flow
- $6,018/yr
For passive investors: Depreciation is non-cash, so a rental often shows a tax loss while cash-flowing — sheltering income. Rental losses are passive: they offset passive income freely, and up to $25,000/yr can offset ordinary (W-2) income if you actively participate and your MAGI is under $100k (phasing out to $0 by $150k); unused losses carry forward. On sale, claimed depreciation is recaptured at up to 25%, and gains may owe capital-gains tax (a 1031 exchange can defer both). Figures are a year-1 estimate at your 24.0% rate — not tax advice; consult a CPA.
Condition & rehab AI · 6 photos
This well-maintained and updated condo is in good condition with no visible repairs needed. It offers a great location and potential for further value through cosmetic updates.
Value-add opportunities
- Both Painting the exterior and interior — Fresh paint can enhance the curb appeal and interior aesthetics.
- Both Updating the flooring — New flooring can improve the overall look and feel of the home.
- Both Updating the kitchen and bathrooms — Modernizing the kitchen and bathrooms can attract more buyers and renters.
- Both Upgrading the HVAC system — A new HVAC system can improve comfort and energy efficiency.
- Both Landscaping improvements — Enhancing the landscaping can increase curb appeal and attract more buyers and renters.
Renovation cost estimate screening
Value-add ROI direction
- Both Painting the exterior and interior — Fresh paint can enhance the curb appeal and interior aesthetics. ↑
- Both Updating the flooring — New flooring can improve the overall look and feel of the home. ↑
- Both Updating the kitchen and bathrooms — Modernizing the kitchen and bathrooms can attract more buyers and renters. ↑
- Both Upgrading the HVAC system — A new HVAC system can improve comfort and energy efficiency. ↑
- Both Landscaping improvements — Enhancing the landscaping can increase curb appeal and attract more buyers and renters. ↑
ⓘ Cost ranges are severity-bucket heuristics (US national rule-of-thumb). Get contractor quotes + a written scope before underwriting a rehab budget.
Schools (NCES district)
- District
- Sevier County
- NCES district ID
- 4703780
- Math proficiency
- 31% ▼ -6.00%
- Reading proficiency
- 28% ▼ -4.00%
- Median HH income
- $42,730
- Composite
- 25.12/100
- National rank
- #7527
- State rank
- #62 of 139 in TN
Livability — Gatlinburg
- Score
- 73/100
- State rank
- #27
- US rank
- #5524
Category grades
Schools grade is shown separately in the Schools card above.
Census & demographics
- Census place
- Gatlinburg, TN
- Population (ZIP)
- 5,269
Population outlook (Sevier County) Hauer SSP2
- Today (2025)
- 107,903 people
- By 2030
- 113,633 · +5.3%
- By 2040
- 123,969 · +14.9%
- By 2050
- 132,123 · +22.4%
- By 2075
- 148,524 · +37.6%
- By 2100
- 153,436 · +42.2%
Race, ethnicity, and origin ACS 2023
- Neighborhood character
- Predominantly White (81%)
- Race & ethnicity
- White 81% Hispanic / Latino 12% Two or more races 4% Black 3% Asian 3%
- Hispanic origin (detail)
- Mexican 2%
- Common ancestry
- Slovak 6% Serbian 5% Romanian 3%
- Foreign-born
- 12% · Canada, China
- Languages at home
- 86% English-only · Spanish 10% Other Indo-European 2% Chinese 1%
Political lean MEDSL · Sevier
- 2024 margin
- Solid R (+61.1) · D 18.9% · R 80.1% · Other 1.0%
- 2008→2024 swing
- -13.1pp toward R · 2008: -48.1pp · 2024: -61.1pp
- All cycles
- 2024: R+61.1 2020: R+57.6 2016: R+61.7 2012: R+54.8 2008: R+48.1
Not yet ingested
- Civics
- —
Market trends
- HPI YoY
- ▼ -118.02%
- Current HPI
- 296.203
- Rent YoY
- —
- Metro
- —
- State GDP YoY
- ▲ 2.78%
- F500 in state
- 22
Industry mix (Fortune 500 HQ in TN)
| Industry | F500 HQs | Revenue |
|---|---|---|
| Healthcare | 3 | $91B |
|
||
| Retail | 3 | $72B |
|
||
| Transportation / Logistics | 1 | $88B |
|
||
| Paper / Packaging | 1 | $19B |
|
||
| Insurance | 1 | $13B |
|
||
| Energy | 1 | $12B |
|
||
Price history
+169.9% since first listed6 events — show timeline
- 2026-04-06 Listed $499,000 Knoxville MLS
- 2026-04-02 Listed $499,000 GSMAR
- 2018-11-30 Sold (MLS) $223,900 GSMAR
- 2015-12-11 Sold (MLS) $174,500 TVRMLS
- 2014-04-25 Listed $185,000 TVRMLS
- 2012-11-14 Listed $184,900 GSMAR
Cash-flow waterfall
monthlySold comps — $/sqft
last 12 mo · ≤1 miLoading sold comps…