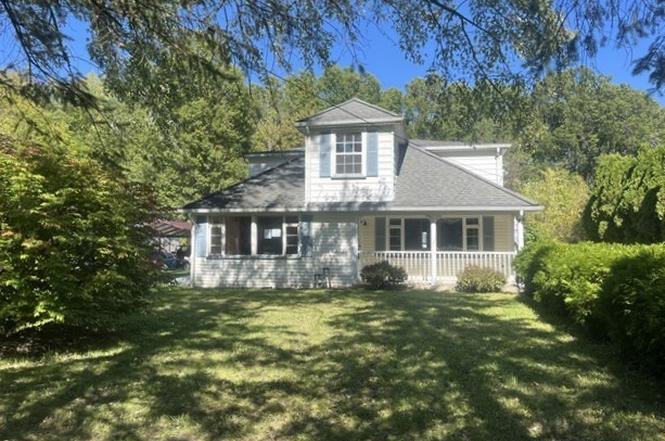
8629 Huntley Dr SE · Howland Center, OH
Flood risk 1/10 · Minimal
- FEMA flood zone
- X (unshaded)
- Chance of flooding over 30 yrs
- 0.0%
- Est. flood insurance / yr
- $473 – $860
Fire risk 1/10 · Minimal
- Est. fire insurance / yr
- $713 – $1,323
Heat risk 2/10 · Minimal
- Hot days now (above 97°F)
- 6 days/yr
- Hot days in 30 yrs
- 15 days/yr
Wind risk 1/10 · Minimal
- Chance of severe wind over 30 yrs
- —
Air-quality risk 3/10 · Minor
- Unhealthy air days now
- 1 days/yr
- Unhealthy air days in 30 yrs
- 4 days/yr
Risk factors via First Street. Map © Google.
Why this score? — see what drove the B grade
The composite is a weighted blend of 9 inputs, each scored 0–100. Each bar is that input's sub-score; the figure is the points it added to the 100-point composite (weight × sub-score).
- Cash flow +30.0/30.0
- DSCR +10.0/10.0
- 1% rule +9.9/10.0
- ARV discount +7.5/15.0
- Schools +5.3/10.0
- Livability +3.8/5.0
- Rent growth +2.5/5.0
- Condition / age +2.5/5.0
- Appreciation +0.0/10.0
$110,000
🖨 Deal sheet (PDF) 📄 Offer letter ✓ Due diligence
Listing remarks
Bigger than it Looks! Tucked away on a private dead end street in Howland is this 6 Bedroom, 3.5 Bath Home. There is a Living room with Fireplace, a huge Kitchen, 1st floor Master Suite, 1st floor Laundry, Garage has a 2nd floor, great for storage. Tons of Potential! There is an extra lot that goes with property acreage is . 55. The lot is on the other side of the neighbors to the left. You will see a small wooded area and that goes with subject . This is a HUD property managed by Raine Company - Case #412-942082 - Property is being sold "As Is". Neither the Seller nor its representatives make any representations or warranties regarding the Property. Buyer to do due diligence. IE
Key facts
- Huge kitchen
- 1st floor laundry
- 0.59 acre lot
Tags
Property features AI
Exterior
- Parking: Detached 2-car garage; Driveway parking
- Utilities: Public sewer; Well water
- Home design: Two-story home; Above-grade finished area approximately 2,613
- Construction: Asphalt/fiberglass roof; Year built (public records)
- Exterior features: Driveway; Detached garage; Garage access
Interior
- Kitchen: Eat-in kitchen
- Bedrooms: Two main-level bedrooms; Additional bedrooms on first and second levels (total bedrooms listed across levels)
- Bathrooms: Three full bathrooms; One half bathroom; Two main-level bathrooms
- Heating & cooling: Gas heating
- Interior features: Living room with fireplace; Partial, unfinished basement; Eat-in kitchen; Bonus room
Neighborhood map
What this means for you Summary
Snapshot
- This is a 3-bed/1.0-bath single-family listed at $110k.
Deal economics
- At list price, monthly cash flow is $469 ($6k/yr) — positive.
- The deal already cash-flows at list — no discount required.
- Meets the 1% rule at list price ($2k rent vs $110k).
- Recommended offer: $107k (3.0% below list) — sets the bar for market timing.
- Cap rate 11.4% vs local median 3.9% in Howland Center — top-decile yield for the area; either an underpriced asset or a hidden risk that comps aren't pricing in. Stress-test before assuming the spread holds.
Location & tenants
- Location reads 76/100 on livability (#207 in OH, #3,283 nationally) — a middle-class / working-renter tenant base. Strengths: cost of living A+, housing A+, health & safety A+; Watch: amenities F, commute F.
- Howland Local (suburban): math 59% / reading 65% proficiency, ranked #260 of 656 in OH (top 40%) — acceptable for families but not a draw, mixed tenant base, ~2y average lease.
- Zoned schools: Howland Springs Elementary School (235 students, 42% FRL); Howland Middle School (math 56% / reading 66%, grade B+, #252 of 654 statewide, top 39%, 766 students, 38% FRL); Howland High School (math 58% / reading 74%, grade B, #155 of 781 statewide, top 20%, 742 students, 38% FRL).
- Market conditions: 90 active listings in the ZIP; 2 comparable units currently listed for rent nearby; 129 units permitted in Trumbull County in 2024 (0 in 5+ unit buildings).
- This rent runs 30% of the median local income ($65k/yr) — at the standard rent-burdened threshold; future hikes will face affordability resistance.
Forward outlook
- Local home prices are declining (-3.0%/yr); year-one equity from $761 of loan paydown is wiped out by about $3k of value loss. Plan a longer hold.
- Trumbull County population projected at -22% by 2050 — secular population decline; favor cash flow + early exit over multi-decade hold.
- At projected returns (-3.0% appreciation + 3.0% rent growth), your $31k cash investment doubles in ~7 years — after that, you're playing with house money.
Negotiation context
- It's been on market 54 days — a 3% lower offer ($107k) is reasonable based on typical stale-listing flexibility.
- 6 sale attempts; this cycle's ask has dropped $30k (21%) from the opening price — seller is motivated, your offer sets the floor, not the list.
Risks & watch-outs
- Watch-outs: built in 1950 — expect roof / HVAC / electrical / plumbing capex.
Questions for the listing agent
- It's been on market 54 days. Have you received any prior offers? Is the seller open to a 3% concession, seller financing, or rate buy-down credit?
- Built in 1950 — when were the roof, HVAC, electrical panel, plumbing, and water heater last replaced?
- Is there a deadline driving the sale (1031 exchange, divorce, estate, relocation)? That informs how much negotiation room exists.
- Schools are B-rated — typically a magnet for longer-tenancy family renters. What's the average tenant stay here, and is there a school-zone premium baked into asking?
- What's the average days-on-market for RENTAL listings here right now (not sales)? A rising rental-DOM trend means longer vacancies and softer asking-rent achievability than the comps imply.
- What's the recent tenant-quality profile in this submarket — average credit score on applications, eviction rate, late-payment / NSF rate, and stable-employment percentage? A property-management company in the area should have these aggregated.
- How much new for-sale + rental construction is in the pipeline within 1–3 miles? Heavy new supply typically softens prices + rents 12–24 months out; constrained supply supports both.
Investment metrics
- 1% rule
- 1.49% ✓
- Cap rate
- 11.41%
- Cash-on-cash
- 18.28%
- DSCR
- 1.81
- GRM
- 5.6
CMA / ARV
- ARV (on-the-fly)
- $237,541
- Comps found
- 5
Show comp detail 5 sales within ~0.75 mi
| Address | Dist | Beds/Ba | Sqft | Sold | Price | $/sf | Match |
|---|---|---|---|---|---|---|---|
| 822 Shadowood Ln SE | 0.23mi | 4/3.0 (+1) | 1,513 (0%) | 4mo | $299,500 | $198 | 73 |
| 732 Laurelwood Dr SE | 0.68mi | 3/1.5 | 1,506 (-0%) | 10mo | $210,000 | $139 | 57 |
| 459 Willow Dr SE | 0.72mi | 3/2.0 | 1,362 (-10%) | 20mo | $180,000 | $132 | 29 |
| 550 Chipola Ct SE | 0.71mi | 3/1.5 | 1,656 (+10%) | 24mo | $259,900 | $157 | 29 |
| 8291 Dawson Dr SE | 0.71mi | 3/2.0 | 1,296 (-14%) | 21mo | $240,000 | $185 | 21 |
Match score weights: distance 35% · size 25% · config 20% · recency 20%. Top-matched comps best support the ARV.
Projected returns pro-forma
-3.0% appreciation · 3.0% rent growth · sell at horizon
- IRR
- 10.0%
- Equity multiple
- 1.39×
- Total profit
- $12,120
- Equity at exit
- $16,401
- IRR
- 19.1%
- Equity multiple
- 2.60×
- Total profit
- $49,296
- Equity at exit
- $9,511
Cash invested: $30,800 (down + closing). Projections, not guarantees.
Landlord ↔ Tenant lean methodology
- Overall (STATE)
- 73 Landlord-Friendly
- State Ohio
- 73 Landlord-Friendly · R+6
- County
- — inherits STATE
- City
- — inherits STATE
ZIP-level market 44484
- Home prices YoY
- -17.5%
- Active inventory
- 90
- Price-to-rent
- 5.6×
Monthly cashflow live
- Estimated rent
- $1,642 medium interval (Pro) →
- Mortgage (P&I)
- −$577
- Tax from tax record
- −$205 /mo · $2,463/yr
- Insurance
- −$46
- HOA
- −$0
- Vacancy / Maint / Mgmt
- −$345
- Net cashflow
- $469
Break-even live
Sensitivity live
| Price | -10% $531 | -5% $500 | +0% $469 | +5% $438 | +10% $407 |
|---|---|---|---|---|---|
| Rent | -10% $339 | -5% $404 | +0% $469 | +5% $534 | +10% $599 |
| Rate | -1.0pp $525 | -0.5pp $497 | base $469 | +0.5pp $441 | +1.0pp $412 |
UW: 25.0% down · 7.5% · 30yr · 1.5% tax · 5.0% vac · 8.0% maint · 8.0% mgmt
Financing live
Cash to close
- Down payment
- $27,500
- Closing costs
- $3,300
- Reserves months
- —
- Total cash needed
- —
Loan-product check · same deal, 3 products live
Conventional
25% down · 7.5% · 30yr
- Down + closing
- —
- Monthly P&I
- —
- Monthly cashflow
- —
- DSCR
- —
- Eligible?
- —
Personal DTI + credit; lowest rate.
DSCR
20% down · 8.5% · 30yr
- Down + closing
- —
- Monthly P&I
- —
- Monthly cashflow
- —
- DSCR
- —
- Eligible?
- —
No personal income docs; deal must DSCR.
Hard money
10% down · 12.0% · 12mo
- Down + closing
- —
- Monthly P&I
- —
- Monthly cashflow
- —
- DSCR
- —
- Eligible?
- —
Short-term bridge; refi at stabilization.
Rent comps 2 comps
| Address | Beds | Baths | Sqft | Rent | $/sqft | DOM | Units | Dist |
|---|---|---|---|---|---|---|---|---|
| 218 Niles Cortland Rd SE Warren, OH | 4.0 | 2.0 | 1784 | $1,600 | $0.90 | 15d | 1 | 0.79mi |
| 10 Sandpiper Trl SE Warren, OH | 2.0–3.0 | 1.5–2.5 | 1150 | $1,710 | $1.49 | 15d | 6 | 1.15mi |
Listing history 13 events
-
2026-05-04status Pending
-
2026-04-20price $110,000
-
2026-04-09status Active
-
2026-02-24status Pending
-
2026-02-24status Active
-
2026-02-12status Active
-
2026-01-14status Active
-
2025-11-10status Pending
-
2025-11-10status Active
-
2025-10-22$140,000 Active
-
2024-03-29soldstatus $138,840
-
2020-04-06soldstatus $121,000
-
1989-02-13soldstatus $15,000
ⓘ Source: listings_history table (triggers on properties + properties_extension) + one-shot
backfill from property_details.listing_events for pre-trigger history.
Tax reassessment forecast OH · Partial reset (capped growth)
- Current annual tax
- $2,463 · $205/mo
- Projected year-2 tax
- $2,463 · $205/mo
- Expected delta
- $0/yr ($0/mo · 0.0%)
ⓘ Screening estimate from a state-policy table — verify with the county assessor before closing.
Climate risk First Street
- Flood 1/10 Low FEMA zone X (unshaded) · 0% chance over 30 yrs
- Wildfire 1/10 Low
- Heat 2/10 Low 6 d/yr ≥97°F today · 15 d/yr by 30 yrs out
- Wind 1/10 Low
- Air quality 3/10 Moderate 1 unhealthy d/yr today · 4 by 30 yrs out
Nearby sold comps map
Loading sold comps map…
Walkable amenities ~0.75 mi
Loading nearby amenities…
Taxation est. · year 1
- Rental income
- $19,702
- − Mortgage interest
- −$6,162
- − Property taxes
- −$2,463
- − Insurance
- −$550
- − Repairs & maintenance
- −$1,576
- − Management
- −$1,576
- − Depreciation
- −$3,200
- Taxable income
- $4,175
- Est. tax owed @ 24.0%
- −$1,002
- After-tax cash flow
- $4,627/yr
For passive investors: Depreciation is non-cash, so a rental often shows a tax loss while cash-flowing — sheltering income. Rental losses are passive: they offset passive income freely, and up to $25,000/yr can offset ordinary (W-2) income if you actively participate and your MAGI is under $100k (phasing out to $0 by $150k); unused losses carry forward. On sale, claimed depreciation is recaptured at up to 25%, and gains may owe capital-gains tax (a 1031 exchange can defer both). Figures are a year-1 estimate at your 24.0% rate — not tax advice; consult a CPA.
Schools (NCES district)
- District
- Howland Local
- NCES district ID
- 3905016
- Math proficiency
- 59% ▼ -17.00%
- Reading proficiency
- 65% ▼ -13.00%
- Median HH income
- $49,022
- Composite
- 52.63/100
- National rank
- #1556
- State rank
- #260 of 656 in OH
Livability — Howland Center
- Score
- 76/100
- State rank
- #207
- US rank
- #3283
Category grades
Schools grade is shown separately in the Schools card above.
Census & demographics
- Census place
- Howland Center, OH
- County
- Trumbull · 193,293 people
- City population
- 21,634
- Metro
- Youngstown-Warren, OH
- Population (ZIP)
- 21,634
- Household income
- $65,435
- Rent vs Own
- Severe rent burden
- 6.7
Population outlook (Trumbull County) Hauer SSP2
- Today (2025)
- 191,696 people
- By 2030
- 184,015 · -4.0%
- By 2040
- 166,810 · -13.0%
- By 2050
- 149,857 · -21.8%
- By 2075
- 115,769 · -39.6%
- By 2100
- 83,617 · -56.4%
Race, ethnicity, and origin ACS 2023
- Neighborhood character
- Predominantly White (84%)
- Race & ethnicity
- White 84% Black 8% Two or more races 5% Hispanic / Latino 3% Asian 2%
- Common ancestry
- Romanian 3% Lithuanian 2% Serbian 1%
- Foreign-born
- 3% · China, Canada
- Languages at home
- 96% English-only · Other Indo-European 2% Other Asian/Pacific 1% Spanish 1%
Political lean MEDSL · Trumbull
- 2024 margin
- R (+16.8) · D 41.2% · R 58.0%
- 2008→2024 swing
- -39.2pp toward R · 2008: 22.4pp · 2024: -16.8pp
- All cycles
- 2024: R+16.8 2020: R+10.6 2016: R+6.4 2012: D+22.2 2008: D+22.4
Not yet ingested
- Civics
- —
Market trends
- HPI YoY
- ▼ -46.24%
- Current HPI
- 217.6603
- Rent YoY
- —
- Metro
- —
- State GDP YoY
- ▲ 1.98%
- F500 in state
- 48
Industry mix (Fortune 500 HQ in OH)
| Industry | F500 HQs | Revenue |
|---|---|---|
| Insurance | 3 | $145B |
|
||
| Industrial Machinery | 3 | $49B |
|
||
| Financial Services | 3 | $24B |
|
||
| Consumer Goods | 2 | $93B |
|
||
| Aerospace / Defense | 2 | $47B |
|
||
| Utilities | 2 | $33B |
|
||
Price history
+633.3% since first listed13 events — show timeline
- 2026-05-04 Pending — MLSNOW
- 2026-04-20 Price Changed $110,000 MLSNOW
- 2026-04-09 Relisted — MLSNOW
- 2026-02-24 Pending — MLSNOW
- 2026-02-24 Relisted — MLSNOW
- 2026-02-12 Relisted — MLSNOW
- 2026-01-14 Relisted — MLSNOW
- 2025-11-10 Pending — MLSNOW
- 2025-11-10 Relisted — MLSNOW
- 2025-10-22 Listed $140,000 MLSNOW
- 2024-03-29 Sold (Public Records) $138,840 Public Records
- 2020-04-06 Sold (Public Records) $121,000 Public Records
- 1989-02-13 Sold (Public Records) $15,000 Public Records
Property tax history
+4.6%/yrLatest (2025): $2,463 · +0.6% YoY. Source: county tax records.
Cash-flow waterfall
monthlySold comps — $/sqft
last 12 mo · ≤1 miLoading sold comps…