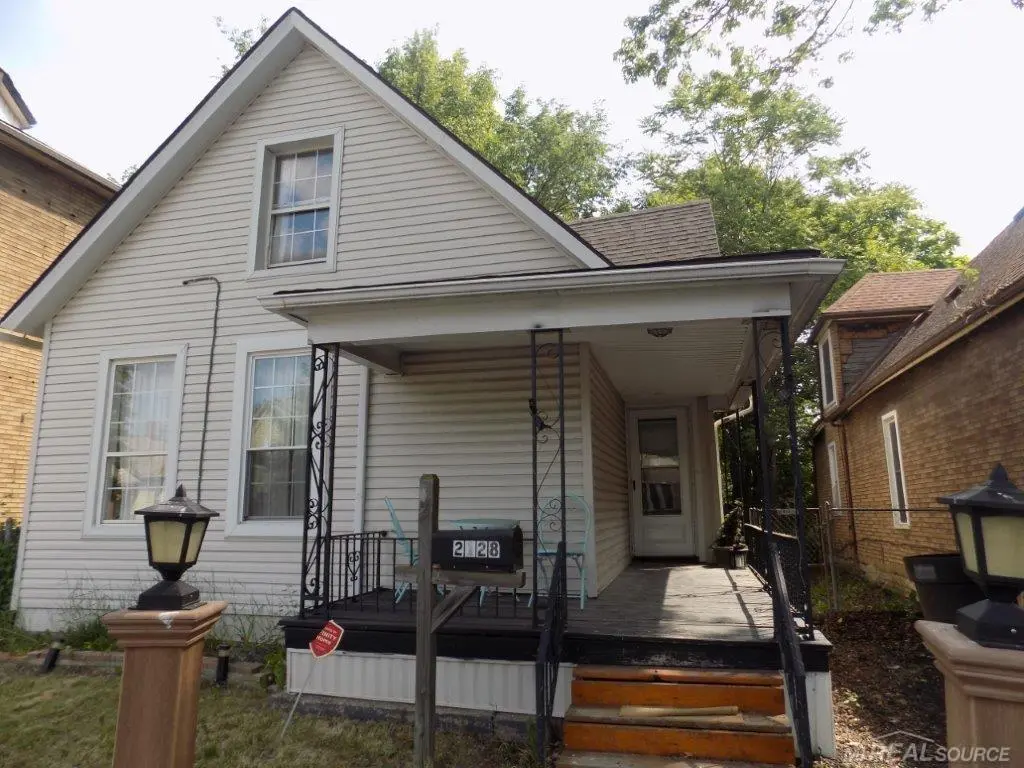
2128 Scotten St · Detroit, MI
Flood risk 1/10 · Minimal
- FEMA flood zone
- X (unshaded)
- Chance of flooding over 30 yrs
- 0.0%
- Est. flood insurance / yr
- $473 – $860
Fire risk 1/10 · Minimal
- Est. fire insurance / yr
- $784 – $1,456
Heat risk 3/10 · Minor
- Hot days now (above 97°F)
- 7 days/yr
- Hot days in 30 yrs
- 15 days/yr
Wind risk 2/10 · Minimal
- Chance of severe wind over 30 yrs
- —
Air-quality risk 4/10 · Minor
- Unhealthy air days now
- 6 days/yr
- Unhealthy air days in 30 yrs
- 8 days/yr
Risk factors via First Street. Map © Google.
Why this score? — see what drove the A- grade
The composite is a weighted blend of 9 inputs, each scored 0–100. Each bar is that input's sub-score; the figure is the points it added to the 100-point composite (weight × sub-score).
- Cash flow +30.0/30.0
- ARV discount +12.8/15.0
- DSCR +10.0/10.0
- Appreciation +10.0/10.0
- 1% rule +9.5/10.0
- Livability +3.7/5.0
- Rent growth +2.5/5.0
- Condition / age +2.5/5.0
- Schools +1.3/10.0
$149,900
🖨 Deal sheet 📄 Offer letter ✓ Due diligence
Listing remarks MLS
Charming historic Home with a bedroom on first floor and two bedrooms in the upstairs. Living and family room. Newer kitchen with eating space. Washer and dryer on first floor. New windows and portable AC units. Crawl space and shed for storage. Forced Air Furnace. Shows very nice. Fenced yard. Near I94 and located in Mexican village.
Key facts
- Shed for storage
- Newer kitchen
- Fenced yard
Tags
Property features AI
Finance
- Other: Lot approximately 0.09 acres (34 x 109)
Exterior
- Parking: No garage
- Security: Smoke detectors; Carbon monoxide detectors
- Utilities: Public water; Public sewer; Electric service with circuit breakers
- Home design: Single-family residence; One and one-half stories; Ground-level entry; Vinyl siding
- Construction: Block foundation; Built with vinyl siding
- Exterior features: Fenced backyard; Shed; Asphalt roof; Paved road access
Interior
- Kitchen: Oven; Self-cleaning oven; Free-standing gas oven; Free-standing gas range; Dishwasher; Disposal; Microwave; Free-standing refrigerator; Stainless steel appliances
- Bedrooms: 3 total rooms (includes bedrooms and living areas)
- Bathrooms: 1 full bathroom
- Heating & cooling: Forced air heating (natural gas); Window air conditioning units
- Interior features: Partially furnished; Unfinished basement; Porch
- Laundry & utility: Washer; Dryer; Gas water heater
Neighborhood map
What this means for you Summary
Snapshot
- This is a 3-bed/1.5-bath single-family listed at $150k.
Deal economics
- At list price, monthly cash flow is $746 ($9k/yr) — positive.
- The deal already cash-flows at list — no discount required.
- Meets the 1% rule at list price ($2k rent vs $150k).
- Recommended offer: $145k (3.0% below list) — sets the bar for market timing.
- Cap rate 12.3% vs local median 10.2% in Detroit — meaningfully above typical; check what's discounted (condition, days-on-market, listing class) to confirm the premium yield is real.
Location & tenants
- Location reads 73/100 on livability (#218 in MI) — a middle-class / working-renter tenant base. Strengths: amenities A+, commute A+, cost of living A+; Watch: schools F, crime F, employment F.
- Detroit Public Schools Community District (urban): math 10% / reading 24% proficiency, ranked #499 of 540 in MI (top 92%) — low school quality limits family demand, transient renter base, plan for 1-2y turnover; 90% free/reduced lunch — lower-income household profile, screen leases tightly.
- Market conditions: 66 active listings in the ZIP; 9 comparable units currently listed for rent nearby; rentals at typical pace (median 17d on market — plan ~3-4 weeks tenant-placement turnaround); lower-income renter base — watch delinquency; 2,639 units permitted in Wayne County in 2024 (1,216 in 5+ unit buildings).
- At $2,166/mo this rent would consume 60% of the median local household income ($43k/yr) (locally 831% of renters already pay >50% of income on rent) — very limited rent-growth headroom before tenants either downsize or default.
Forward outlook
- In year one you build about $16k of equity ($1k loan paydown + $15k appreciation (10.0% local appreciation)).
- Wayne County population projected at -17% by 2050 — secular population decline; favor cash flow + early exit over multi-decade hold.
- At projected returns (10.0% appreciation + 3.0% rent growth), your $42k cash investment doubles in ~2 years — after that, you're playing with house money.
- By year 3, paydown + projected appreciation supports a ~$41k cash-out refi (75% LTV) — recoverable capital for the next deal without selling this one.
Negotiation context
- It's been on market 48 days — a 3% lower offer ($145k) is reasonable based on typical stale-listing flexibility.
- 9 sale attempts since 8y ago; this cycle's ask has dropped $10k (6%) from the opening price — seller is motivated, your offer sets the floor, not the list.
- Current owner paid $95k; list at $150k implies a 58% gain — meaningful room to come down on a strong offer.
Risks & watch-outs
- Watch-outs: built in 1904 — expect roof / HVAC / electrical / plumbing capex.
Questions for the listing agent
- It's been on market 48 days. Have you received any prior offers? Is the seller open to a 3% concession, seller financing, or rate buy-down credit?
- Built in 1904 — when were the roof, HVAC, electrical panel, plumbing, and water heater last replaced?
- Is there a deadline driving the sale (1031 exchange, divorce, estate, relocation)? That informs how much negotiation room exists.
- Schools are F-rated, which usually means shorter tenancies and higher turnover. Who's the typical renter profile here, and what's been the actual vacancy rate?
- Crime grade is F in this area — have there been break-ins, vandalism, or insurance claims at this property in the last 3 years? What carrier currently insures it and at what premium?
- What's the average days-on-market for RENTAL listings here right now (not sales)? A rising rental-DOM trend means longer vacancies and softer asking-rent achievability than the comps imply.
- What's the recent tenant-quality profile in this submarket — average credit score on applications, eviction rate, late-payment / NSF rate, and stable-employment percentage? A property-management company in the area should have these aggregated.
- How much new for-sale + rental construction is in the pipeline within 1–3 miles? Heavy new supply typically softens prices + rents 12–24 months out; constrained supply supports both.
Investment metrics
- 1% rule
- 1.45% ✓
- Cap rate
- 12.26%
- Cash-on-cash
- 21.32%
- DSCR
- 1.95
- GRM
- 5.8
CMA / ARV
- ARV (median comp)
- $169,755
- List price
- $149,900
- Delta
- -11.70%
- Verdict
- UNDERPRICED
- Comps
- 20 within 1.0 mi
Show comp detail 12 sales within ~0.75 mi
| Address | Dist | Beds/Ba | Sqft | Sold | Price | $/sf | Match |
|---|---|---|---|---|---|---|---|
| 2118 Vinewood St | 0.21mi | 3/1.0 | 1,557 (+2%) | 10mo | $155,000 | $100 | 77 |
| 2153 Hubbard St | 0.10mi | 4/2.0 (+1) | 1,650 (+8%) | 3mo | $127,500 | $77 | 73 |
| 2048 Clarkdale St | 0.06mi | 4/2.5 (+1) | 1,664 (+9%) | 2mo | $261,000 | $157 | 72 |
| 1980 Morrell St | 0.40mi | 4/1.5 (+1) | 1,500 (-2%) | 6mo | $225,000 | $150 | 68 |
| 1538 Junction St | 0.55mi | 3/1.0 | 1,600 (+4%) | 3mo | $93,000 | $58 | 62 |
| 2158 Lansing St | 0.26mi | 4/1.0 (+1) | 1,400 (-9%) | 8mo | $84,000 | $60 | 60 |
| 712 W Grand Blvd | 0.39mi | 3/1.0 | 1,378 (-10%) | 13mo | $159,000 | $115 | 52 |
| 1257 25th St | 0.58mi | 3/1.5 | 1,690 (+10%) | 7mo | $170,000 | $101 | 50 |
| 3248 Lockwood St | 0.73mi | 3/1.5 | 1,682 (+10%) | 2mo | $90,000 | $54 | 48 |
| 3066 23rd St | 0.73mi | 4/2.0 (+1) | 1,570 (+2%) | 12mo | $100,000 | $64 | 44 |
| 3024 25th St | 0.68mi | 2/1.5 (-1) | 1,440 (-6%) | 12mo | $228,500 | $159 | 44 |
| 5647 Merritt St | 0.58mi | 4/3.0 (+1) | 1,363 (-11%) | 2mo | $80,000 | $59 | 42 |
Match score weights: distance 35% · size 25% · config 20% · recency 20%. Top-matched comps best support the ARV.
Projected returns pro-forma
10.0% appreciation · 3.0% rent growth · sell at horizon
- IRR
- 40.2%
- Equity multiple
- 4.08×
- Total profit
- $129,112
- Equity at exit
- $135,042
- IRR
- 34.7%
- Equity multiple
- 9.17×
- Total profit
- $342,854
- Equity at exit
- $291,223
Cash invested: $41,972 (down + closing). Projections, not guarantees.
Landlord ↔ Tenant lean methodology
- Overall (STATE)
- 62 Landlord-Friendly
- State Michigan
- 62 Landlord-Friendly · EVEN
- County
- — inherits STATE
- City
- — inherits STATE
ZIP-level market 48209
- Home prices YoY
- 21.8%
- Active inventory
- 66
- Price-to-rent
- 5.8×
Monthly cashflow live
- Estimated rent
- $2,166 high interval (Pro) →
- Mortgage (P&I)
- −$786
- Tax from tax record
- −$117 /mo · $1,408/yr
- Insurance
- −$62
- HOA
- −$0
- Vacancy / Maint / Mgmt
- −$455
- Net cashflow
- $746
Break-even live
UW: 25.0% down · 7.5% · 30yr · 1.5% tax · 5.0% vac · 8.0% maint · 8.0% mgmt
Financing live
Cash to close
- Down payment
- $37,475
- Closing costs
- $4,497
- Reserves months
- —
- Total cash needed
- —
Loan-product check · same deal, 3 products live
Conventional
25% down · 7.5% · 30yr
- Down + closing
- —
- Monthly P&I
- —
- Monthly cashflow
- —
- DSCR
- —
- Eligible?
- —
Personal DTI + credit; lowest rate.
DSCR
20% down · 8.5% · 30yr
- Down + closing
- —
- Monthly P&I
- —
- Monthly cashflow
- —
- DSCR
- —
- Eligible?
- —
No personal income docs; deal must DSCR.
Hard money
10% down · 12.0% · 12mo
- Down + closing
- —
- Monthly P&I
- —
- Monthly cashflow
- —
- DSCR
- —
- Eligible?
- —
Short-term bridge; refi at stabilization.
Rent comps 9 comps
| Address | Beds | Baths | Sqft | Rent | $/sqft | DOM | Units | Dist |
|---|---|---|---|---|---|---|---|---|
| 1646 Mc Kinstry St Unit 1F McKinstry Detroit, MI | 4.0 | 1.0 | 1879 | $1,200 | $0.64 | 5d | 1 | 0.27mi |
| 2835 23rd St Unit 2 Detroit, MI | 3.0 | 2.0 | 1100 | $1,450 | $1.32 | 17d | 1 | 0.65mi |
| 1434 Campbell St Detroit, MI | 3.0 | 1.0 | 1150 | $1,750 | $1.52 | 24d | 1 | 0.71mi |
| 2223 Wabash St Detroit, MI | 2.0 | 2.0 | 1300 | $2,800 | $2.15 | 12d | 1 | 1.16mi |
| 3309 14th St Detroit, MI | 1.0–3.0 | 1.0–2.5 | 942 | $2,230 | $2.37 | 2d | 11 | 1.26mi |
| 2732 Harrison St Detroit, MI | 2.0 | 2.5 | 1320 | $2,750 | $2.08 | 44d | 1 | 1.45mi |
| 1611 Michigan Ave Detroit, MI | 1.0–2.0 | 1.0–2.5 | 1487 | $4,750 | $3.19 | 2d | 8 | 1.45mi |
| 1640 Bagley St #13 Detroit, MI | 2.0 | 2.5 | 1400 | $4,250 | $3.04 | 44d | 1 | 1.45mi |
| 3998 15th St Unit 1 Detroit, MI | 2.0 | 1.0 | 1200 | $1,300 | $1.08 | 44d | 1 | 1.50mi |
Listing history 35 events
-
2026-06-18days on market $149,900 Active 48 DOM
-
2026-06-17days on market $149,900 Active 47 DOM
-
2026-06-15days on market $149,900 Active 45 DOM
-
2026-06-13days on market $149,900 Active 43 DOM
-
2026-06-13pricedays on market $149,900 Active 42 DOM
-
2026-06-09days on market $159,900 Active 39 DOM
-
2026-06-08days on market $159,900 Active 38 DOM
-
2026-06-07days on market $159,900 Active 37 DOM
-
2026-06-04days on market $159,900 Active 34 DOM
-
2026-06-03days on market $159,900 Active 33 DOM
-
2026-06-02days on market $159,900 Active 32 DOM
-
2026-06-01days on market $159,900 Active 31 DOM
-
2026-05-31days on market $159,900 Active 30 DOM
-
2026-05-01historical
Show marketing remark (336 chars)
Charming historic Home with a bedroom on first floor and two bedrooms in the upstairs. Living and family room. Newer kitchen with eating space. Washer and dryer on first floor. New windows and portable AC units. Crawl space and shed for storage. Forced Air Furnace. Shows very nice. Fenced yard. Near I94 and located in Mexican village.
-
2026-05-01$159,900 Active 336-char remark
Show marketing remark (336 chars)
Charming historic Home with a bedroom on first floor and two bedrooms in the upstairs. Living and family room. Newer kitchen with eating space. Washer and dryer on first floor. New windows and portable AC units. Crawl space and shed for storage. Forced Air Furnace. Shows very nice. Fenced yard. Near I94 and located in Mexican village.
-
2026-05-01$159,900 Active
Show marketing remark (336 chars)
Charming historic Home with a bedroom on first floor and two bedrooms in the upstairs. Living and family room. Newer kitchen with eating space. Washer and dryer on first floor. New windows and portable AC units. Crawl space and shed for storage. Forced Air Furnace. Shows very nice. Fenced yard. Near I94 and located in Mexican village.
-
2026-05-01historical
Show marketing remark (336 chars)
Charming historic Home with a bedroom on first floor and two bedrooms in the upstairs. Living and family room. Newer kitchen with eating space. Washer and dryer on first floor. New windows and portable AC units. Crawl space and shed for storage. Forced Air Furnace. Shows very nice. Fenced yard. Near I94 and located in Mexican village.
-
2026-02-05historical
-
2025-12-07$169,900 Active
-
2025-12-07$169,900 Active
-
2025-12-07$169,900 Active
-
2025-12-03historical
-
2024-08-17historical $1,800
-
2024-05-17$1,800
-
2023-08-15historical $1,500
-
2023-08-13$1,500
-
2023-08-12historical $1,500
-
2023-07-27price $1,500
-
2018-11-30soldstatus $95,000
-
2018-11-01soldstatus $95,000 Sold
-
2018-11-01soldstatus $95,000 Closed
-
2018-09-17status Pending
-
2018-09-17status Pending
-
2018-09-13$89,900 Active
-
2018-09-13$89,900 Active
ⓘ Source: listings_history table (triggers on properties + properties_extension) + one-shot
backfill from property_details.listing_events for pre-trigger history.
Tax reassessment forecast MI · Partial reset (capped growth)
- Current annual tax
- $1,408 · $117/mo
- Projected year-2 tax
- $1,858 · $155/mo
- Expected delta
- +$450/yr (+$38/mo · 32.0%)
ⓘ Screening estimate from a state-policy table — verify with the county assessor before closing.
Climate risk First Street
- Flood 1/10 Low FEMA zone X (unshaded) · 0% chance over 30 yrs
- Wildfire 1/10 Low
- Heat 3/10 Moderate 7 d/yr ≥97°F today · 15 d/yr by 30 yrs out
- Wind 2/10 Low
- Air quality 4/10 Moderate 6 unhealthy d/yr today · 8 by 30 yrs out
Nearby sold comps map
Loading sold comps map…
Walkable amenities ~0.75 mi
Loading nearby amenities…
Taxation est. · year 1
- Rental income
- $25,996
- − Mortgage interest
- −$8,397
- − Property taxes
- −$1,408
- − Insurance
- −$750
- − Repairs & maintenance
- −$2,080
- − Management
- −$2,080
- − Depreciation
- −$4,361
- Taxable income
- $6,922
- Est. tax owed @ 24.0%
- −$1,661
- After-tax cash flow
- $7,285/yr
For passive investors: Depreciation is non-cash, so a rental often shows a tax loss while cash-flowing — sheltering income. Rental losses are passive: they offset passive income freely, and up to $25,000/yr can offset ordinary (W-2) income if you actively participate and your MAGI is under $100k (phasing out to $0 by $150k); unused losses carry forward. On sale, claimed depreciation is recaptured at up to 25%, and gains may owe capital-gains tax (a 1031 exchange can defer both). Figures are a year-1 estimate at your 24.0% rate — not tax advice; consult a CPA.
Schools (NCES district)
- District
- Detroit Public Schools Community District
- NCES district ID
- 2601103
- Math proficiency
- 10% ▼ -2.00%
- Reading proficiency
- 24% ▲ 6.00%
- Median HH income
- $25,815
- Composite
- 13.06/100
- National rank
- #9564
- State rank
- #499 of 540 in MI
Livability — Detroit
- Score
- 73/100
- State rank
- #218
- US rank
- #5427
Category grades
Schools grade is shown separately in the Schools card above.
Census & demographics
- Census place
- Detroit, MI
- County
- Wayne County · 1,562,939 people
- City population
- 572,865
- Metro
- Detroit-Warren-Dearborn, MI
- Population (ZIP)
- 27,184
- Household income
- $43,161
- Rent vs Own
- Severe rent burden
- 831.0
Population outlook (Wayne County) Hauer SSP2
- Today (2025)
- 1,675,273 people
- By 2030
- 1,620,300 · -3.3%
- By 2040
- 1,502,341 · -10.3%
- By 2050
- 1,384,039 · -17.4%
- By 2075
- 1,124,592 · -32.9%
- By 2100
- 881,193 · -47.4%
Race, ethnicity, and origin ACS 2023
- Neighborhood character
- Predominantly Hispanic (76%)
- Race & ethnicity
- Hispanic / Latino 76% White 17% Two or more races 14% Black 6% Native American 2%
- Hispanic origin (detail)
- Mexican 58% Puerto Rican 7% Cuban 1%
- Common ancestry
- Romanian 2% Lithuanian 0%
- Foreign-born
- 26% · Canada
- Languages at home
- 38% English-only · Spanish 62%
Political lean MEDSL · Wayne
- 2024 margin
- Strong D (+29.0) · D 62.7% · R 33.7% · Other 3.6%
- 2008→2024 swing
- -20.5pp toward R · 2008: 49.5pp · 2024: 29.0pp
- All cycles
- 2024: D+29.0 2020: D+38.1 2016: D+37.3 2012: D+46.9 2008: D+49.5
Not yet ingested
- Civics
- —
Market trends
- HPI YoY
- ▲ 73.77%
- Current HPI
- 412.9753
- Rent YoY
- —
- Metro
- Detroit-Warren-Dearborn, MI
- State GDP YoY
- ▲ 1.37%
- F500 in state
- 28
Industry mix (Fortune 500 HQ in MI)
| Industry | F500 HQs | Revenue |
|---|---|---|
| Automotive Parts | 3 | $48B |
|
||
| Automotive | 2 | $372B |
|
||
| Chemicals | 1 | $45B |
|
||
| Automotive Retail | 1 | $29B |
|
||
| Healthcare / Medical Devices | 1 | $23B |
|
||
| Automotive Technology | 1 | $20B |
|
||
Price history
+66.7% since first listed23 events — show timeline
- 2026-06-11 Price Changed $149,900 REALCOMP
- 2026-05-01 Listing Removed — REALCOMP
- 2026-05-01 Listed $159,900 MiRealSource-MiMLS
- 2026-05-01 Listing Removed — MiRealSource-MiMLS
- 2026-05-01 Listed $159,900 REALCOMP
- 2026-02-05 Listing Removed — REALCOMP
- 2025-12-07 Listed $169,900 REALCOMP
- 2025-12-07 Listed $169,900 MiRealSource-MiMLS
- 2025-12-07 Listed $169,900 REALCOMP
- 2025-12-03 Coming Soon — MiRealSource-MiMLS
- 2024-08-17 Rental Removed $1,800 REALSOURCE
- 2024-05-17 Listed for Rent $1,800 REALSOURCE
- 2023-08-15 Rental Removed $1,500 APPFOLIO
- 2023-08-13 Listed for Rent $1,500 APPFOLIO
- 2023-08-12 Rental Removed $1,500 REALSOURCE
- 2023-07-27 Price Changed $1,500 REALSOURCE
- 2018-11-30 Sold (Public Records) $95,000 Public Records
- 2018-11-01 Sold (MLS) $95,000 MiRealSource-MiMLS
- 2018-11-01 Sold (MLS) $95,000 REALCOMP
- 2018-09-17 Pending — MiRealSource-MiMLS
- 2018-09-17 Pending — REALCOMP
- 2018-09-13 Listed $89,900 MiRealSource-MiMLS
- 2018-09-13 Listed $89,900 REALCOMP
Property tax history
-1.7%/yrLatest (2025): $1,408 · +0.2% YoY. Source: county tax records.
Cash-flow waterfall
monthlySold comps — $/sqft
last 12 mo · ≤1 miLoading sold comps…