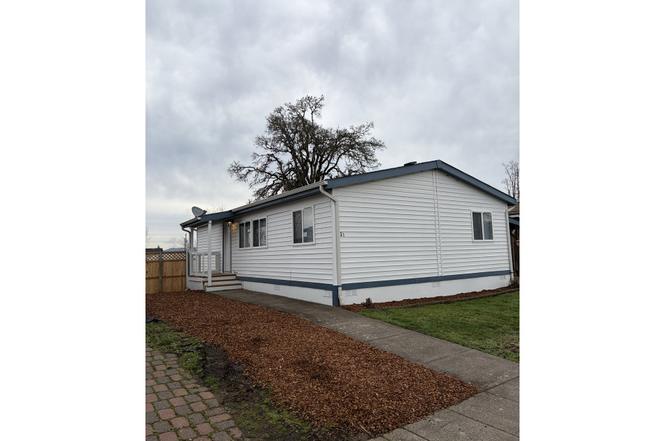
700 N Mill St #21 · Creswell, OR
Flood risk 1/10 · Minimal
- FEMA flood zone
- X (unshaded)
- Chance of flooding over 30 yrs
- 0.0%
- Est. flood insurance / yr
- $507 – $1,088
Fire risk 4/10 · Minor
- Est. fire insurance / yr
- $498 – $926
Heat risk 4/10 · Minor
- Hot days now (above 91°F)
- 7 days/yr
- Hot days in 30 yrs
- 15 days/yr
Wind risk 1/10 · Minimal
- Chance of severe wind over 30 yrs
- —
Air-quality risk 10/10 · Severe
- Unhealthy air days now
- 14 days/yr
- Unhealthy air days in 30 yrs
- 15 days/yr
Risk factors via First Street. Map © Google.
Why this score? — see what drove the C- grade
The composite is a weighted blend of 9 inputs, each scored 0–100. Each bar is that input's sub-score; the figure is the points it added to the 100-point composite (weight × sub-score).
- Cash flow +26.5/30.0
- DSCR +9.0/10.0
- 1% rule +6.2/10.0
- Schools +4.0/10.0
- Livability +3.8/5.0
- Rent growth +2.5/5.0
- Condition / age +2.5/5.0
- ARV discount +0.0/15.0
- Appreciation +0.0/10.0
$133,000
🖨 Deal sheet (PDF) 📄 Offer letter ✓ Due diligence
Listing remarks
This updated fully remodeled home provides natural light that highlights the new, modern, and beautiful features throughout. From new flooring, a tasteful COMPLETE KITCHEN & BATHROOM REMODELS, and new paint, you will not want to miss seeing this home! Creswell Court is a well-kept, all-ages park with a reasonable pet policy. This is one of the largest lots in the park and backs to farmland/what a view! The monthly space lease is $655. This home can be financed.
Key facts
- Backs to farmland
- Largest lots
- Garage
Tags
Property features AI
Finance
- Other: Lot rent paid monthly
- Financial info: Land lease (monthly lot rent of $655); Land lease expires February 28, 2027
- HOA & community: Park amenities include trash service; Located in Creswell Court park (park approval required prior to purchase)
Exterior
- Parking: Carport; Driveway (one parking space total)
- Utilities: Public water; Public sewer; Electric service
- Home design: Manufactured home in a park (Fleetwood model year 1996); Single-story (main level living); Seasonal views of trees/woods
- Construction: Composition roof; Concrete perimeter foundation; Built in 1996
- Exterior features: Fenced yard; Patio; Tool shed; Yard; Vinyl siding; Paved road access; Leased land with private road
Interior
- Kitchen: Dishwasher; Free-standing range; Free-standing refrigerator; Microwave; Stainless steel appliances
- Bedrooms: Primary bedroom on main level; Second bedroom on main level; Third bedroom on main level
- Flooring: Laminate flooring
- Bathrooms: Two full bathrooms (both on main level)
- Heating & cooling: Forced air heating; No central cooling
- Interior features: Updated/remodeled interior; Vaulted ceilings; Laundry area; Minimal steps (accessibility)
- Laundry & utility: Laundry on main level; Electric water heater; Utility room on main level
Neighborhood map
What this means for you Summary
Snapshot
- This is a 3-bed/2.0-bath manufactured listed at $133k.
Deal economics
- At list price, monthly cash flow is $350 ($4k/yr) — positive.
- The deal already cash-flows at list — no discount required.
- Meets the 1% rule at list price ($1k rent vs $133k).
- Recommended offer: $129k (3.0% below list) — sets the bar for market timing.
- Cap rate 9.4% vs local median 2.7% in Creswell — top-decile yield for the area; either an underpriced asset or a hidden risk that comps aren't pricing in. Stress-test before assuming the spread holds.
Location & tenants
- Location reads 76/100 on livability (#80 in OR, #3,631 nationally) — a middle-class / working-renter tenant base. Strengths: employment A+, housing A+, health & safety A+; Watch: amenities D+, commute F.
- Creswell SD 40 (town): math 37% / reading 51% proficiency, ranked #78 of 183 in OR (top 43%) — families likely to look elsewhere, expect single-tenant / working-renter base with shorter leases.
- Zoned schools: Creslane Elementary School (math 15% / reading 34%, grade F, #309 of 412 statewide, top 77%, 509 students, 68% FRL); Creswell Middle School (math 22% / reading 47%, grade F, #61 of 128 statewide, top 54%, 265 students, 43% FRL); Creswell High School (360 students, 37% FRL) — zoned schools at 49% FRL track the district average.
- Zoned-school proficiency averages 30% at this address vs 44% district-wide (-14 pts) — the specific schools serving this property underperform the Creswell SD 40 average; the district grade overstates school quality for this exact location.
- Market conditions: 67 active listings in the ZIP; 6 comparable units currently listed for rent nearby; rentals lingering (median 46d on market — plan ~5-8 weeks vacancy on turnover, expect pricing pressure); 50% of comp listings sitting > 30 days — soft ceiling on asking rent; 1,808 units permitted in Lane County in 2024 (972 in 5+ unit buildings).
Forward outlook
- Local home prices are declining (-3.0%/yr); year-one equity from $920 of loan paydown is wiped out by about $4k of value loss. Plan a longer hold.
- Lane County population projected at +15% by 2050 — long-run rental-demand tailwind backs the buy-and-hold thesis.
- At projected returns (-3.0% appreciation + 3.0% rent growth), your $37k cash investment doubles in ~10 years — after that, you're playing with house money.
Negotiation context
- It's been on market 58 days — a 3% lower offer ($129k) is reasonable based on typical stale-listing flexibility.
Questions for the listing agent
- It's been on market 58 days. Have you received any prior offers? Is the seller open to a 3% concession, seller financing, or rate buy-down credit?
- Is there a deadline driving the sale (1031 exchange, divorce, estate, relocation)? That informs how much negotiation room exists.
- What's the average days-on-market for RENTAL listings here right now (not sales)? A rising rental-DOM trend means longer vacancies and softer asking-rent achievability than the comps imply.
- What's the recent tenant-quality profile in this submarket — average credit score on applications, eviction rate, late-payment / NSF rate, and stable-employment percentage? A property-management company in the area should have these aggregated.
- How much new for-sale + rental construction is in the pipeline within 1–3 miles? Heavy new supply typically softens prices + rents 12–24 months out; constrained supply supports both.
Investment metrics
- 1% rule
- 1.12% ✓
- Cap rate
- 9.45%
- Cash-on-cash
- 11.27%
- DSCR
- 1.50
- GRM
- 7.5
CMA / ARV
- ARV (on-the-fly)
- $95,000
- Comps found
- 5
Show comp detail 5 sales within ~0.75 mi
| Address | Dist | Beds/Ba | Sqft | Sold | Price | $/sf | Match |
|---|---|---|---|---|---|---|---|
| 700 N Mill St #21 | 0.00mi | 3/2.0 | 1,000 (0%) | 1mo | $126,500 | $127 | 99 |
| 700 N Mill St #56 | 0.00mi | 3/2.0 | 950 (-5%) | 7mo | $90,000 | $95 | 86 |
| 700 N Mill St #75 | 0.00mi | 3/2.0 | 1,080 (+8%) | 9mo | $107,000 | $99 | 79 |
| 400 N Mill St #1 | 0.18mi | 3/2.0 | 962 (-4%) | 8mo | $17,800 | $19 | 79 |
| 400 N Mill St | 0.18mi | 2/2.0 (-1) | 1,008 (+1%) | 22mo | $35,000 | $35 | 67 |
Match score weights: distance 35% · size 25% · config 20% · recency 20%. Top-matched comps best support the ARV.
Projected returns pro-forma
-3.0% appreciation · 3.0% rent growth · sell at horizon
- IRR
- 0.5%
- Equity multiple
- 1.02×
- Total profit
- $690
- Equity at exit
- $19,831
- IRR
- 10.1%
- Equity multiple
- 1.78×
- Total profit
- $29,140
- Equity at exit
- $11,499
Cash invested: $37,240 (down + closing). Projections, not guarantees.
Landlord ↔ Tenant lean methodology
- Overall (STATE)
- 28 Tenant-Leaning
- State Oregon
- 28 Tenant-Leaning · D+6
- County
- — inherits STATE
- City
- — inherits STATE
ZIP-level market 97426
- Home prices YoY
- -29.1%
- Active inventory
- 67
- Price-to-rent
- 7.5×
Monthly cashflow live
- Estimated rent
- $1,485 high interval (Pro) →
- Mortgage (P&I)
- −$697
- Tax from tax record
- −$70 /mo · $846/yr
- Insurance
- −$55
- HOA
- −$0
- Vacancy / Maint / Mgmt
- −$312
- Net cashflow
- $350
Break-even live
Sensitivity live
| Price | -10% $425 | -5% $387 | +0% $350 | +5% $312 | +10% $275 |
|---|---|---|---|---|---|
| Rent | -10% $232 | -5% $291 | +0% $350 | +5% $408 | +10% $467 |
| Rate | -1.0pp $417 | -0.5pp $384 | base $350 | +0.5pp $315 | +1.0pp $280 |
UW: 25.0% down · 7.5% · 30yr · 1.5% tax · 5.0% vac · 8.0% maint · 8.0% mgmt
Financing live
Cash to close
- Down payment
- $33,250
- Closing costs
- $3,990
- Reserves months
- —
- Total cash needed
- —
Loan-product check · same deal, 3 products live
Conventional
25% down · 7.5% · 30yr
- Down + closing
- —
- Monthly P&I
- —
- Monthly cashflow
- —
- DSCR
- —
- Eligible?
- —
Personal DTI + credit; lowest rate.
DSCR
20% down · 8.5% · 30yr
- Down + closing
- —
- Monthly P&I
- —
- Monthly cashflow
- —
- DSCR
- —
- Eligible?
- —
No personal income docs; deal must DSCR.
Hard money
10% down · 12.0% · 12mo
- Down + closing
- —
- Monthly P&I
- —
- Monthly cashflow
- —
- DSCR
- —
- Eligible?
- —
Short-term bridge; refi at stabilization.
Rent comps 6 comps
| Address | Beds | Baths | Sqft | Rent | $/sqft | DOM | Units | Dist |
|---|---|---|---|---|---|---|---|---|
| 101 D St Creswell, OR | 3.0 | 1.0 | 1278 | $2,095 | $1.64 | 15d | 1 | 0.64mi |
| 92 N 8th St Unit 97 Creswell, OR | 2.0 | 1.0 | 988 | $1,295 | $1.31 | 45d | 1 | 0.78mi |
| 101 N 10th St Apt 4 Creswell, OR | 2.0 | 1.0 | 950 | $1,295 | $1.36 | 45d | 1 | 0.87mi |
| 101 N 10th St Unit 15 Creswell, OR | 2.0 | 1.0 | 770 | $1,350 | $1.75 | 23d | 1 | 0.90mi |
| 703 Kings Row Creswell, OR | 2.0 | 1.0 | 936 | $1,395 | $1.49 | 45d | 1 | 0.92mi |
| 703 Kings Row Creswell, OR | 2.0 | 1.0 | 936 | $1,395 | $1.49 | 15d | 1 | 0.92mi |
Listing history 3 events
-
2026-04-27status Pending
-
2026-04-07price $133,000
-
2026-02-28$135,000 Active
ⓘ Source: listings_history table (triggers on properties + properties_extension) + one-shot
backfill from property_details.listing_events for pre-trigger history.
Tax reassessment forecast OR · Resets to sale price
- Current annual tax
- $846 · $70/mo
- Projected year-2 tax
- $1,290 · $108/mo
- Expected delta
- +$444/yr (+$37/mo · 52.5%)
ⓘ Screening estimate from a state-policy table — verify with the county assessor before closing.
Climate risk First Street
- Flood 1/10 Low FEMA zone X (unshaded) · 0% chance over 30 yrs
- Wildfire 4/10 Moderate
- Heat 4/10 Moderate 7 d/yr ≥91°F today · 15 d/yr by 30 yrs out
- Wind 1/10 Low
- Air quality 10/10 Extreme 14 unhealthy d/yr today · 15 by 30 yrs out
Nearby sold comps map
Loading sold comps map…
Walkable amenities ~0.75 mi
Loading nearby amenities…
Taxation est. · year 1
- Rental income
- $17,820
- − Mortgage interest
- −$7,450
- − Property taxes
- −$846
- − Insurance
- −$665
- − Repairs & maintenance
- −$1,426
- − Management
- −$1,426
- − Depreciation
- −$3,869
- Taxable income
- $2,139
- Est. tax owed @ 24.0%
- −$513
- After-tax cash flow
- $3,684/yr
For passive investors: Depreciation is non-cash, so a rental often shows a tax loss while cash-flowing — sheltering income. Rental losses are passive: they offset passive income freely, and up to $25,000/yr can offset ordinary (W-2) income if you actively participate and your MAGI is under $100k (phasing out to $0 by $150k); unused losses carry forward. On sale, claimed depreciation is recaptured at up to 25%, and gains may owe capital-gains tax (a 1031 exchange can defer both). Figures are a year-1 estimate at your 24.0% rate — not tax advice; consult a CPA.
Schools (NCES district)
- District
- Creswell SD 40
- NCES district ID
- 4103690
- Math proficiency
- 37% ▼ -6.00%
- Reading proficiency
- 51% ▼ -5.00%
- Median HH income
- $53,499
- Composite
- 40.38/100
- National rank
- #7748
- State rank
- #78 of 183 in OR
Livability — Creswell
- Score
- 76/100
- State rank
- #80
- US rank
- #3631
Category grades
Schools grade is shown separately in the Schools card above.
Census & demographics
- Census place
- Creswell, OR
- Population (ZIP)
- 10,384
Population outlook (Lane County) Hauer SSP2
- Today (2025)
- 391,933 people
- By 2030
- 405,860 · +3.6%
- By 2040
- 429,386 · +9.6%
- By 2050
- 452,016 · +15.3%
- By 2075
- 508,825 · +29.8%
- By 2100
- 531,208 · +35.5%
Race, ethnicity, and origin ACS 2023
- Neighborhood character
- Predominantly White (88%)
- Race & ethnicity
- White 88% Two or more races 8% Hispanic / Latino 3% Asian 1% Native American 1%
- Common ancestry
- Italian 6% Portuguese 3% Lithuanian 3%
- Foreign-born
- 1% · Canada
- Languages at home
- 97% English-only · Spanish 2%
Political lean MEDSL · Lane
- 2024 margin
- Strong D (+23.1) · D 60.0% · R 36.9% · Other 3.1%
- 2008→2024 swing
- -4.3pp toward R · 2008: 27.4pp · 2024: 23.1pp
- All cycles
- 2024: D+23.1 2020: D+24.3 2016: D+18.9 2012: D+23.4 2008: D+27.4
Not yet ingested
- Civics
- —
Market trends
- HPI YoY
- ▼ -127.51%
- Current HPI
- 311.4445
- Rent YoY
- —
- Metro
- —
- State GDP YoY
- ▲ 2.05%
- F500 in state
- 2
Industry mix (Fortune 500 HQ in OR)
| Industry | F500 HQs | Revenue |
|---|---|---|
| Consumer Goods | 1 | $51B |
|
||
Price history
-1.5% since first listed3 events — show timeline
- 2026-04-27 Pending — RMLS
- 2026-04-07 Price Changed $133,000 RMLS
- 2026-02-28 Listed $135,000 RMLS
Property tax history
+6.2%/yrLatest (2025): $846 · +33.2% YoY. Source: county tax records.
Cash-flow waterfall
monthlySold comps — $/sqft
last 12 mo · ≤1 miLoading sold comps…