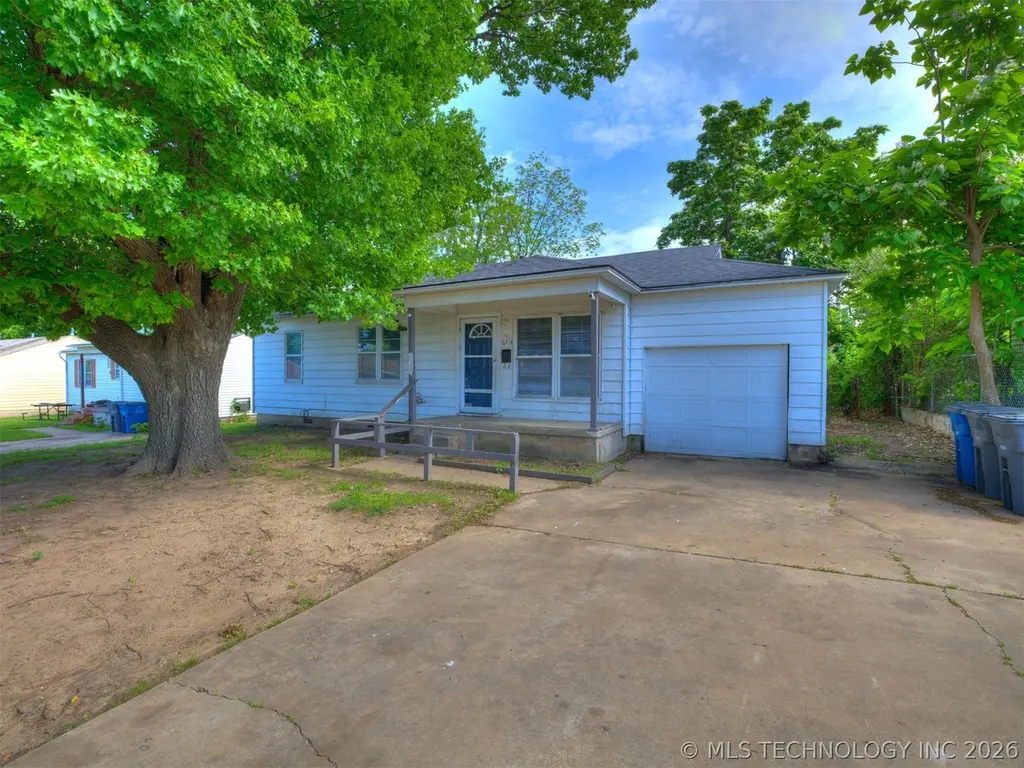
6714 E Jasper St · Tulsa, OK
Flood risk 1/10 · Minimal
- FEMA flood zone
- X (unshaded)
- Chance of flooding over 30 yrs
- 0.0%
- Est. flood insurance / yr
- $507 – $1,088
Fire risk 3/10 · Minor
- Est. fire insurance / yr
- $2,463 – $4,575
Heat risk 6/10 · Moderate
- Hot days now (above 110°F)
- 7 days/yr
- Hot days in 30 yrs
- 18 days/yr
Wind risk 2/10 · Minimal
- Chance of severe wind over 30 yrs
- 3.0%
Air-quality risk 3/10 · Minor
- Unhealthy air days now
- 2 days/yr
- Unhealthy air days in 30 yrs
- 3 days/yr
Risk factors via First Street. Map © Google.
Why this score? — see what drove the C+ grade
The composite is a weighted blend of 9 inputs, each scored 0–100. Each bar is that input's sub-score; the figure is the points it added to the 100-point composite (weight × sub-score).
- Cash flow +22.3/30.0
- ARV discount +15.0/15.0
- DSCR +7.1/10.0
- 1% rule +5.1/10.0
- Livability +3.8/5.0
- Rent growth +3.6/5.0
- Condition / age +2.5/5.0
- Schools +0.8/10.0
- Appreciation +0.0/10.0
$139,900
🖨 Deal sheet 📄 Offer letter ✓ Due diligence
Listing remarks
Charming move-in ready home in an excellent location! This 3-bedroom, 1-bath property features beautiful hardwood floors and includes a refrigerator, stove, and dishwasher. Roof replaced approximately 4 years ago. Conveniently located near shopping, restaurants, the airport, downtown Tulsa, Midtown, the University of Tulsa, and easy access to major highways. Don’t miss this great opportunity
Key facts
- 7,006 sq ft lot
- Garage
- Built 1952
Property features AI
Exterior
- Parking: Attached garage (1 car)
- Security: Smoke detector(s); No safety shelter
- Utilities: Electricity available; Natural gas available; Public water; Public sewer
- Home design: Single-story; Faces east; Crawlspace foundation
- Construction: Vinyl siding; Shingle and wood roof
- Exterior features: Chain-link fencing; Shed(s)
Interior
- Kitchen: Dishwasher; Oven; Range; Refrigerator
- Flooring: Carpet; Wood
- Bathrooms: 1 full bathroom
- Heating & cooling: Central heating (gas); Central air conditioning
- Interior features: Aluminum-framed windows; Laminate countertops; Other interior finishes
- Laundry & utility: Gas water heater
Neighborhood map
What this means for you Summary
Snapshot
- This is a 3-bed/1.0-bath single-family listed at $140k.
Deal economics
- At list price, monthly cash flow is $231 ($3k/yr) — positive.
- The deal already cash-flows at list — no discount required.
- Meets the 1% rule at list price ($1k rent vs $140k).
- Recommended offer: $136k (3.0% below list) — sets the bar for market timing.
- Cap rate 8.3% vs local median 3.9% in Tulsa — top-decile yield for the area; either an underpriced asset or a hidden risk that comps aren't pricing in. Stress-test before assuming the spread holds.
Location & tenants
- Location reads 75/100 on livability (#13 in OK, #4,058 nationally) — a middle-class / working-renter tenant base. Strengths: amenities A+, commute A+, cost of living A+; Watch: schools F, crime F, employment D-.
- Tulsa (urban): math 7% / reading 12% proficiency, ranked #250 of 270 in OK (top 93%) — low school quality limits family demand, transient renter base, plan for 1-2y turnover; 76% free/reduced lunch — lower-income household profile, screen leases tightly.
- Market conditions: Rents rising fast (+4.6%/yr); 86 active listings in the ZIP; 4 comparable units currently listed for rent nearby; rentals at typical pace (median 24d on market — plan ~3-4 weeks tenant-placement turnaround); lower-income renter base — watch delinquency; 2,818 units permitted in Tulsa County in 2024 (518 in 5+ unit buildings).
- This rent runs 38% of the median local income ($45k/yr) — at the standard rent-burdened threshold; future hikes will face affordability resistance.
Forward outlook
- Local home prices are declining (-3.0%/yr); year-one equity from $967 of loan paydown is wiped out by about $4k of value loss. Plan a longer hold.
- Tulsa County population projected at +30% by 2050 — long-run rental-demand tailwind backs the buy-and-hold thesis.
Negotiation context
- It's been on market 41 days — a 3% lower offer ($136k) is reasonable based on typical stale-listing flexibility.
- Current owner paid $21k; list at $140k implies a 566% gain — meaningful room to come down on a strong offer.
Risks & watch-outs
- Watch-outs: built in 1952 — expect roof / HVAC / electrical / plumbing capex.
- Climate carrying-cost: extreme-heat days projected 7→18/yr by 2055 (HVAC capex compounding) — expect insurance premiums to compound above CPI over the hold.
Questions for the listing agent
- It's been on market 41 days. Have you received any prior offers? Is the seller open to a 3% concession, seller financing, or rate buy-down credit?
- Built in 1952 — when were the roof, HVAC, electrical panel, plumbing, and water heater last replaced?
- Is there a deadline driving the sale (1031 exchange, divorce, estate, relocation)? That informs how much negotiation room exists.
- Schools are F-rated, which usually means shorter tenancies and higher turnover. Who's the typical renter profile here, and what's been the actual vacancy rate?
- Crime grade is F in this area — have there been break-ins, vandalism, or insurance claims at this property in the last 3 years? What carrier currently insures it and at what premium?
- What's the average days-on-market for RENTAL listings here right now (not sales)? A rising rental-DOM trend means longer vacancies and softer asking-rent achievability than the comps imply.
- What's the recent tenant-quality profile in this submarket — average credit score on applications, eviction rate, late-payment / NSF rate, and stable-employment percentage? A property-management company in the area should have these aggregated.
- How much new for-sale + rental construction is in the pipeline within 1–3 miles? Heavy new supply typically softens prices + rents 12–24 months out; constrained supply supports both.
Investment metrics
- 1% rule
- 1.01% ✓
- Cap rate
- 8.27%
- Cash-on-cash
- 7.07%
- DSCR
- 1.31
- GRM
- 8.3
CMA / ARV
- ARV (on-the-fly)
- $199,136
- Comps found
- 12
Show comp detail 12 sales within ~0.75 mi
| Address | Dist | Beds/Ba | Sqft | Sold | Price | $/sf | Match |
|---|---|---|---|---|---|---|---|
| 7117 E King Pl | 0.27mi | 3/1.0 | 1,497 (-4%) | 11mo | $158,000 | $106 | 70 |
| 1221 N 78th EastAvenue | 0.68mi | 3/1.0 | 1,573 (+0%) | 8mo | $122,000 | $78 | 61 |
| 239 S 69th East Ave | 0.68mi | 3/1.5 | 1,522 (-3%) | 3mo | $65,000 | $43 | 59 |
| 510 N Oxford Ave | 0.35mi | 3/2.0 | 1,395 (-11%) | 7mo | $180,000 | $129 | 55 |
| 307 S 66 Ave E | 0.69mi | 3/2.0 | 1,533 (-2%) | 10mo | $308,000 | $201 | 52 |
| 1027 N 76th EastAvenue | 0.50mi | 4/2.0 (+1) | 1,457 (-7%) | 5mo | $184,500 | $127 | 51 |
| 7379 E Independence St | 0.52mi | 3/1.0 | 1,454 (-7%) | 18mo | $120,000 | $83 | 49 |
| 6217 E Marshall St | 0.46mi | 4/2.0 (+1) | 1,800 (+15%) | 8mo | $108,000 | $60 | 39 |
| 224 S 73rd EastAvenue | 0.71mi | 3/2.0 | 1,369 (-13%) | 4mo | $260,000 | $190 | 39 |
| 1345 N 71st EastAvenue | 0.53mi | 2/2.0 (-1) | 1,418 (-10%) | 19mo | $155,000 | $109 | 35 |
| 327 S 66 Ave E | 0.71mi | 3/2.0 | 1,381 (-12%) | 14mo | $265,000 | $192 | 32 |
| 1336 N 76th EastAvenue | 0.67mi | 4/2.0 (+1) | 1,412 (-10%) | 15mo | $184,900 | $131 | 31 |
Match score weights: distance 35% · size 25% · config 20% · recency 20%. Top-matched comps best support the ARV.
Projected returns pro-forma
-3.0% appreciation · 4.57% rent growth · sell at horizon
- IRR
- -3.8%
- Equity multiple
- 0.85×
- Total profit
- $-5,736
- Equity at exit
- $20,860
- IRR
- 7.4%
- Equity multiple
- 1.60×
- Total profit
- $23,398
- Equity at exit
- $12,096
Cash invested: $39,172 (down + closing). Projections, not guarantees.
Landlord ↔ Tenant lean methodology
- Overall (STATE)
- 83 Strongly Landlord-Friendly
- State Oklahoma
- 83 Strongly Landlord-Friendly · R+20
- County
- — inherits STATE
- City
- — inherits STATE
ZIP-level market 74115
- Home prices YoY
- -9.7%
- Rents YoY
- 4.6%
- Active inventory
- 86
- Price-to-rent
- 8.3×
Monthly cashflow live
- Estimated rent
- $1,410 medium interval (Pro) →
- Mortgage (P&I)
- −$734
- Tax from tax record
- −$91 /mo · $1,092/yr
- Insurance
- −$58
- HOA
- −$0
- Vacancy / Maint / Mgmt
- −$296
- Net cashflow
- $231
Break-even live
UW: 25.0% down · 7.5% · 30yr · 1.5% tax · 5.0% vac · 8.0% maint · 8.0% mgmt
Financing live
Cash to close
- Down payment
- $34,975
- Closing costs
- $4,197
- Reserves months
- —
- Total cash needed
- —
Loan-product check · same deal, 3 products live
Conventional
25% down · 7.5% · 30yr
- Down + closing
- —
- Monthly P&I
- —
- Monthly cashflow
- —
- DSCR
- —
- Eligible?
- —
Personal DTI + credit; lowest rate.
DSCR
20% down · 8.5% · 30yr
- Down + closing
- —
- Monthly P&I
- —
- Monthly cashflow
- —
- DSCR
- —
- Eligible?
- —
No personal income docs; deal must DSCR.
Hard money
10% down · 12.0% · 12mo
- Down + closing
- —
- Monthly P&I
- —
- Monthly cashflow
- —
- DSCR
- —
- Eligible?
- —
Short-term bridge; refi at stabilization.
Rent comps 4 comps
| Address | Beds | Baths | Sqft | Rent | $/sqft | DOM | Units | Dist |
|---|---|---|---|---|---|---|---|---|
| 1404 N Kingston Ave Tulsa, OK | 4.0 | 1.0 | 1279 | $1,350 | $1.06 | 23d | 1 | 0.79mi |
| 6907 E 4th Pl Tulsa, OK | 3.0 | 1.0 | 1900 | $675 | $0.36 | 11d | 1 | 0.80mi |
| 5347 E 5th St Tulsa, OK | 3.0 | 1.0 | 1181 | $1,600 | $1.35 | 23d | 1 | 1.22mi |
| 4703 E Latimer Pl Tulsa, OK | 2.0 | 1.0 | 1103 | $1,290 | $1.17 | 3d | 1 | 1.34mi |
Listing history 16 events
-
2026-06-18days on market $139,900 Active 41 DOM
-
2026-06-17days on market $139,900 Active 40 DOM
-
2026-06-16days on market $139,900 Active 39 DOM
-
2026-06-15days on market $139,900 Active 38 DOM
-
2026-06-13days on market $139,900 Active 36 DOM
-
2026-06-10days on market $139,900 Active 33 DOM
-
2026-06-09days on market $139,900 Active 32 DOM
-
2026-06-08days on market $139,900 Active 31 DOM
-
2026-06-07days on market $139,900 Active 30 DOM
-
2026-06-05days on market $139,900 Active 27 DOM
-
2026-06-03days on market $139,900 Active 26 DOM
-
2026-06-02days on market $139,900 Active 25 DOM
-
2026-06-01days on market $139,900 Active 24 DOM
-
2026-05-31days on market $139,900 Active 23 DOM
-
2026-05-08$149,900 Active
-
2007-03-02soldstatus $21,000
ⓘ Source: listings_history table (triggers on properties + properties_extension) + one-shot
backfill from property_details.listing_events for pre-trigger history.
Tax reassessment forecast OK · Resets to sale price
- Current annual tax
- $1,092 · $91/mo
- Projected year-2 tax
- $1,259 · $105/mo
- Expected delta
- +$167/yr (+$14/mo · 15.3%)
ⓘ Screening estimate from a state-policy table — verify with the county assessor before closing.
Climate risk First Street
- Flood 1/10 Low FEMA zone X (unshaded) · 0% chance over 30 yrs
- Wildfire 3/10 Moderate
- Heat 6/10 Major 7 d/yr ≥110°F today · 18 d/yr by 30 yrs out
- Wind 2/10 Low 3% chance of damaging wind over 30 yrs
- Air quality 3/10 Moderate 2 unhealthy d/yr today · 3 by 30 yrs out
Nearby sold comps map
Loading sold comps map…
Walkable amenities ~0.75 mi
Loading nearby amenities…
Taxation est. · year 1
- Rental income
- $16,918
- − Mortgage interest
- −$7,837
- − Property taxes
- −$1,092
- − Insurance
- −$700
- − Repairs & maintenance
- −$1,353
- − Management
- −$1,353
- − Depreciation
- −$4,070
- Taxable income
- $513
- Est. tax owed @ 24.0%
- −$123
- After-tax cash flow
- $2,647/yr
For passive investors: Depreciation is non-cash, so a rental often shows a tax loss while cash-flowing — sheltering income. Rental losses are passive: they offset passive income freely, and up to $25,000/yr can offset ordinary (W-2) income if you actively participate and your MAGI is under $100k (phasing out to $0 by $150k); unused losses carry forward. On sale, claimed depreciation is recaptured at up to 25%, and gains may owe capital-gains tax (a 1031 exchange can defer both). Figures are a year-1 estimate at your 24.0% rate — not tax advice; consult a CPA.
Schools (NCES district)
- District
- Tulsa
- NCES district ID
- 4030240
- Math proficiency
- 7% ▼ -9.00%
- Reading proficiency
- 12% ▼ -7.00%
- Median HH income
- $37,895
- Composite
- 8.04/100
- National rank
- #9919
- State rank
- #250 of 270 in OK
Livability — Tulsa
- Score
- 75/100
- State rank
- #13
- US rank
- #4058
Category grades
Schools grade is shown separately in the Schools card above.
Census & demographics
- Census place
- Tulsa, OK
- County
- Tulsa County · 640,811 people
- City population
- 389,418
- Metro
- Tulsa, OK
- Population (ZIP)
- 24,297
- Household income
- $44,608
- Rent vs Own
- Severe rent burden
- 805.0
Population outlook (Tulsa County) Hauer SSP2
- Today (2025)
- 723,846 people
- By 2030
- 766,033 · +5.8%
- By 2040
- 851,386 · +17.6%
- By 2050
- 938,389 · +29.6%
- By 2075
- 1,166,011 · +61.1%
- By 2100
- 1,350,277 · +86.5%
Race, ethnicity, and origin ACS 2023
- Neighborhood character
- Diverse neighborhood (Simpson 0.68)
- Race & ethnicity
- Hispanic / Latino 44% White 33% Two or more races 19% Black 13% Native American 5%
- Hispanic origin (detail)
- Mexican 39%
- Common ancestry
- Italian 1% Slovak 1% Lithuanian 1%
- Foreign-born
- 19% · Canada
- Languages at home
- 57% English-only · Spanish 42%
Political lean MEDSL · Tulsa
- 2024 margin
- R (+15.2) · D 41.3% · R 56.5% · Other 2.2%
- 2008→2024 swing
- +9.2pp toward D · 2008: -24.5pp · 2024: -15.2pp
- All cycles
- 2024: R+15.2 2020: R+15.6 2016: R+22.9 2012: R+27.4 2008: R+24.5
Not yet ingested
- Civics
- —
Market trends
- HPI YoY
- ▼ -26.82%
- Current HPI
- 251.0869
- Rent YoY
- ▲ 4.57%
- Metro
- Tulsa, OK
- State GDP YoY
- ▲ 1.55%
- F500 in state
- 6
Industry mix (Fortune 500 HQ in OK)
| Industry | F500 HQs | Revenue |
|---|---|---|
| Energy | 3 | $48B |
|
||
Price history
+613.8% since first listed2 events — show timeline
- 2026-05-08 Listed $149,900 MLS Technology, Inc.
- 2007-03-02 Sold (Public Records) $21,000 Public Records
Property tax history
+2.2%/yrLatest (2025): $1,092 · +8.7% YoY. Source: county tax records.
Cash-flow waterfall
monthlySold comps — $/sqft
last 12 mo · ≤1 miLoading sold comps…