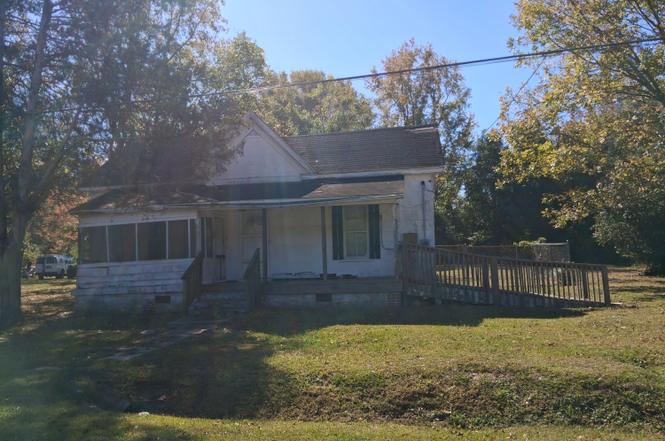
107 Tilghman St · Kenly, NC
Flood risk 3/10 · Minor
- FEMA flood zone
- X (unshaded)
- Chance of flooding over 30 yrs
- 0.2%
- Est. flood insurance / yr
- $507 – $1,088
Fire risk 3/10 · Minor
- Est. fire insurance / yr
- $906 – $1,684
Heat risk 7/10 · Major
- Hot days now (above 106°F)
- 7 days/yr
- Hot days in 30 yrs
- 17 days/yr
Wind risk 6/10 · Moderate
- Chance of severe wind over 30 yrs
- 72.0%
Air-quality risk 3/10 · Minor
- Unhealthy air days now
- 3 days/yr
- Unhealthy air days in 30 yrs
- 3 days/yr
Risk factors via First Street. Map © Google.
Why this score? — see what drove the B+ grade
The composite is a weighted blend of 9 inputs, each scored 0–100. Each bar is that input's sub-score; the figure is the points it added to the 100-point composite (weight × sub-score).
- Cash flow +30.0/30.0
- 1% rule +10.0/10.0
- DSCR +10.0/10.0
- Appreciation +10.0/10.0
- ARV discount +7.5/15.0
- Schools +3.5/10.0
- Livability +3.4/5.0
- Rent growth +2.5/5.0
- Condition / age +2.5/5.0
$60,000
🖨 Deal sheet 📄 Offer letter ✓ Due diligence
Listing remarks
TWO PARCELS BEING SOLD TOGETHER! Older house on nice . 25 acre lot PLUS adjoining vacant lot with . 17 acres totaling approximately . 42 acres! Great Project For Investor or Experienced Repairman To Bring BEAUTY and LIFE Back To This Home! The house is boarded up, is not habitable in its current condition and has not been lived in for many years. House Is/Was Connected To City Water and City Sewer! NO Survey Available!
Key facts
- 0.26 acre lot
- Built 1920
- Listed 209 days
Property features AI
Finance
- Other: County: Johnston
- HOA & community: No homeowners association; Not a senior community
Exterior
- Utilities: Public sewer (other sewer types also noted); Water source: see remarks; Utilities: see remarks
- Home design: Single-story house; Entry level: one level
- Construction: Wood siding exterior; Other exterior materials noted; Block foundation (see remarks); Roof: see remarks; Built as a house (1,130 total living area)
- Exterior features: Lot approximately 0.26 acres; Frontage: see remarks; Road is publicly maintained
Interior
- Bedrooms: Three bedrooms (all on the main level)
- Flooring: See remarks
- Bathrooms: One full bathroom
- Heating & cooling: Cooling present (see remarks for details); Heating: see remarks
- Interior features: Flooring: see remarks
Neighborhood map
What this means for you Summary
Snapshot
- This is a 3-bed/1.0-bath single-family listed at $60k.
Deal economics
- At list price, monthly cash flow is $1k ($13k/yr) — positive.
- The deal already cash-flows at list — no discount required.
- Meets the 1% rule at list price ($2k rent vs $60k).
- Recommended offer: $53k (12.0% below list) — sets the bar for market timing.
- Cap rate 27.4% vs local median 3.9% in Kenly — top-decile yield for the area; either an underpriced asset or a hidden risk that comps aren't pricing in. Stress-test before assuming the spread holds.
Location & tenants
- Location reads 68/100 on livability (#183 in NC) — a middle-class / working-renter tenant base. Strengths: cost of living A+, housing A+, health & safety A+; Watch: amenities F, commute F, employment F.
- Johnston County Public Schools (rural): math 39% / reading 42% proficiency, ranked #105 of 178 in NC (top 59%) — families likely to look elsewhere, expect single-tenant / working-renter base with shorter leases.
- Zoned schools: North Johnston Middle (math 26% / reading 36%, grade F, #326 of 475 statewide, top 69%, 600 students, 72% FRL); North Johnston High (math 27% / reading 37%, grade F, #445 of 535 statewide, top 84%, 787 students, 62% FRL) — zoned schools average 67% FRL vs 41% district-wide (26 pts higher); higher-poverty schools than district average — tighter screening recommended.
- Market conditions: 89 active listings in the ZIP; 1 comparable units currently listed for rent nearby; 2,783 units permitted in Johnston County in 2024 (6 in 5+ unit buildings).
Forward outlook
- In year one you build about $6k of equity ($415 loan paydown + $6k appreciation (10.0% local appreciation)).
- Johnston County population projected at +37% by 2050 — long-run rental-demand tailwind backs the buy-and-hold thesis.
- At projected returns (10.0% appreciation + 3.0% rent growth), your $17k cash investment doubles in ~1 year — after that, you're playing with house money.
- By year 6, paydown + projected appreciation supports a ~$38k cash-out refi (75% LTV) — recoverable capital for the next deal without selling this one.
Negotiation context
- It's been on market 209 days — a 12% lower offer ($53k) is reasonable based on typical stale-listing flexibility.
Risks & watch-outs
- Watch-outs: built in 1920 — expect roof / HVAC / electrical / plumbing capex.
- Climate carrying-cost: major wind risk, 72% chance of damaging wind over 30y; extreme-heat days projected 7→17/yr by 2055 (HVAC capex compounding) — expect insurance premiums to compound above CPI over the hold.
Questions for the listing agent
- It's been on market 209 days. Have you received any prior offers? Is the seller open to a 12% concession, seller financing, or rate buy-down credit?
- Built in 1920 — when were the roof, HVAC, electrical panel, plumbing, and water heater last replaced?
- Why hasn't it sold? Are there any deal-killer items the seller is aware of (foundation, flood, title, zoning, code violations)?
- Is there a deadline driving the sale (1031 exchange, divorce, estate, relocation)? That informs how much negotiation room exists.
- Schools are F-rated, which usually means shorter tenancies and higher turnover. Who's the typical renter profile here, and what's been the actual vacancy rate?
- What's the average days-on-market for RENTAL listings here right now (not sales)? A rising rental-DOM trend means longer vacancies and softer asking-rent achievability than the comps imply.
- What's the recent tenant-quality profile in this submarket — average credit score on applications, eviction rate, late-payment / NSF rate, and stable-employment percentage? A property-management company in the area should have these aggregated.
- How much new for-sale + rental construction is in the pipeline within 1–3 miles? Heavy new supply typically softens prices + rents 12–24 months out; constrained supply supports both.
Investment metrics
- 1% rule
- 3.00% ✓
- Cap rate
- 27.38%
- Cash-on-cash
- 75.31%
- DSCR
- 4.35
- GRM
- 2.8
CMA / ARV
- ARV (on-the-fly)
- $220,350
- Comps found
- 8
Show comp detail 8 sales within ~0.75 mi
| Address | Dist | Beds/Ba | Sqft | Sold | Price | $/sf | Match |
|---|---|---|---|---|---|---|---|
| 104 E Pope Ave | 0.34mi | 3/2.0 | 1,229 (+9%) | 2mo | $250,000 | $203 | 64 |
| 102 E Pope Ave | 0.38mi | 3/2.0 | 1,227 (+9%) | 2mo | $244,500 | $199 | 62 |
| 316 S Maple Ave | 0.58mi | 3/2.0 | 1,191 (+5%) | 6mo | $170,000 | $143 | 54 |
| 105 N Maple Ave | 0.35mi | 3/2.0 | 1,070 (-5%) | 23mo | $226,000 | $211 | 52 |
| 314 S Darden St | 0.61mi | 3/2.0 | 1,280 (+13%) | 9mo | $248,700 | $194 | 38 |
| 623 Lincoln Dr | 0.68mi | 3/1.0 | 977 (-14%) | 10mo | $170,000 | $174 | 38 |
| 315 S Maple Ave | 0.59mi | 3/2.0 | 1,295 (+15%) | 10mo | $246,900 | $191 | 36 |
| 301 W Grady St | 0.54mi | 2/1.0 (-1) | 972 (-14%) | 24mo | $189,900 | $195 | 27 |
Match score weights: distance 35% · size 25% · config 20% · recency 20%. Top-matched comps best support the ARV.
Projected returns pro-forma
10.0% appreciation · 3.0% rent growth · sell at horizon
- IRR
- 85.7%
- Equity multiple
- 6.94×
- Total profit
- $99,823
- Equity at exit
- $54,053
- IRR
- 80.2%
- Equity multiple
- 15.35×
- Total profit
- $241,155
- Equity at exit
- $116,567
Cash invested: $16,800 (down + closing). Projections, not guarantees.
Landlord ↔ Tenant lean methodology
- Overall (STATE)
- 85 Strongly Landlord-Friendly
- State North Carolina
- 85 Strongly Landlord-Friendly · R+3
- County
- — inherits STATE
- City
- — inherits STATE
ZIP-level market 27542
- Home prices YoY
- 16.6%
- Active inventory
- 89
- Price-to-rent
- 2.8×
Monthly cashflow live
- Estimated rent
- $1,800 medium interval (Pro) →
- Mortgage (P&I)
- −$315
- Tax from tax record
- −$28 /mo · $337/yr
- Insurance
- −$25
- HOA
- −$0
- Vacancy / Maint / Mgmt
- −$378
- Net cashflow
- $1,054
Break-even live
UW: 25.0% down · 7.5% · 30yr · 1.5% tax · 5.0% vac · 8.0% maint · 8.0% mgmt
Financing live
Cash to close
- Down payment
- $15,000
- Closing costs
- $1,800
- Reserves months
- —
- Total cash needed
- —
Loan-product check · same deal, 3 products live
Conventional
25% down · 7.5% · 30yr
- Down + closing
- —
- Monthly P&I
- —
- Monthly cashflow
- —
- DSCR
- —
- Eligible?
- —
Personal DTI + credit; lowest rate.
DSCR
20% down · 8.5% · 30yr
- Down + closing
- —
- Monthly P&I
- —
- Monthly cashflow
- —
- DSCR
- —
- Eligible?
- —
No personal income docs; deal must DSCR.
Hard money
10% down · 12.0% · 12mo
- Down + closing
- —
- Monthly P&I
- —
- Monthly cashflow
- —
- DSCR
- —
- Eligible?
- —
Short-term bridge; refi at stabilization.
Rent comps 1 comps
| Address | Beds | Baths | Sqft | Rent | $/sqft | DOM | Units | Dist |
|---|---|---|---|---|---|---|---|---|
| 309 S College Ave Kenly, NC | 3.0 | 2.0 | 1459 | $1,800 | $1.23 | 23d | 1 | 0.51mi |
Listing history 17 events
-
2026-06-18days on market $60,000 Active 209 DOM
-
2026-06-17days on market $60,000 Active 208 DOM
-
2026-06-16days on market $60,000 Active 207 DOM
-
2026-06-15days on market $60,000 Active 206 DOM
-
2026-06-13days on market $60,000 Active 204 DOM
-
2026-06-13pricedays on market $60,000 Active 203 DOM
-
2026-06-09days on market $62,500 Active 200 DOM
-
2026-06-08days on market $62,500 Active 199 DOM
-
2026-06-07days on market $62,500 Active 198 DOM
-
2026-06-05days on market $62,500 Active 195 DOM
-
2026-06-03days on market $62,500 Active 194 DOM
-
2026-06-02days on market $62,500 Active 193 DOM
-
2026-06-01days on market $62,500 Active 192 DOM
-
2026-05-31days on market $62,500 Active 191 DOM
-
2026-03-20price $62,500
-
2026-02-04price $65,000
-
2025-11-21$70,000 Active
ⓘ Source: listings_history table (triggers on properties + properties_extension) + one-shot
backfill from property_details.listing_events for pre-trigger history.
Tax reassessment forecast NC · Resets to sale price
- Current annual tax
- $337 · $28/mo
- Projected year-2 tax
- $492 · $41/mo
- Expected delta
- +$155/yr (+$13/mo · 46.0%)
ⓘ Screening estimate from a state-policy table — verify with the county assessor before closing.
Climate risk First Street
- Flood 3/10 Moderate FEMA zone X (unshaded) · 20% chance over 30 yrs
- Wildfire 3/10 Moderate
- Heat 7/10 Severe 7 d/yr ≥106°F today · 17 d/yr by 30 yrs out
- Wind 6/10 Major 72% chance of damaging wind over 30 yrs
- Air quality 3/10 Moderate 3 unhealthy d/yr today · 3 by 30 yrs out
Nearby sold comps map
Loading sold comps map…
Walkable amenities ~0.75 mi
Loading nearby amenities…
Taxation est. · year 1
- Rental income
- $21,600
- − Mortgage interest
- −$3,361
- − Property taxes
- −$337
- − Insurance
- −$300
- − Repairs & maintenance
- −$1,728
- − Management
- −$1,728
- − Depreciation
- −$1,745
- Taxable income
- $12,401
- Est. tax owed @ 24.0%
- −$2,976
- After-tax cash flow
- $9,675/yr
For passive investors: Depreciation is non-cash, so a rental often shows a tax loss while cash-flowing — sheltering income. Rental losses are passive: they offset passive income freely, and up to $25,000/yr can offset ordinary (W-2) income if you actively participate and your MAGI is under $100k (phasing out to $0 by $150k); unused losses carry forward. On sale, claimed depreciation is recaptured at up to 25%, and gains may owe capital-gains tax (a 1031 exchange can defer both). Figures are a year-1 estimate at your 24.0% rate — not tax advice; consult a CPA.
Schools (NCES district)
- District
- Johnston County Public Schools
- NCES district ID
- 3702370
- Math proficiency
- 39% ▲ 4.00%
- Reading proficiency
- 42% ▲ 2.00%
- Median HH income
- $50,912
- Composite
- 34.99/100
- National rank
- #5052
- State rank
- #105 of 178 in NC
Livability — Kenly
- Score
- 68/100
- State rank
- #183
- US rank
- #9261
Category grades
Schools grade is shown separately in the Schools card above.
Census & demographics
- Census place
- Kenly, NC
- Population (ZIP)
- 9,441
Population outlook (Johnston County) Hauer SSP2
- Today (2025)
- 222,440 people
- By 2030
- 240,227 · +8.0%
- By 2040
- 274,616 · +23.5%
- By 2050
- 304,915 · +37.1%
- By 2075
- 369,507 · +66.1%
- By 2100
- 406,280 · +82.6%
Race, ethnicity, and origin ACS 2023
- Neighborhood character
- Predominantly White (74%)
- Race & ethnicity
- White 74% Black 13% Hispanic / Latino 9% Two or more races 9%
- Hispanic origin (detail)
- Mexican 8%
- Common ancestry
- Scotch-Irish 3% Serbian 1% Scottish 1%
- Foreign-born
- 4% · Canada
- Languages at home
- 91% English-only · Spanish 9%
Political lean MEDSL · Johnston
- 2024 margin
- Strong R (+21.5) · D 38.7% · R 60.2% · Other 1.1%
- 2008→2024 swing
- +2.2pp toward D · 2008: -23.7pp · 2024: -21.5pp
- All cycles
- 2024: R+21.5 2020: R+24.3 2016: R+30.7 2012: R+27.8 2008: R+23.7
Not yet ingested
- Civics
- —
Market trends
- HPI YoY
- ▲ 40.03%
- Current HPI
- 280.6408
- Rent YoY
- —
- Metro
- —
- State GDP YoY
- ▲ 3.28%
- F500 in state
- 26
Industry mix (Fortune 500 HQ in NC)
| Industry | F500 HQs | Revenue |
|---|---|---|
| Financial Services | 2 | $213B |
|
||
| Retail | 2 | $95B |
|
||
| Industrial Conglomerate | 1 | $38B |
|
||
| Metals / Steel | 1 | $35B |
|
||
| Utilities | 1 | $30B |
|
||
| Industrial Machinery | 1 | $19B |
|
||
Price history
-10.7% since first listed3 events — show timeline
- 2026-03-20 Price Changed $62,500 TMLS
- 2026-02-04 Price Changed $65,000 TMLS
- 2025-11-21 Listed $70,000 TMLS
Property tax history
-3.7%/yrLatest (2025): $337 · +19.2% YoY. Source: county tax records.
Cash-flow waterfall
monthlySold comps — $/sqft
last 12 mo · ≤1 miLoading sold comps…