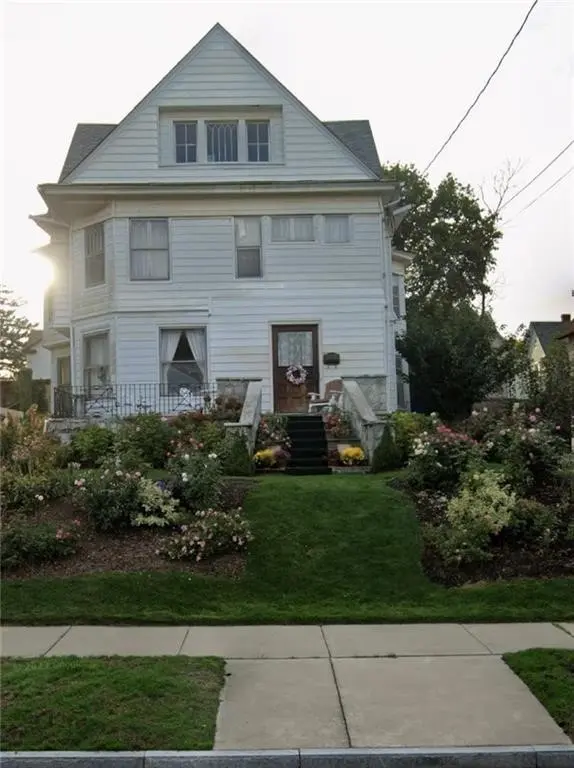
23 N Genesee St · Geneva, NY
Flood risk 1/10 · Minimal
- FEMA flood zone
- X
- Chance of flooding over 30 yrs
- 0.0%
- Est. flood insurance / yr
- $473 – $860
Fire risk 3/10 · Minor
- Est. fire insurance / yr
- $691 – $1,283
Heat risk 3/10 · Minor
- Hot days now (above 97°F)
- 7 days/yr
- Hot days in 30 yrs
- 16 days/yr
Wind risk 1/10 · Minimal
- Chance of severe wind over 30 yrs
- —
Air-quality risk 2/10 · Minimal
- Unhealthy air days now
- 0 days/yr
- Unhealthy air days in 30 yrs
- 1 days/yr
Risk factors via First Street. Map © Google.
Why this score? — see what drove the C grade
The composite is a weighted blend of 9 inputs, each scored 0–100. Each bar is that input's sub-score; the figure is the points it added to the 100-point composite (weight × sub-score).
- Cash flow +16.6/30.0
- ARV discount +15.0/15.0
- 1% rule +6.1/10.0
- DSCR +5.1/10.0
- Livability +3.9/5.0
- Schools +3.3/10.0
- Rent growth +2.5/5.0
- Condition / age +2.5/5.0
- Appreciation +0.0/10.0
$162,000
🖨 Deal sheet 📄 Offer letter ✓ Due diligence
Listing remarks MLS
Beautiful historical home with natural custom woodwork throughout, family room, formal living room, formal dining room, foyer with open staircase, hardwood floors throughout, French doors, pocket oak doors, two wood-burning fireplaces, stunning stained glass windows, open and spacious, 5 bedrooms with a full walk up attic and back staircase, charming Butler’s pantry. Stunning rose beds planted throughout backyard. Some TLC needed. Property being sold as is.
Key facts
- Open staircase
- Formal dining room
- French doors
Tags
Neighborhood map
What this means for you Summary
Snapshot
- This is a 5-bed/1.5-bath single-family listed at $162k.
Deal economics
- At list price, monthly cash flow is $97 ($1k/yr) — positive.
- The deal already cash-flows at list — no discount required.
- Meets the 1% rule at list price ($2k rent vs $162k).
- Recommended offer: $143k (12.0% below list) — sets the bar for market timing.
- Cap rate 7.0% vs local median 5.0% in Geneva — top-decile yield for the area; either an underpriced asset or a hidden risk that comps aren't pricing in. Stress-test before assuming the spread holds.
Location & tenants
- Location reads 78/100 on livability (#177 in NY, #2,760 nationally) — a middle-class / working-renter tenant base. Strengths: cost of living A+, housing A+, health & safety A+; Watch: schools D+, crime D+, employment D.
- Geneva City School District (town): math 36% / reading 43% proficiency, ranked #528 of 590 in NY (top 90%) — families likely to look elsewhere, expect single-tenant / working-renter base with shorter leases.
- Market conditions: 122 active listings in the ZIP; 284 units permitted in Ontario County in 2024 (69 in 5+ unit buildings).
Forward outlook
- Local home prices are declining (-3.0%/yr); year-one equity from $1k of loan paydown is wiped out by about $5k of value loss. Plan a longer hold.
- Ontario County population projected to shrink 6% by 2050 — rents likely to lag national; underwrite the cash flow, not the appreciation.
Negotiation context
- It's been on market 157 days — a 12% lower offer ($143k) is reasonable based on typical stale-listing flexibility.
- 3 sale attempts since 11y ago; this cycle's ask has dropped $48k (23%) from the opening price — seller is motivated, your offer sets the floor, not the list.
- Current owner paid $42k; list at $162k implies a 290% gain — meaningful room to come down on a strong offer.
Risks & watch-outs
- Watch-outs: property tax is 3.0% of price; built in 1880 — expect roof / HVAC / electrical / plumbing capex.
Questions for the listing agent
- It's been on market 157 days. Have you received any prior offers? Is the seller open to a 12% concession, seller financing, or rate buy-down credit?
- Built in 1880 — when were the roof, HVAC, electrical panel, plumbing, and water heater last replaced?
- Property tax is high relative to price — has the assessment been appealed recently, and will the sale trigger a re-assessment?
- Why hasn't it sold? Are there any deal-killer items the seller is aware of (foundation, flood, title, zoning, code violations)?
- Is there a deadline driving the sale (1031 exchange, divorce, estate, relocation)? That informs how much negotiation room exists.
- Schools are D-rated, which usually means shorter tenancies and higher turnover. Who's the typical renter profile here, and what's been the actual vacancy rate?
- Crime grade is D in this area — have there been break-ins, vandalism, or insurance claims at this property in the last 3 years? What carrier currently insures it and at what premium?
- What's the average days-on-market for RENTAL listings here right now (not sales)? A rising rental-DOM trend means longer vacancies and softer asking-rent achievability than the comps imply.
- What's the recent tenant-quality profile in this submarket — average credit score on applications, eviction rate, late-payment / NSF rate, and stable-employment percentage? A property-management company in the area should have these aggregated.
- How much new for-sale + rental construction is in the pipeline within 1–3 miles? Heavy new supply typically softens prices + rents 12–24 months out; constrained supply supports both.
Investment metrics
- 1% rule
- 1.11% ✓
- Cap rate
- 7.01%
- Cash-on-cash
- 2.57%
- DSCR
- 1.11
- GRM
- 7.5
CMA / ARV
- ARV (median comp)
- $210,396
- List price
- $162,000
- Delta
- -23.00%
- Verdict
- UNDERPRICED
- Comps
- 20 within 1.0 mi
Show comp detail 4 sales within ~0.75 mi
| Address | Dist | Beds/Ba | Sqft | Sold | Price | $/sf | Match |
|---|---|---|---|---|---|---|---|
| 367 Castle St | 0.60mi | 5/1.5 | 2,657 (-2%) | 7mo | $130,000 | $49 | 62 |
| 51 Sherrill St | 0.09mi | 5/3.5 | 3,100 (+14%) | 5mo | $290,000 | $94 | 60 |
| 98 Hillcrest Ave | 0.68mi | 5/2.0 | 2,756 (+1%) | 12mo | $325,000 | $118 | 54 |
| 115 N Main St | 0.34mi | 5/3.0 | 3,032 (+11%) | 14mo | $195,000 | $64 | 47 |
Match score weights: distance 35% · size 25% · config 20% · recency 20%. Top-matched comps best support the ARV.
Projected returns pro-forma
-3.0% appreciation · 3.0% rent growth · sell at horizon
- IRR
- -12.1%
- Equity multiple
- 0.56×
- Total profit
- $-19,902
- Equity at exit
- $24,155
- IRR
- -2.8%
- Equity multiple
- 0.81×
- Total profit
- $-8,727
- Equity at exit
- $14,007
Cash invested: $45,360 (down + closing). Projections, not guarantees.
Landlord ↔ Tenant lean methodology
- Overall (STATE)
- 15 Strongly Tenant-Friendly
- State New York
- 15 Strongly Tenant-Friendly · D+10
- County
- — inherits STATE
- City
- — inherits STATE
ZIP-level market 14456
- Home prices YoY
- -15.8%
- Active inventory
- 122
- Price-to-rent
- 7.5×
Monthly cashflow live
- Estimated rent
- $1,802 medium interval (Pro) →
- Mortgage (P&I)
- −$850
- Tax from tax record
- −$409 /mo · $4,913/yr
- Insurance
- −$68
- HOA
- −$0
- Vacancy / Maint / Mgmt
- −$378
- Net cashflow
- $97
Break-even live
UW: 25.0% down · 7.5% · 30yr · 1.5% tax · 5.0% vac · 8.0% maint · 8.0% mgmt
Financing live
Cash to close
- Down payment
- $40,500
- Closing costs
- $4,860
- Reserves months
- —
- Total cash needed
- —
Loan-product check · same deal, 3 products live
Conventional
25% down · 7.5% · 30yr
- Down + closing
- —
- Monthly P&I
- —
- Monthly cashflow
- —
- DSCR
- —
- Eligible?
- —
Personal DTI + credit; lowest rate.
DSCR
20% down · 8.5% · 30yr
- Down + closing
- —
- Monthly P&I
- —
- Monthly cashflow
- —
- DSCR
- —
- Eligible?
- —
No personal income docs; deal must DSCR.
Hard money
10% down · 12.0% · 12mo
- Down + closing
- —
- Monthly P&I
- —
- Monthly cashflow
- —
- DSCR
- —
- Eligible?
- —
Short-term bridge; refi at stabilization.
Listing history 30 events
-
2026-06-18days on market $162,000 Active 157 DOM
-
2026-06-17days on market $162,000 Active 156 DOM
-
2026-06-16days on market $162,000 Active 155 DOM
-
2026-06-15days on market $162,000 Active 154 DOM
-
2026-06-13days on market $162,000 Active 152 DOM
-
2026-06-12days on market $162,000 Active 151 DOM
-
2026-06-09pricedays on market $162,000 Active 148 DOM
-
2026-06-08days on market $170,000 Active 147 DOM
-
2026-06-07days on market $170,000 Active 146 DOM
-
2026-06-07days on market $170,000 Active 145 DOM
-
2026-06-04days on market $170,000 Active 142 DOM
-
2026-06-02days on market $170,000 Active 141 DOM
-
2026-06-01days on market $170,000 Active 140 DOM
-
2026-05-31days on market $170,000 Active 139 DOM
-
2026-05-12price $195,999 467-char remark
Show marketing remark (467 chars)
Beautiful historical home with natural custom woodwork throughout, family room, formal living room, formal dining room, foyer with open staircase, hardwood floors throughout, French doors, pocket oak doors, two wood-burning fireplaces, stunning stained glass windows, open and spacious, 5 bedrooms with a full walk up attic and back staircase, charming Butler’s pantry. Stunning rose beds planted throughout backyard. Some TLC needed. Property being sold as is.
-
2026-02-02price $199,999 467-char remark
Show marketing remark (467 chars)
Beautiful historical home with natural custom woodwork throughout, family room, formal living room, formal dining room, foyer with open staircase, hardwood floors throughout, French doors, pocket oak doors, two wood-burning fireplaces, stunning stained glass windows, open and spacious, 5 bedrooms with a full walk up attic and back staircase, charming Butler’s pantry. Stunning rose beds planted throughout backyard. Some TLC needed. Property being sold as is.
-
2026-01-12$210,000 Active 467-char remark
Show marketing remark (467 chars)
Beautiful historical home with natural custom woodwork throughout, family room, formal living room, formal dining room, foyer with open staircase, hardwood floors throughout, French doors, pocket oak doors, two wood-burning fireplaces, stunning stained glass windows, open and spacious, 5 bedrooms with a full walk up attic and back staircase, charming Butler’s pantry. Stunning rose beds planted throughout backyard. Some TLC needed. Property being sold as is.
-
2026-01-10historical
-
2025-10-10$210,000 Active
-
2016-12-14soldstatus $41,500 Closed Sale or Rented
-
2016-11-08historical Under Contract- Do Not Show
-
2016-10-28status Pending Sale
-
2016-09-16price $44,900
-
2016-08-13price $49,900
-
2016-07-27price $54,900
-
2016-05-25price $55,000
-
2015-12-21price $59,900
-
2015-09-12price $64,900
-
2015-08-05price $69,900
-
2015-06-23$75,000 Active
ⓘ Source: listings_history table (triggers on properties + properties_extension) + one-shot
backfill from property_details.listing_events for pre-trigger history.
Tax reassessment forecast NY · Partial reset (capped growth)
- Current annual tax
- $4,913 · $409/mo
- Projected year-2 tax
- $4,913 · $409/mo
- Expected delta
- $0/yr ($0/mo · 0.0%)
ⓘ Screening estimate from a state-policy table — verify with the county assessor before closing.
Climate risk First Street
- Flood 1/10 Low FEMA zone X · 0% chance over 30 yrs
- Wildfire 3/10 Moderate
- Heat 3/10 Moderate 7 d/yr ≥97°F today · 16 d/yr by 30 yrs out
- Wind 1/10 Low
- Air quality 2/10 Low 0 unhealthy d/yr today · 1 by 30 yrs out
Nearby sold comps map
Loading sold comps map…
Walkable amenities ~0.75 mi
Loading nearby amenities…
Taxation est. · year 1
- Rental income
- $21,627
- − Mortgage interest
- −$9,075
- − Property taxes
- −$4,913
- − Insurance
- −$810
- − Repairs & maintenance
- −$1,730
- − Management
- −$1,730
- − Depreciation
- −$4,713
- Taxable loss
- −$1,344
- Est. tax savings @ 24.0%
- +$323
- After-tax cash flow
- $1,490/yr
For passive investors: Depreciation is non-cash, so a rental often shows a tax loss while cash-flowing — sheltering income. Rental losses are passive: they offset passive income freely, and up to $25,000/yr can offset ordinary (W-2) income if you actively participate and your MAGI is under $100k (phasing out to $0 by $150k); unused losses carry forward. On sale, claimed depreciation is recaptured at up to 25%, and gains may owe capital-gains tax (a 1031 exchange can defer both). Figures are a year-1 estimate at your 24.0% rate — not tax advice; consult a CPA.
Schools (NCES district)
- District
- Geneva City School District
- NCES district ID
- 3611970
- Math proficiency
- 36% ▲ 3.00%
- Reading proficiency
- 43% ▲ 11.00%
- Median HH income
- $44,012
- Composite
- 33.48/100
- National rank
- #5448
- State rank
- #528 of 590 in NY
Livability — Geneva
- Score
- 78/100
- State rank
- #177
- US rank
- #2760
Category grades
Schools grade is shown separately in the Schools card above.
Census & demographics
- Census place
- Geneva, NY
- Population (ZIP)
- 19,864
Population outlook (Ontario County) Hauer SSP2
- Today (2025)
- 111,230 people
- By 2030
- 111,401 · +0.2%
- By 2040
- 109,535 · -1.5%
- By 2050
- 104,895 · -5.7%
- By 2075
- 92,999 · -16.4%
- By 2100
- 73,723 · -33.7%
Race, ethnicity, and origin ACS 2023
- Neighborhood character
- Predominantly White (75%)
- Race & ethnicity
- White 75% Hispanic / Latino 13% Two or more races 7% Black 6% Asian 2%
- Hispanic origin (detail)
- Mexican 2% Puerto Rican 9%
- Common ancestry
- Iranian 5% Slovak 3% Italian 2%
- Foreign-born
- 6% · Canada, China
- Languages at home
- 87% English-only · Spanish 7% Other Indo-European 2% German/W. Germanic 1%
Political lean MEDSL · Ontario
- 2024 margin
- Toss-up / Even · D 49.4% · R 50.6%
- 2008→2024 swing
- -1.0pp toward R · 2008: -0.1pp · 2024: -1.2pp
- All cycles
- 2024: R+1.2 2020: R+0.0 2016: R+8.6 2012: R+1.6 2008: R+0.1
Not yet ingested
- Civics
- —
Market trends
- HPI YoY
- ▼ -57.56%
- Current HPI
- 307.9168
- Rent YoY
- —
- Metro
- —
- State GDP YoY
- ▲ 2.60%
- F500 in state
- 92
Industry mix (Fortune 500 HQ in NY)
| Industry | F500 HQs | Revenue |
|---|---|---|
| Financial Services | 10 | $950B |
|
||
| Consumer Goods | 9 | $162B |
|
||
| Insurance | 4 | $225B |
|
||
| Telecommunications | 2 | $144B |
|
||
| Pharmaceuticals | 2 | $112B |
|
||
| Media / Entertainment | 2 | $69B |
|
||
Price history
+161.3% since first listed16 events — show timeline
- 2026-05-12 Price Changed $195,999 UNYREIS
- 2026-02-02 Price Changed $199,999 UNYREIS
- 2026-01-12 Listed $210,000 UNYREIS
- 2026-01-10 Listing Removed — UNYREIS
- 2025-10-10 Listed $210,000 UNYREIS
- 2016-12-14 Sold (MLS) $41,500 UNYREIS
- 2016-11-08 Contingent — UNYREIS
- 2016-10-28 Pending — UNYREIS
- 2016-09-16 Price Changed $44,900 UNYREIS
- 2016-08-13 Price Changed $49,900 UNYREIS
- 2016-07-27 Price Changed $54,900 UNYREIS
- 2016-05-25 Price Changed $55,000 UNYREIS
- 2015-12-21 Price Changed $59,900 UNYREIS
- 2015-09-12 Price Changed $64,900 UNYREIS
- 2015-08-05 Price Changed $69,900 UNYREIS
- 2015-06-23 Listed $75,000 UNYREIS
Property tax history
+16.6%/yrLatest (2025): $4,913 · +0.2% YoY. Source: county tax records.
Cash-flow waterfall
monthlySold comps — $/sqft
last 12 mo · ≤1 miLoading sold comps…