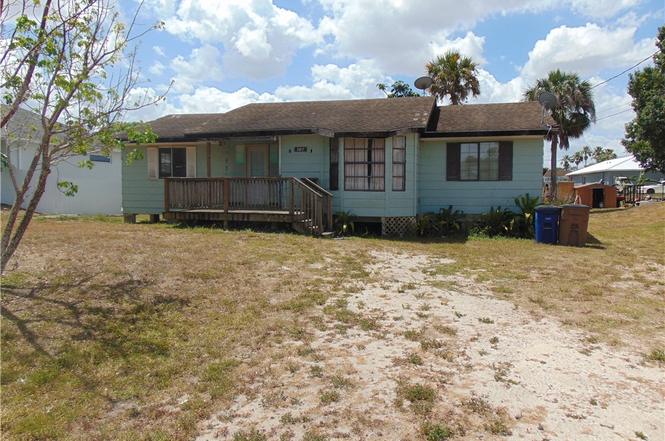
2917 13th St W · Lehigh Acres, FL
Flood risk 4/10 · Minor
- FEMA flood zone
- X (unshaded)
- Chance of flooding over 30 yrs
- 0.22%
- Est. flood insurance / yr
- $507 – $1,088
Fire risk 3/10 · Minor
- Est. fire insurance / yr
- $947 – $1,759
Heat risk 10/10 · Severe
- Hot days now (above 107°F)
- 7 days/yr
- Hot days in 30 yrs
- 28 days/yr
Wind risk 10/10 · Severe
- Chance of severe wind over 30 yrs
- 99.0%
Air-quality risk 2/10 · Minimal
- Unhealthy air days now
- 1 days/yr
- Unhealthy air days in 30 yrs
- 1 days/yr
Risk factors via First Street. Map © Google.
Why this score? — see what drove the B- grade
The composite is a weighted blend of 9 inputs, each scored 0–100. Each bar is that input's sub-score; the figure is the points it added to the 100-point composite (weight × sub-score).
- Cash flow +30.0/30.0
- 1% rule +10.0/10.0
- DSCR +10.0/10.0
- ARV discount +7.5/15.0
- Schools +4.1/10.0
- Livability +3.0/5.0
- Condition / age +2.5/5.0
- Rent growth +1.3/5.0
- Appreciation +0.0/10.0
$109,900
🖨 Deal sheet 📄 Offer letter ✓ Due diligence
Listing remarks MLS
ATTENTION INVESTORS: If you're looking for a fixer-upper, here it is!
Key facts
- Central air and heat
- Growing area
- 0.25 acre lot
Tags
Property features AI
Finance
- Financial info: Pets allowed
- HOA & community: Non-gated community; No association fee listed
Exterior
- Utilities: Cable available; Septic tank; Well water
- Home design: Single-story residence; Entry level: 1; Faces north; Resale property
- Construction: Wood siding and wood frame construction; Shingle roof
- Exterior features: No notable exterior features listed; Rectangular lot; Public maintained paved road; South exposure
Interior
- Kitchen: Range; Refrigerator
- Bedrooms: Other room types listed
- Flooring: Vinyl flooring
- Bathrooms: 2 full bathrooms
- Heating & cooling: Central heating (electric); Central air conditioning (electric)
- Interior features: Sliding windows; Living/dining room; Other interior features (see remarks); Unfurnished
Neighborhood map
What this means for you Summary
Snapshot
- This is a 4-bed/2.0-bath single-family listed at $110k.
Deal economics
- At list price, monthly cash flow is $825 ($10k/yr) — positive.
- The deal already cash-flows at list — no discount required.
- Meets the 1% rule at list price ($2k rent vs $110k).
- Recommended offer: $97k (12.0% below list) — sets the bar for market timing.
- Cap rate 15.3% vs local median 4.7% in Lehigh Acres — top-decile yield for the area; either an underpriced asset or a hidden risk that comps aren't pricing in. Stress-test before assuming the spread holds.
Location & tenants
- Location reads 59/100 on livability (#826 in FL) — a working-class tenant base; expect higher turnover. Strengths: cost of living A+, housing A+; Watch: crime C-, employment D+, schools D-.
- Lee (suburban): math 47% / reading 50% proficiency, ranked #42 of 73 in FL (top 58%) — families likely to look elsewhere, expect single-tenant / working-renter base with shorter leases.
- Market conditions: Rents falling (-4.7%/yr); 1335 active listings in the ZIP; 20 comparable units currently listed for rent nearby; rentals at typical pace (median 22d on market — plan ~3-4 weeks tenant-placement turnaround); solid renter incomes; 15,411 units permitted in Lee County in 2024 (4,686 in 5+ unit buildings).
- This rent runs 32% of the median local income ($78k/yr) — at the standard rent-burdened threshold; future hikes will face affordability resistance.
Forward outlook
- Local home prices are declining (-3.0%/yr); year-one equity from $760 of loan paydown is wiped out by about $3k of value loss. Plan a longer hold.
- Lee County population projected at +44% by 2050 — long-run rental-demand tailwind backs the buy-and-hold thesis.
- At projected returns (-3.0% appreciation + 0.0% rent growth), your $31k cash investment doubles in ~5 years — after that, you're playing with house money.
Negotiation context
- It's been on market 405 days — a 12% lower offer ($97k) is reasonable based on typical stale-listing flexibility.
- 2 sale attempts since 18y ago; this cycle's ask has dropped $70k (39%) from the opening price — seller is motivated, your offer sets the floor, not the list.
- Current owner paid $27k; list at $110k implies a 307% gain — meaningful room to come down on a strong offer.
Risks & watch-outs
- Climate carrying-cost: severe wind risk, 99% chance of damaging wind over 30y; extreme-heat days projected 7→28/yr by 2055 (HVAC capex compounding) — expect insurance premiums to compound above CPI over the hold.
Questions for the listing agent
- It's been on market 405 days. Have you received any prior offers? Is the seller open to a 12% concession, seller financing, or rate buy-down credit?
- Why hasn't it sold? Are there any deal-killer items the seller is aware of (foundation, flood, title, zoning, code violations)?
- Is there a deadline driving the sale (1031 exchange, divorce, estate, relocation)? That informs how much negotiation room exists.
- Schools are D-rated, which usually means shorter tenancies and higher turnover. Who's the typical renter profile here, and what's been the actual vacancy rate?
- What's the average days-on-market for RENTAL listings here right now (not sales)? A rising rental-DOM trend means longer vacancies and softer asking-rent achievability than the comps imply.
- What's the recent tenant-quality profile in this submarket — average credit score on applications, eviction rate, late-payment / NSF rate, and stable-employment percentage? A property-management company in the area should have these aggregated.
- How much new for-sale + rental construction is in the pipeline within 1–3 miles? Heavy new supply typically softens prices + rents 12–24 months out; constrained supply supports both.
Investment metrics
- 1% rule
- 1.90% ✓
- Cap rate
- 15.30%
- Cash-on-cash
- 32.16%
- DSCR
- 2.43
- GRM
- 4.4
CMA / ARV
- ARV (on-the-fly)
- $257,906
- Comps found
- 9
Show comp detail 9 sales within ~0.75 mi
| Address | Dist | Beds/Ba | Sqft | Sold | Price | $/sf | Match |
|---|---|---|---|---|---|---|---|
| 3206 12th St W | 0.36mi | 3/2.0 (-1) | 1,214 (-2%) | 2mo | $250,000 | $206 | 74 |
| 2912 11th St W | 0.10mi | 3/2.0 (-1) | 1,134 (-8%) | 14mo | $142,000 | $125 | 66 |
| 2817 8th St W | 0.35mi | 3/2.5 (-1) | 1,345 (+9%) | 2mo | $280,000 | $208 | 60 |
| 2811 6th St W | 0.48mi | 3/2.0 (-1) | 1,228 (-0%) | 19mo | $260,000 | $212 | 56 |
| 3111 11th St W | 0.31mi | 3/2.5 (-1) | 1,345 (+9%) | 10mo | $305,000 | $227 | 55 |
| 2918 21st St W | 0.57mi | 3/2.0 (-1) | 1,317 (+7%) | 5mo | $250,000 | $190 | 53 |
| 3301 8th St SW | 0.53mi | 4/2.0 | 1,336 (+8%) | 10mo | $339,900 | $254 | 53 |
| 3216 17th St W | 0.54mi | 3/2.0 (-1) | 1,400 (+14%) | 4mo | $293,000 | $209 | 45 |
| 3315 12th St W | 0.54mi | 3/3.0 (-1) | 1,054 (-15%) | 3mo | $280,000 | $266 | 39 |
Match score weights: distance 35% · size 25% · config 20% · recency 20%. Top-matched comps best support the ARV.
Projected returns pro-forma
-3.0% appreciation · 0.0% rent growth · sell at horizon
- IRR
- 23.6%
- Equity multiple
- 1.93×
- Total profit
- $28,661
- Equity at exit
- $16,386
- IRR
- 29.5%
- Equity multiple
- 3.25×
- Total profit
- $69,216
- Equity at exit
- $9,502
Cash invested: $30,772 (down + closing). Projections, not guarantees.
Landlord ↔ Tenant lean methodology
- Overall (STATE)
- 87 Strongly Landlord-Friendly
- State Florida
- 87 Strongly Landlord-Friendly · R+3
- County
- — inherits STATE
- City
- — inherits STATE
ZIP-level market 33971
- Home prices YoY
- -8.0%
- Rents YoY
- -4.7%
- Active inventory
- 1335
- Price-to-rent
- 4.4×
Monthly cashflow live
- Estimated rent
- $2,089 high interval (Pro) →
- Mortgage (P&I)
- −$576
- Tax from tax record
- −$204 /mo · $2,447/yr
- Insurance
- −$46
- HOA
- −$0
- Vacancy / Maint / Mgmt
- −$439
- Net cashflow
- $825
Break-even live
UW: 25.0% down · 7.5% · 30yr · 1.5% tax · 5.0% vac · 8.0% maint · 8.0% mgmt
Financing live
Cash to close
- Down payment
- $27,475
- Closing costs
- $3,297
- Reserves months
- —
- Total cash needed
- —
Loan-product check · same deal, 3 products live
Conventional
25% down · 7.5% · 30yr
- Down + closing
- —
- Monthly P&I
- —
- Monthly cashflow
- —
- DSCR
- —
- Eligible?
- —
Personal DTI + credit; lowest rate.
DSCR
20% down · 8.5% · 30yr
- Down + closing
- —
- Monthly P&I
- —
- Monthly cashflow
- —
- DSCR
- —
- Eligible?
- —
No personal income docs; deal must DSCR.
Hard money
10% down · 12.0% · 12mo
- Down + closing
- —
- Monthly P&I
- —
- Monthly cashflow
- —
- DSCR
- —
- Eligible?
- —
Short-term bridge; refi at stabilization.
Rent comps 20 comps
| Address | Beds | Baths | Sqft | Rent | $/sqft | DOM | Units | Dist |
|---|---|---|---|---|---|---|---|---|
| 2916 9th St W Lehigh Acres, FL | 3.0 | 2.0 | 1053 | $1,750 | $1.66 | 23d | 1 | 0.21mi |
| 2918 16th St Lehigh Acres, FL | 3.0 | 2.0 | 1324 | $1,845 | $1.39 | 21d | 1 | 0.23mi |
| 3109 10th St W Lehigh Acres, FL | 3.0 | 2.0 | 1472 | $1,950 | $1.32 | 23d | 1 | 0.35mi |
| 3109 8th St SW Lehigh Acres, FL | 3.0 | 2.0 | 1324 | $1,845 | $1.39 | 21d | 1 | 0.43mi |
| 3208 9th St W Lehigh Acres, FL | 3.0 | 2.0 | 1423 | $1,916 | $1.35 | 3d | 1 | 0.45mi |
| 3310 11th St W Lehigh Acres, FL | 3.0 | 2.5 | 1354 | $2,000 | $1.48 | 3d | 1 | 0.54mi |
| 3312 11th St W Lehigh Acres, FL | 3.0 | 2.5 | 1354 | $2,000 | $1.48 | 3d | 1 | 0.55mi |
| 3310 9th St W Lehigh Acres, FL | 3.0 | 2.0 | 1488 | $2,300 | $1.55 | 16d | 1 | 0.57mi |
| 2612 7th St W Lehigh Acres, FL | 3.0 | 2.0 | 1492 | $2,295 | $1.54 | 23d | 1 | 0.61mi |
| 3016 25th St W Lehigh Acres, FL | 3.0 | 2.0 | 1100 | $1,555 | $1.41 | 23d | 1 | 0.83mi |
| 2513 22nd St W Lehigh Acres, FL | 4.0 | 2.0 | 1389 | $1,750 | $1.26 | 21d | 1 | 0.87mi |
| 2513 22nd St W Lehigh Acres, FL | 4.0 | 2.0 | 1389 | $1,750 | $1.26 | 14d | 1 | 0.87mi |
| 911 Sally Ave N Lehigh Acres, FL | 3.0 | 2.0 | 1144 | $1,521 | $1.33 | 3d | 1 | 0.89mi |
| 3405 4th St W Lehigh Acres, FL | 3.0 | 2.0 | 1184 | $1,715 | $1.45 | 14d | 1 | 0.99mi |
| 8350 Tortoise Isle Ct Lehigh Acres, FL | 3.0 | 2.0 | 1478 | $1,595 | $1.08 | 3d | 1 | 1.05mi |
| 3309 2nd St SW Lehigh Acres, FL | 3.0 | 2.0 | 984 | $1,495 | $1.52 | 23d | 1 | 1.15mi |
| 2916 7th St SW Lehigh Acres, FL | 3.0 | 2.0 | 1357 | $1,900 | $1.40 | 23d | 1 | 1.24mi |
| 3508 3rd St SW Lehigh Acres, FL | 3.0 | 2.0 | 1147 | $1,699 | $1.48 | 3d | 1 | 1.37mi |
| 3315 7th St SW Lehigh Acres, FL | 3.0 | 2.0 | 1212 | $1,950 | $1.61 | 23d | 1 | 1.44mi |
| 3731 15th St W Lehigh Acres, FL | 3.0 | 2.0 | 1406 | $1,670 | $1.19 | 3d | 1 | 1.49mi |
Listing history 26 events
-
2026-06-17days on market $109,900 Active 405 DOM
-
2026-06-16days on market $109,900 Active 404 DOM
-
2026-06-16pricedays on market $109,900 Active 403 DOM
-
2026-06-13days on market $119,900 Active 401 DOM
-
2026-06-09days on market $119,900 Active 397 DOM
-
2026-06-07days on market $119,900 Active 395 DOM
-
2026-06-02days on market $119,900 Active 390 DOM
-
2026-06-01days on market $119,900 Active 389 DOM
-
2026-06-01days on market $119,900 Active 388 DOM
-
2026-05-13price $119,900
-
2026-03-20price $129,900
-
2026-02-24price $139,900
-
2026-02-06price $144,900
-
2025-09-17price $147,900
-
2025-08-09price $149,900
-
2025-06-27price $159,900
-
2025-06-03price $169,900
-
2025-05-08$179,900 Active
-
2009-02-20soldstatus $27,000 69-char remark
Show marketing remark (69 chars)
ATTENTION INVESTORS: If you're looking for a fixer-upper, here it is!
-
2009-01-20price $29,900 69-char remark
Show marketing remark (69 chars)
ATTENTION INVESTORS: If you're looking for a fixer-upper, here it is!
-
2008-12-22historical
-
2008-10-24$49,900
-
2005-12-13soldstatus $165,000
-
1999-06-22soldstatus $68,000
-
1999-06-22soldstatus $68,000
-
1988-11-01soldstatus $33,100
ⓘ Source: listings_history table (triggers on properties + properties_extension) + one-shot
backfill from property_details.listing_events for pre-trigger history.
Tax reassessment forecast FL · Resets to sale price
- Current annual tax
- $2,447 · $204/mo
- Projected year-2 tax
- $2,447 · $204/mo
- Expected delta
- $0/yr ($0/mo · 0.0%)
ⓘ Screening estimate from a state-policy table — verify with the county assessor before closing.
Climate risk First Street
- Flood 4/10 Moderate FEMA zone X (unshaded) · 22% chance over 30 yrs
- Wildfire 3/10 Moderate
- Heat 10/10 Extreme 7 d/yr ≥107°F today · 28 d/yr by 30 yrs out
- Wind 10/10 Extreme 99% chance of damaging wind over 30 yrs
- Air quality 2/10 Low 1 unhealthy d/yr today · 1 by 30 yrs out
Nearby sold comps map
Loading sold comps map…
Walkable amenities ~0.75 mi
Loading nearby amenities…
Taxation est. · year 1
- Rental income
- $25,073
- − Mortgage interest
- −$6,156
- − Property taxes
- −$2,447
- − Insurance
- −$550
- − Repairs & maintenance
- −$2,006
- − Management
- −$2,006
- − Depreciation
- −$3,197
- Taxable income
- $8,712
- Est. tax owed @ 24.0%
- −$2,091
- After-tax cash flow
- $7,805/yr
For passive investors: Depreciation is non-cash, so a rental often shows a tax loss while cash-flowing — sheltering income. Rental losses are passive: they offset passive income freely, and up to $25,000/yr can offset ordinary (W-2) income if you actively participate and your MAGI is under $100k (phasing out to $0 by $150k); unused losses carry forward. On sale, claimed depreciation is recaptured at up to 25%, and gains may owe capital-gains tax (a 1031 exchange can defer both). Figures are a year-1 estimate at your 24.0% rate — not tax advice; consult a CPA.
Schools (NCES district)
- District
- Lee
- NCES district ID
- 1201080
- Math proficiency
- 47% ▼ -11.00%
- Reading proficiency
- 50% ▼ -4.00%
- Median HH income
- $49,518
- Composite
- 41.49/100
- National rank
- #3458
- State rank
- #42 of 73 in FL
Livability — Lehigh Acres
- Score
- 59/100
- State rank
- #826
- US rank
- #20055
Category grades
Schools grade is shown separately in the Schools card above.
Census & demographics
- Census place
- Lehigh Acres, FL
- County
- Lee County · 788,662 people
- City population
- 130,638
- Metro
- Cape Coral-Fort Myers, FL
- Population (ZIP)
- 30,790
- Household income
- $77,723
- Rent vs Own
- Severe rent burden
- 587.0
Population outlook (Lee County) Hauer SSP2
- Today (2025)
- 871,946 people
- By 2030
- 955,468 · +9.6%
- By 2040
- 1,113,587 · +27.7%
- By 2050
- 1,256,891 · +44.1%
- By 2075
- 1,560,270 · +78.9%
- By 2100
- 1,726,848 · +98.0%
Race, ethnicity, and origin ACS 2023
- Neighborhood character
- Diverse neighborhood (Simpson 0.65)
- Race & ethnicity
- Hispanic / Latino 49% Two or more races 32% White 26% Black 19% Asian 2%
- Hispanic origin (detail)
- Mexican 9% Puerto Rican 13% Cuban 14% Dominican 2%
- Common ancestry
- Hispanic 7% Estonian 1% Romanian 1%
- Foreign-born
- 31% · Canada, Vietnam, Guatemala
- Languages at home
- 46% English-only · Spanish 41% French/Haitian/Cajun 9% Other Indo-European 2%
Political lean MEDSL · Lee
- 2024 margin
- Strong R (+28.4) · D 35.5% · R 63.9%
- 2008→2024 swing
- -18.0pp toward R · 2008: -10.4pp · 2024: -28.4pp
- All cycles
- 2024: R+28.4 2020: R+19.2 2016: R+20.4 2012: R+16.6 2008: R+10.4
Not yet ingested
- Civics
- —
Market trends
- HPI YoY
- ▼ -27.68%
- Current HPI
- 317.7147
- Rent YoY
- ▼ -4.69%
- Metro
- Cape Coral-Fort Myers, FL
- State GDP YoY
- ▲ 3.28%
- F500 in state
- 36
Industry mix (Fortune 500 HQ in FL)
| Industry | F500 HQs | Revenue |
|---|---|---|
| Industrial Technology | 2 | $29B |
|
||
| Insurance | 2 | $17B |
|
||
| Retail | 1 | $60B |
|
||
| Technology Distribution | 1 | $58B |
|
||
| Homebuilding | 1 | $35B |
|
||
| Technology Manufacturing | 1 | $35B |
|
||
Price history
+262.2% since first listed17 events — show timeline
- 2026-05-13 Price Changed $119,900 FORTMLS
- 2026-03-20 Price Changed $129,900 FORTMLS
- 2026-02-24 Price Changed $139,900 FORTMLS
- 2026-02-06 Price Changed $144,900 FORTMLS
- 2025-09-17 Price Changed $147,900 FORTMLS
- 2025-08-09 Price Changed $149,900 FORTMLS
- 2025-06-27 Price Changed $159,900 FORTMLS
- 2025-06-03 Price Changed $169,900 FORTMLS
- 2025-05-08 Listed $179,900 FORTMLS
- 2009-02-20 Sold (MLS) $27,000 FORTMLS
- 2009-01-20 Price Changed $29,900 FORTMLS
- 2008-12-22 Listing Removed — FORTMLS
- 2008-10-24 Listed $49,900 FORTMLS
- 2005-12-13 Sold (Public Records) $165,000 Public Records
- 1999-06-22 Sold (Public Records) $68,000 Public Records
- 1999-06-22 Sold (Public Records) $68,000 Public Records
- 1988-11-01 Sold (Public Records) $33,100 Public Records
Property tax history
+8.9%/yrLatest (2025): $2,447 · -1.9% YoY. Source: county tax records.
Cash-flow waterfall
monthlySold comps — $/sqft
last 12 mo · ≤1 miLoading sold comps…