3411 S Camino Seco -- #271 · Tucson, AZ
Flood risk 1/10 · Minimal
- FEMA flood zone
- X (unshaded)
- Chance of flooding over 30 yrs
- 0.0%
- Est. flood insurance / yr
- $507 – $1,088
Fire risk 5/10 · Moderate
- Est. fire insurance / yr
- $610 – $1,132
Heat risk 7/10 · Major
- Hot days now (above 104°F)
- 6 days/yr
- Hot days in 30 yrs
- 15 days/yr
Wind risk 1/10 · Minimal
- Chance of severe wind over 30 yrs
- —
Air-quality risk 1/10 · Minimal
- Unhealthy air days now
- 0 days/yr
- Unhealthy air days in 30 yrs
- 0 days/yr
Risk factors via First Street. Map © Google.
Why this score? — see what drove the C+ grade
The composite is a weighted blend of 9 inputs, each scored 0–100. Each bar is that input's sub-score; the figure is the points it added to the 100-point composite (weight × sub-score).
- Cash flow +23.8/30.0
- ARV discount +12.5/15.0
- 1% rule +10.0/10.0
- DSCR +7.7/10.0
- Livability +3.7/5.0
- Rent growth +2.5/5.0
- Condition / age +2.2/5.0
- Schools +1.6/10.0
- Appreciation +0.0/10.0
$120,000
🖨 Deal sheet 📄 Offer letter ✓ Due diligence
Listing remarks MLS
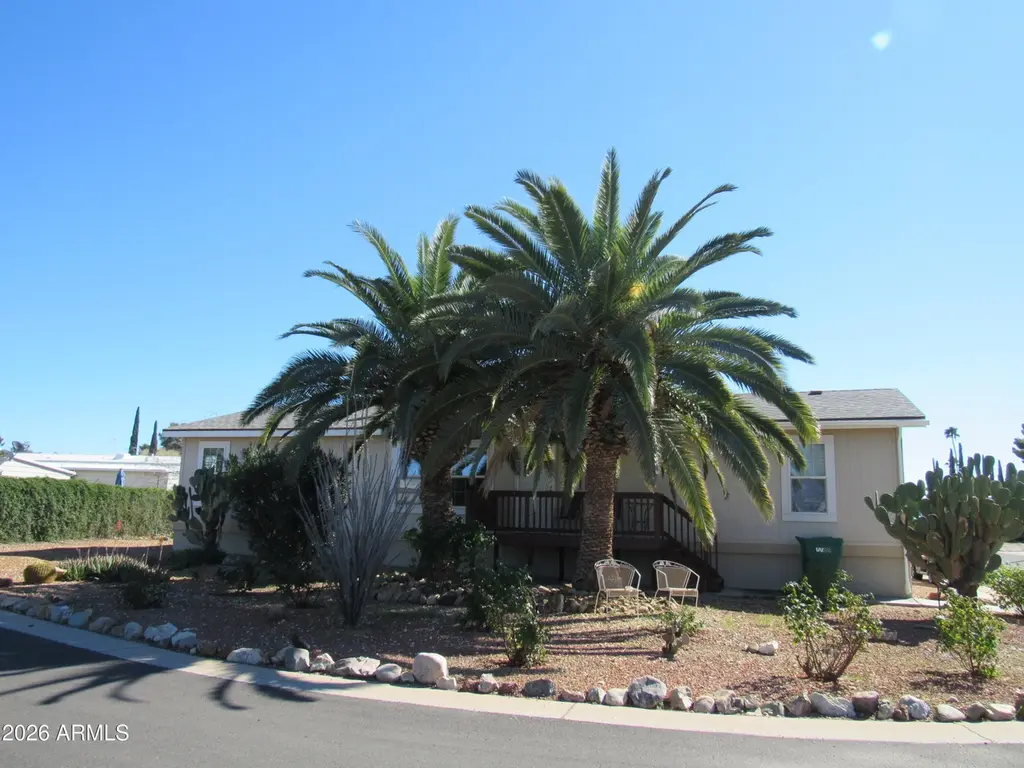
Palm Trees. Rose Bushes. Ornamental plantings on an extra large lot. Covered front porch. Electric fireplace in living area, along with large windows, all add up to an open-concept beauty of a home with 4 bedrooms surrounding living room kitchen combination Kitchen has a center island for added counter space and storage and a separate dining area. The home has wide doorways for easy access. Walk-in closets throughout. Double sinks and large soaking tub in primary bath off northeast corner bedroom. Second bath has tub and shower. Three more large bedrooms are at the western portion of the home. 12 foot ceilings throughout. Back porch has a ramp to help outside access. All furnishing available!
Key facts
- Covered front porch
- Walk-in closets
- Extra large lot
Tags
Neighborhood map
What this means for you Summary
Snapshot
- This is a 4-bed/2.0-bath manufactured listed at $120k. Condition is rated fair.
Deal economics
- At list price, monthly cash flow is $231 ($3k/yr) — positive.
- The deal already cash-flows at list — no discount required.
- Meets the 1% rule at list price ($2k rent vs $120k).
- Recommended offer: $109k (9.0% below list) — sets the bar for market timing.
- Cap rate 8.6% vs local median 3.7% in Tucson — top-decile yield for the area; either an underpriced asset or a hidden risk that comps aren't pricing in. Stress-test before assuming the spread holds.
Location & tenants
- Location reads 74/100 on livability (#17 in AZ, #4,502 nationally) — a middle-class / working-renter tenant base. Strengths: commute A+, cost of living A+, housing A+; Watch: health & safety C-, schools D+, crime F.
- Tucson Unified District (4403) (urban): math 14% / reading 23% proficiency, ranked #190 of 249 in AZ (top 76%) — low school quality limits family demand, transient renter base, plan for 1-2y turnover.
- Market conditions: Rents soft (-0.2%/yr); 194 active listings in the ZIP; 2 comparable units currently listed for rent nearby; 5,268 units permitted in Pima County in 2024 (996 in 5+ unit buildings).
- This rent runs 44% of the median local income ($62k/yr) — at the standard rent-burdened threshold; future hikes will face affordability resistance.
Forward outlook
- Local home prices are declining (-3.0%/yr); year-one equity from $830 of loan paydown is wiped out by about $4k of value loss. Plan a longer hold.
- Pima County population projected at +8% by 2050 — modest demand growth; plan on rents tracking national, not racing it.
Negotiation context
- It's been on market 106 days — a 9% lower offer ($109k) is reasonable based on typical stale-listing flexibility.
Risks & watch-outs
- Watch-outs: HOA is 33% of rent.
- Climate carrying-cost: moderate wildfire risk; extreme-heat days projected 6→15/yr by 2055 (HVAC capex compounding) — expect insurance premiums to compound above CPI over the hold.
Questions for the listing agent
- It's been on market 106 days. Have you received any prior offers? Is the seller open to a 9% concession, seller financing, or rate buy-down credit?
- Have any recent inspections been done? Can we get a copy of the seller's disclosures and any deferred-maintenance estimates?
- What does the HOA fee cover, when was the last increase, and are there any pending special assessments or reserve-fund shortfalls?
- Why hasn't it sold? Are there any deal-killer items the seller is aware of (foundation, flood, title, zoning, code violations)?
- Is there a deadline driving the sale (1031 exchange, divorce, estate, relocation)? That informs how much negotiation room exists.
- Schools are D-rated, which usually means shorter tenancies and higher turnover. Who's the typical renter profile here, and what's been the actual vacancy rate?
- Crime grade is F in this area — have there been break-ins, vandalism, or insurance claims at this property in the last 3 years? What carrier currently insures it and at what premium?
- What's the average days-on-market for RENTAL listings here right now (not sales)? A rising rental-DOM trend means longer vacancies and softer asking-rent achievability than the comps imply.
- What's the recent tenant-quality profile in this submarket — average credit score on applications, eviction rate, late-payment / NSF rate, and stable-employment percentage? A property-management company in the area should have these aggregated.
- How much new for-sale + rental construction is in the pipeline within 1–3 miles? Heavy new supply typically softens prices + rents 12–24 months out; constrained supply supports both.
Investment metrics
- 1% rule
- 1.91% ✓
- Cap rate
- 8.61%
- Cash-on-cash
- 8.26%
- DSCR
- 1.37
- GRM
- 4.4
CMA / ARV
- ARV (median comp)
- $135,000
- List price
- $120,000
- Delta
- -11.11%
- Verdict
- UNDERPRICED
- Comps
- 1 within 2.0 mi
Projected returns pro-forma
-3.0% appreciation · 0.0% rent growth · sell at horizon
- IRR
- -9.4%
- Equity multiple
- 0.67×
- Total profit
- $-10,937
- Equity at exit
- $17,892
- IRR
- -9.1%
- Equity multiple
- 0.57×
- Total profit
- $-14,493
- Equity at exit
- $10,375
Cash invested: $33,600 (down + closing). Projections, not guarantees.
Landlord ↔ Tenant lean methodology
- Overall (STATE)
- 87 Strongly Landlord-Friendly
- State Arizona
- 87 Strongly Landlord-Friendly · R+3
- County
- — inherits STATE
- City
- — inherits STATE
ZIP-level market 85730
- Home prices YoY
- -30.9%
- Rents YoY
- -0.2%
- Active inventory
- 194
- Price-to-rent
- 4.4×
Monthly cashflow live
- Estimated rent
- $2,291 medium interval (Pro) →
- Mortgage (P&I)
- −$629
- Tax est. 1.5%
- −$150 /mo · $1,800/yr
- Insurance
- −$50
- HOA
- −$749
- Vacancy / Maint / Mgmt
- −$481
- Net cashflow
- $231
Break-even live
UW: 25.0% down · 7.5% · 30yr · 1.5% tax · 5.0% vac · 8.0% maint · 8.0% mgmt
Financing live
Cash to close
- Down payment
- $30,000
- Closing costs
- $3,600
- Reserves months
- —
- Total cash needed
- —
Loan-product check · same deal, 3 products live
Conventional
25% down · 7.5% · 30yr
- Down + closing
- —
- Monthly P&I
- —
- Monthly cashflow
- —
- DSCR
- —
- Eligible?
- —
Personal DTI + credit; lowest rate.
DSCR
20% down · 8.5% · 30yr
- Down + closing
- —
- Monthly P&I
- —
- Monthly cashflow
- —
- DSCR
- —
- Eligible?
- —
No personal income docs; deal must DSCR.
Hard money
10% down · 12.0% · 12mo
- Down + closing
- —
- Monthly P&I
- —
- Monthly cashflow
- —
- DSCR
- —
- Eligible?
- —
Short-term bridge; refi at stabilization.
Rent comps 2 comps
| Address | Beds | Baths | Sqft | Rent | $/sqft | DOM | Units | Dist |
|---|---|---|---|---|---|---|---|---|
| 8905 E Pantano Bluff Dr Tucson, AZ | 3.0 | 2.0 | 2013 | $1,950 | $0.97 | 3d | 1 | 0.78mi |
| 8854 E Stone Meadow Cir Tucson, AZ | 4.0 | 2.0 | 2591 | $2,500 | $0.96 | 44d | 1 | 0.83mi |
HOA detail
- Monthly dues
- $749 · $8,988/yr
- Likely covers
- electric
Listing history 15 events
-
2026-06-18days on market $120,000 Active 106 DOM
-
2026-06-17days on market $120,000 Active 105 DOM
-
2026-06-16days on market $120,000 Active 104 DOM
-
2026-06-15days on market $120,000 Active 103 DOM
-
2026-06-13days on market $120,000 Active 101 DOM
-
2026-06-10days on market $120,000 Active 98 DOM
-
2026-06-09days on market $120,000 Active 97 DOM
-
2026-06-08days on market $120,000 Active 96 DOM
-
2026-06-07days on market $120,000 Active 95 DOM
-
2026-06-05days on market $120,000 Active 92 DOM
-
2026-06-03days on market $120,000 Active 91 DOM
-
2026-06-02days on market $120,000 Active 90 DOM
-
2026-06-01days on market $120,000 Active 89 DOM
-
2026-05-31days on market $120,000 Active 88 DOM
-
2026-03-02$120,000 Active 715-char remark
Show marketing remark (715 chars)
Palm Trees. Rose Bushes. Ornamental plantings on an extra large lot. Covered front porch. Electric fireplace in living area, along with large windows, all add up to an open-concept beauty of a home with 4 bedrooms surrounding living room kitchen combination Kitchen has a center island for added counter space and storage and a separate dining area. The home has wide doorways for easy access. Walk-in closets throughout. Double sinks and large soaking tub in primary bath off northeast corner bedroom. Second bath has tub and shower. Three more large bedrooms are at the western portion of the home. 12 foot ceilings throughout. Back porch has a ramp to help outside access. All furnishing available!
ⓘ Source: listings_history table (triggers on properties + properties_extension) + one-shot
backfill from property_details.listing_events for pre-trigger history.
Climate risk First Street
- Flood 1/10 Low FEMA zone X (unshaded) · 0% chance over 30 yrs
- Wildfire 5/10 Major
- Heat 7/10 Severe 6 d/yr ≥104°F today · 15 d/yr by 30 yrs out
- Wind 1/10 Low
- Air quality 1/10 Low 0 unhealthy d/yr today · 0 by 30 yrs out
Nearby sold comps map
Loading sold comps map…
Walkable amenities ~0.75 mi
Loading nearby amenities…
Taxation est. · year 1
- Rental income
- $27,486
- − Mortgage interest
- −$6,722
- − Property taxes
- −$1,800
- − Insurance
- −$600
- − Repairs & maintenance
- −$2,199
- − Management
- −$2,199
- − HOA
- −$8,988
- − Depreciation
- −$3,491
- Taxable income
- $1,488
- Est. tax owed @ 24.0%
- −$357
- After-tax cash flow
- $2,418/yr
For passive investors: Depreciation is non-cash, so a rental often shows a tax loss while cash-flowing — sheltering income. Rental losses are passive: they offset passive income freely, and up to $25,000/yr can offset ordinary (W-2) income if you actively participate and your MAGI is under $100k (phasing out to $0 by $150k); unused losses carry forward. On sale, claimed depreciation is recaptured at up to 25%, and gains may owe capital-gains tax (a 1031 exchange can defer both). Figures are a year-1 estimate at your 24.0% rate — not tax advice; consult a CPA.
Condition & rehab AI · 12 photos
This manufactured home requires moderate repairs to its exterior and siding, along with some interior updates to increase its resale and rental value.
Repairs flagged
- Major siding — Significant wear and tear
- Major exterior paint — Visible peeling and discoloration
Value-add opportunities
- Both Paint exterior and replace siding — Enhances curb appeal and value
- Both Replace carpet with hardwood or tile — Improves aesthetics and value
- Both Replace outdated kitchen cabinets and appliances — Modernizes the space and increases value
Renovation cost estimate screening
| Repair item | Severity | Est. cost |
|---|---|---|
| siding · Significant wear and tear | Major | $15,000–50,000 |
| exterior paint · Visible peeling and discoloration | Major | $15,000–50,000 |
| Total estimated repair cost · 2 items | $30,000–100,000 |
Value-add ROI direction
- Both Paint exterior and replace siding — Enhances curb appeal and value ↑
- Both Replace carpet with hardwood or tile — Improves aesthetics and value ↑
- Both Replace outdated kitchen cabinets and appliances — Modernizes the space and increases value ↑
ⓘ Cost ranges are severity-bucket heuristics (US national rule-of-thumb). Get contractor quotes + a written scope before underwriting a rehab budget.
Schools (NCES district)
- District
- Tucson Unified District (4403)
- NCES district ID
- 0408800
- Math proficiency
- 14% ▼ -17.00%
- Reading proficiency
- 23% ▼ -11.00%
- Median HH income
- $40,962
- Composite
- 15.78/100
- National rank
- #9270
- State rank
- #190 of 249 in AZ
Livability — Tucson
- Score
- 74/100
- State rank
- #17
- US rank
- #4502
Category grades
Schools grade is shown separately in the Schools card above.
Census & demographics
- Census place
- Tucson, AZ
- County
- Pima County · 1,012,107 people
- City population
- 839,336
- Metro
- Tucson, AZ
- Population (ZIP)
- 39,399
- Household income
- $62,090
- Rent vs Own
- Severe rent burden
- 1364.0
Population outlook (Pima County) Hauer SSP2
- Today (2025)
- 1,066,056 people
- By 2030
- 1,086,684 · +1.9%
- By 2040
- 1,117,160 · +4.8%
- By 2050
- 1,149,778 · +7.9%
- By 2075
- 1,271,480 · +19.3%
- By 2100
- 1,321,160 · +23.9%
Race, ethnicity, and origin ACS 2023
- Neighborhood character
- Diverse neighborhood (Simpson 0.62)
- Race & ethnicity
- White 53% Hispanic / Latino 31% Two or more races 16% Black 8% Asian 3% Native American 1%
- Hispanic origin (detail)
- Mexican 28%
- Common ancestry
- Romanian 2% Lithuanian 2% Slovak 2%
- Foreign-born
- 8% · Canada, Vietnam
- Languages at home
- 84% English-only · Spanish 13% Vietnamese 1%
Political lean MEDSL · Pima
- 2024 margin
- D (+15.2) · D 57.0% · R 41.8% · Other 1.2%
- 2008→2024 swing
- +9.1pp toward D · 2008: 6.1pp · 2024: 15.2pp
- All cycles
- 2024: D+15.2 2020: D+18.7 2016: D+13.5 2012: D+5.8 2008: D+6.1
Not yet ingested
- Civics
- —
Market trends
- HPI YoY
- ▼ -136.41%
- Current HPI
- 304.999
- Rent YoY
- ▼ -0.16%
- Metro
- Tucson, AZ
- State GDP YoY
- ▲ 4.54%
- F500 in state
- 20
Industry mix (Fortune 500 HQ in AZ)
| Industry | F500 HQs | Revenue |
|---|---|---|
| Technology | 2 | $13B |
|
||
| Mining / Metals | 1 | $23B |
|
||
| Environmental Services | 1 | $16B |
|
||
| Metals / Steel | 1 | $14B |
|
||
| Technology Distribution | 1 | $9B |
|
||
| Homebuilding | 1 | $8B |
|
||
Price history
1 event — show timeline
- 2026-03-02 Listed $120,000 ARMLS
Cash-flow waterfall
monthlySold comps — $/sqft
last 12 mo · ≤1 miLoading sold comps…