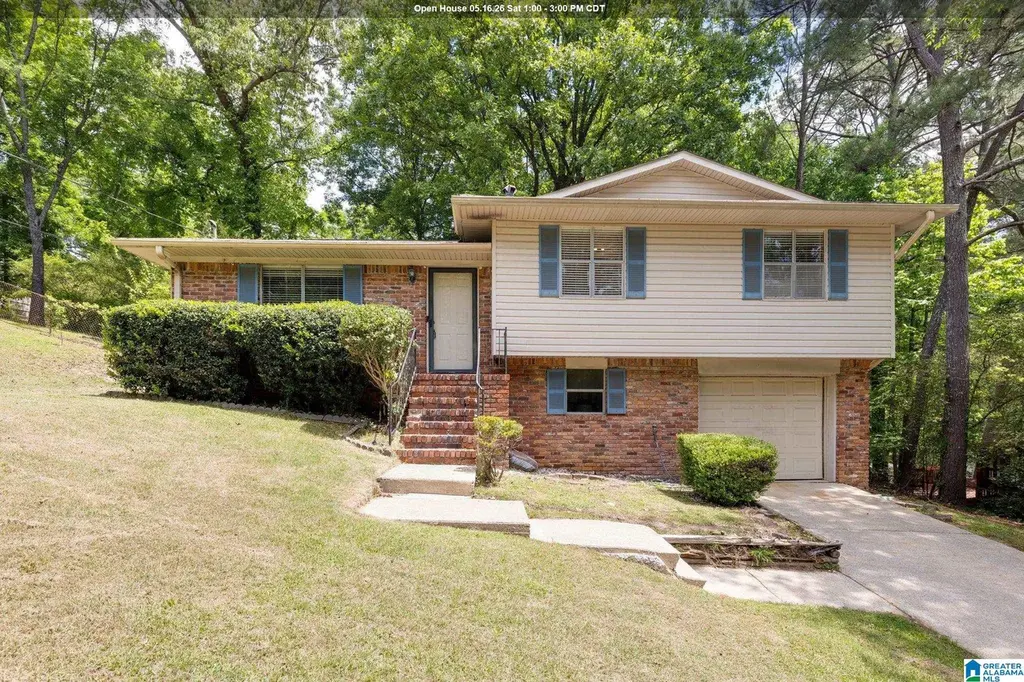
5009 Ewell Ln · Irondale, AL
Flood risk 1/10 · Minimal
- FEMA flood zone
- X (unshaded)
- Chance of flooding over 30 yrs
- 0.0%
- Est. flood insurance / yr
- $473 – $860
Fire risk 1/10 · Minimal
- Est. fire insurance / yr
- $916 – $1,700
Heat risk 6/10 · Moderate
- Hot days now (above 107°F)
- 7 days/yr
- Hot days in 30 yrs
- 19 days/yr
Wind risk 6/10 · Moderate
- Chance of severe wind over 30 yrs
- 27.0%
Air-quality risk 5/10 · Moderate
- Unhealthy air days now
- 8 days/yr
- Unhealthy air days in 30 yrs
- 10 days/yr
Risk factors via First Street. Map © Google.
Why this score? — see what drove the C- grade
The composite is a weighted blend of 9 inputs, each scored 0–100. Each bar is that input's sub-score; the figure is the points it added to the 100-point composite (weight × sub-score).
- Cash flow +18.9/30.0
- ARV discount +13.1/15.0
- DSCR +6.0/10.0
- 1% rule +4.0/10.0
- Livability +3.7/5.0
- Rent growth +3.5/5.0
- Condition / age +2.5/5.0
- Schools +1.8/10.0
- Appreciation +0.0/10.0
$240,900
🖨 Deal sheet 📄 Offer letter ✓ Due diligence
Listing remarks
Just reduced to $240,900 and move-in ready! This 3BR/2BA Irondale home puts you minutes from I-459, I-20, UAB, and downtown Birmingham at a price that is hard to argue with. The partially finished basement adds a flexible bonus room for an office, den, or guest space. Covered garage parking, a generous lot, and a washer and dryer that stay with the home. Whether you are a first-time buyer or looking to rightsize, the location does the heavy lifting and the new price makes it an easy yes. Schedule your showing today!
Key facts
- Garage
- Built 1972
- Listed 49 days
Property features AI
Finance
- Other: Property accessed via public road
- Financial info: Monthly garbage fee of $15
- HOA & community: No association fee
Exterior
- Parking: Attached garage with front entry; Basement parking; Driveway parking; One total garage space (located in basement)
- Utilities: Public water; Connected sewer; Gas water heater; Internet service available
- Home design: Existing residence; Basement entry/foundation; One-side brick and vinyl siding construction
- Construction: Basement foundation; Concrete block basement (both finished and unfinished)
- Exterior features: Open patio; Subdivision lot; No pool; No decks; No garden/patio; Not waterfront
Interior
- Kitchen: Eating area; Tile countertops in kitchen; Electric cooktop; Built-in dishwasher; Electric oven; Refrigerator; Some stainless appliances
- Bedrooms: Master bedroom on main level; Two additional bedrooms on main level; Den/Family room in basement
- Flooring: Carpet; Vinyl
- Bathrooms: Two full bathrooms with tub/shower combos
- Heating & cooling: Central heating; Central cooling
- Interior features: Security system; Smooth ceilings; Other ceiling details (see remarks); All window treatments remain
- Laundry & utility: Washer hookup; Electric dryer hookup; Laundry located in basement
Neighborhood map
What this means for you Summary
Snapshot
- This is a 3-bed/2.0-bath single-family listed at $241k.
Deal economics
- At list price, monthly cash flow is $249 ($3k/yr) — positive.
- The deal already cash-flows at list — no discount required.
- To meet the 1% rule (rent ≥ 1% of price), the offer needs to be $216k (10.2% below list).
- Recommended offer: $216k (10.2% below list) — sets the bar for 1% rule.
- Cap rate 7.5% vs local median 5.2% in Irondale — top-decile yield for the area; either an underpriced asset or a hidden risk that comps aren't pricing in. Stress-test before assuming the spread holds.
Location & tenants
- Location reads 74/100 on livability (#23 in AL, #4,921 nationally) — a middle-class / working-renter tenant base. Strengths: cost of living A+, housing A+, crime B+; Watch: employment C-, amenities F, health & safety F.
- Jefferson County (suburban): math 9% / reading 32% proficiency, ranked #104 of 129 in AL (top 81%) — low school quality limits family demand, transient renter base, plan for 1-2y turnover.
- Zoned schools: Irondale Community School (math 6% / reading 32%, grade F, #478 of 627 statewide, top 76%, 450 students, 50% FRL); Shades Valley High School (math 29% / reading 39%, grade F, #53 of 305 statewide, top 18%, 1,200 students, 68% FRL).
- Market conditions: Rents rising fast (+4.2%/yr); 81 active listings in the ZIP; 13 comparable units currently listed for rent nearby; rentals leasing fast (median 11d on market — plan ~1-2 weeks tenant-placement turnaround); 2,114 units permitted in Jefferson County in 2024 (556 in 5+ unit buildings).
- This rent runs 36% of the median local income ($73k/yr) — at the standard rent-burdened threshold; future hikes will face affordability resistance.
Forward outlook
- Local home prices are declining (-3.0%/yr); year-one equity from $2k of loan paydown is wiped out by about $7k of value loss. Plan a longer hold.
- Jefferson County population projected to shrink 4% by 2050 — rents likely to lag national; underwrite the cash flow, not the appreciation.
Negotiation context
- It's been on market 49 days — a 3% lower offer ($234k) is reasonable based on typical stale-listing flexibility.
- Current owner paid $112k; list at $241k implies a 114% gain — meaningful room to come down on a strong offer.
Risks & watch-outs
- Climate carrying-cost: major wind risk, 27% chance of damaging wind over 30y; extreme-heat days projected 7→19/yr by 2055 (HVAC capex compounding) — expect insurance premiums to compound above CPI over the hold.
Questions for the listing agent
- It's been on market 49 days. Have you received any prior offers? Is the seller open to a 10% concession, seller financing, or rate buy-down credit?
- Built in 1972 — when were the roof, HVAC, electrical panel, plumbing, and water heater last replaced?
- Is there a deadline driving the sale (1031 exchange, divorce, estate, relocation)? That informs how much negotiation room exists.
- Schools are D-rated, which usually means shorter tenancies and higher turnover. Who's the typical renter profile here, and what's been the actual vacancy rate?
- What's the average days-on-market for RENTAL listings here right now (not sales)? A rising rental-DOM trend means longer vacancies and softer asking-rent achievability than the comps imply.
- What's the recent tenant-quality profile in this submarket — average credit score on applications, eviction rate, late-payment / NSF rate, and stable-employment percentage? A property-management company in the area should have these aggregated.
- How much new for-sale + rental construction is in the pipeline within 1–3 miles? Heavy new supply typically softens prices + rents 12–24 months out; constrained supply supports both.
Investment metrics
- 1% rule
- 0.90% ✗
- Cap rate
- 7.53%
- Cash-on-cash
- 4.42%
- DSCR
- 1.20
- GRM
- 9.3
CMA / ARV
- ARV (median comp)
- $275,032
- List price
- $240,900
- Delta
- -12.41%
- Verdict
- UNDERPRICED
- Comps
- 20 within 1.0 mi
Show comp detail 12 sales within ~0.75 mi
| Address | Dist | Beds/Ba | Sqft | Sold | Price | $/sf | Match |
|---|---|---|---|---|---|---|---|
| 5004 Scenic View Dr | 0.19mi | 3/2.0 | 1,334 (-12%) | 2mo | $331,000 | $248 | 70 |
| 5008 Ewell Ln | 0.04mi | 4/3.0 (+1) | 1,688 (+12%) | 2mo | $260,000 | $154 | 68 |
| 201 Fern St | 0.39mi | 3/2.0 | 1,398 (-7%) | 3mo | $370,000 | $265 | 67 |
| 4769 Maryland Ave | 0.51mi | 3/2.0 | 1,405 (-7%) | 1mo | $405,000 | $288 | 64 |
| 317 Rosewood St | 0.66mi | 3/2.0 | 1,558 (+3%) | 1mo | $402,500 | $258 | 63 |
| 404 Rosewood St | 0.69mi | 3/2.0 | 1,451 (-4%) | 1mo | $439,000 | $303 | 60 |
| 4905 Pittman Ave | 0.52mi | 3/2.0 | 1,677 (+11%) | 2mo | $375,000 | $224 | 55 |
| 4837 Scenic View Dr | 0.27mi | 4/2.0 (+1) | 1,734 (+15%) | 3mo | $250,000 | $144 | 55 |
| 520 Bonnie Bell Ln | 0.66mi | 4/2.0 (+1) | 1,428 (-5%) | 1mo | $237,000 | $166 | 54 |
| 5144 Northumberland Rd | 0.63mi | 3/3.5 | 1,620 (+7%) | 2mo | $300,000 | $185 | 51 |
| 109 Alpine St | 0.66mi | 3/2.0 | 1,697 (+12%) | 1mo | $370,000 | $218 | 48 |
| 417 Redwood St | 0.72mi | 3/2.0 | 1,340 (-11%) | 2mo | $456,000 | $340 | 46 |
Match score weights: distance 35% · size 25% · config 20% · recency 20%. Top-matched comps best support the ARV.
Projected returns pro-forma
-3.0% appreciation · 4.18% rent growth · sell at horizon
- IRR
- -8.3%
- Equity multiple
- 0.69×
- Total profit
- $-20,691
- Equity at exit
- $35,919
- IRR
- 2.6%
- Equity multiple
- 1.19×
- Total profit
- $12,921
- Equity at exit
- $20,829
Cash invested: $67,452 (down + closing). Projections, not guarantees.
Landlord ↔ Tenant lean methodology
- Overall (STATE)
- 90 Strongly Landlord-Friendly
- State Alabama
- 90 Strongly Landlord-Friendly · R+15
- County
- — inherits STATE
- City
- — inherits STATE
ZIP-level market 35210
- Home prices YoY
- -32.2%
- Rents YoY
- 4.2%
- Active inventory
- 81
- Price-to-rent
- 9.3×
Monthly cashflow live
- Estimated rent
- $2,163 high interval (Pro) →
- Mortgage (P&I)
- −$1,263
- Tax from tax record
- −$96 /mo · $1,154/yr
- Insurance
- −$100
- HOA
- −$0
- Vacancy / Maint / Mgmt
- −$454
- Net cashflow
- $249
Break-even live
UW: 25.0% down · 7.5% · 30yr · 1.5% tax · 5.0% vac · 8.0% maint · 8.0% mgmt
Financing live
Cash to close
- Down payment
- $60,225
- Closing costs
- $7,227
- Reserves months
- —
- Total cash needed
- —
Loan-product check · same deal, 3 products live
Conventional
25% down · 7.5% · 30yr
- Down + closing
- —
- Monthly P&I
- —
- Monthly cashflow
- —
- DSCR
- —
- Eligible?
- —
Personal DTI + credit; lowest rate.
DSCR
20% down · 8.5% · 30yr
- Down + closing
- —
- Monthly P&I
- —
- Monthly cashflow
- —
- DSCR
- —
- Eligible?
- —
No personal income docs; deal must DSCR.
Hard money
10% down · 12.0% · 12mo
- Down + closing
- —
- Monthly P&I
- —
- Monthly cashflow
- —
- DSCR
- —
- Eligible?
- —
Short-term bridge; refi at stabilization.
Rent comps 13 comps
| Address | Beds | Baths | Sqft | Rent | $/sqft | DOM | Units | Dist |
|---|---|---|---|---|---|---|---|---|
| 530 Elder St Unit 1 Irondale, AL | 3.0 | 2.0 | 1700 | $2,000 | $1.18 | 44d | 1 | 0.30mi |
| 132 Woodside Dr Irondale, AL | 3.0 | 1.0 | 1452 | $1,595 | $1.10 | 16d | 1 | 0.47mi |
| 509 Ardmore Ln Irondale, AL | 3.0 | 1.5 | 1408 | $1,580 | $1.12 | 3d | 1 | 0.53mi |
| 3543 Mill Springs Rd Mountain Brk, AL | 3.0 | 2.5 | 1868 | $2,500 | $1.34 | 44d | 1 | 0.74mi |
| 4324 Wilderness Rd #4324 Mountain Brook, AL | 3.0 | 2.5 | 1800 | $2,250 | $1.25 | 23d | 1 | 0.79mi |
| 504 Roselle Ln Irondale, AL | 3.0 | 2.0 | 2162 | $1,450 | $0.67 | 3d | 1 | 0.85mi |
| 3560 Great Oak Ln Birmingham, AL | 4.0 | 2.5 | 1935 | $3,200 | $1.65 | 10d | 1 | 0.94mi |
| 4452 Mountaindale Rd Birmingham, AL | 3.0 | 2.0 | 1807 | $3,025 | $1.67 | 10d | 1 | 0.97mi |
| 1522 Cooper Hill Rd Birmingham, AL | 1.0–3.0 | 1.0–2.0 | 875 | $1,299 | $1.48 | 1d | 17 | 0.98mi |
| 617 Princess Ln Irondale, AL | 3.0 | 2.0 | 1662 | $1,910 | $1.15 | 1d | 1 | 1.07mi |
| 5303 Dixieland Rd Irondale, AL | 4.0 | 3.0 | 1296 | $1,911 | $1.47 | 16d | 1 | 1.08mi |
| 2884 Montevallo Park Rd Irondale, AL | 3.0 | 2.0 | 1275 | $2,206 | $1.73 | 3d | 1 | 1.28mi |
| 1316 Southhall Rd Birmingham, AL | 3.0 | 2.0 | 2044 | $2,300 | $1.13 | 44d | 1 | 1.44mi |
Listing history 18 events
-
2026-06-18days on market $240,900 Active 49 DOM
-
2026-06-17days on market $240,900 Active 48 DOM
-
2026-06-16days on market $240,900 Active 47 DOM
-
2026-06-15days on market $240,900 Active 46 DOM
-
2026-06-13days on market $240,900 Active 44 DOM
-
2026-06-10remarks 521-char remark
-
2026-06-10pricedays on market $240,900 Active 41 DOM
-
2026-06-09days on market $244,900 Active 40 DOM
-
2026-06-08days on market $244,900 Active 39 DOM
-
2026-06-07days on market $244,900 Active 38 DOM
-
2026-06-03days on market $244,900 Active 34 DOM
-
2026-06-02days on market $244,900 Active 33 DOM
-
2026-06-01days on market $244,900 Active 32 DOM
-
2026-05-31days on market $244,900 Active 31 DOM
-
2026-04-30$244,900 Active 605-char remark
-
2026-04-28historical $244,900 605-char remark
-
2005-06-15soldstatus $112,500
-
1994-05-06soldstatus $65,000
ⓘ Source: listings_history table (triggers on properties + properties_extension) + one-shot
backfill from property_details.listing_events for pre-trigger history.
Tax reassessment forecast AL · Resets to sale price
- Current annual tax
- $1,154 · $96/mo
- Projected year-2 tax
- $1,154 · $96/mo
- Expected delta
- $0/yr ($0/mo · 0.0%)
ⓘ Screening estimate from a state-policy table — verify with the county assessor before closing.
Climate risk First Street
- Flood 1/10 Low FEMA zone X (unshaded) · 0% chance over 30 yrs
- Wildfire 1/10 Low
- Heat 6/10 Major 7 d/yr ≥107°F today · 19 d/yr by 30 yrs out
- Wind 6/10 Major 27% chance of damaging wind over 30 yrs
- Air quality 5/10 Major 8 unhealthy d/yr today · 10 by 30 yrs out
Nearby sold comps map
Loading sold comps map…
Walkable amenities ~0.75 mi
Loading nearby amenities…
Taxation est. · year 1
- Rental income
- $25,953
- − Mortgage interest
- −$13,494
- − Property taxes
- −$1,154
- − Insurance
- −$1,204
- − Repairs & maintenance
- −$2,076
- − Management
- −$2,076
- − Depreciation
- −$7,008
- Taxable loss
- −$1,060
- Est. tax savings @ 24.0%
- +$254
- After-tax cash flow
- $3,239/yr
For passive investors: Depreciation is non-cash, so a rental often shows a tax loss while cash-flowing — sheltering income. Rental losses are passive: they offset passive income freely, and up to $25,000/yr can offset ordinary (W-2) income if you actively participate and your MAGI is under $100k (phasing out to $0 by $150k); unused losses carry forward. On sale, claimed depreciation is recaptured at up to 25%, and gains may owe capital-gains tax (a 1031 exchange can defer both). Figures are a year-1 estimate at your 24.0% rate — not tax advice; consult a CPA.
Schools (NCES district)
- District
- Jefferson County
- NCES district ID
- 0101920
- Math proficiency
- 9% ▼ -24.00%
- Reading proficiency
- 32% ▼ -5.00%
- Median HH income
- $51,712
- Composite
- 18.4/100
- National rank
- #8937
- State rank
- #104 of 129 in AL
Livability — Irondale
- Score
- 74/100
- State rank
- #23
- US rank
- #4921
Category grades
Schools grade is shown separately in the Schools card above.
Census & demographics
- Census place
- Irondale, AL
- County
- Jefferson County · 527,445 people
- City population
- 13,775
- Metro
- Birmingham-Hoover, AL
- Population (ZIP)
- 13,775
- Household income
- $73,061
- Rent vs Own
- Severe rent burden
- 379.0
Population outlook (Jefferson County) Hauer SSP2
- Today (2025)
- 669,185 people
- By 2030
- 669,694 · +0.1%
- By 2040
- 661,388 · -1.2%
- By 2050
- 643,086 · -3.9%
- By 2075
- 577,267 · -13.7%
- By 2100
- 474,758 · -29.1%
Race, ethnicity, and origin ACS 2023
- Neighborhood character
- Majority White (62%)
- Race & ethnicity
- White 62% Black 28% Hispanic / Latino 7% Two or more races 6%
- Hispanic origin (detail)
- Mexican 4%
- Common ancestry
- Slovak 4% Italian 3% Serbian 2%
- Foreign-born
- 6% · Canada
- Languages at home
- 91% English-only · Spanish 6% Arabic 1% Russian/Polish/Slavic 1%
Political lean MEDSL · Jefferson
- 2024 margin
- D (+10.4) · D 54.6% · R 44.2% · Other 1.2%
- 2008→2024 swing
- +5.4pp toward D · 2008: 5.1pp · 2024: 10.4pp
- All cycles
- 2024: D+10.4 2020: D+13.2 2016: D+7.2 2012: D+6.0 2008: D+5.1
Not yet ingested
- Civics
- —
Market trends
- HPI YoY
- ▼ -109.03%
- Current HPI
- 230.033
- Rent YoY
- ▲ 4.18%
- Metro
- Birmingham-Hoover, AL
- State GDP YoY
- ▲ 2.94%
- F500 in state
- 4
Industry mix (Fortune 500 HQ in AL)
| Industry | F500 HQs | Revenue |
|---|---|---|
| Financial Services | 1 | $8B |
|
||
| Healthcare | 1 | $5B |
|
||
Price history
+270.6% since first listed5 events — show timeline
- 2026-06-09 Price Changed $240,900 Greater Alabama MLS
- 2026-04-30 Listed $244,900 Greater Alabama MLS
- 2026-04-28 Coming Soon $244,900 Greater Alabama MLS
- 2005-06-15 Sold (Public Records) $112,500 Public Records
- 1994-05-06 Sold (Public Records) $65,000 Public Records
Property tax history
+7.5%/yrLatest (2025): $1,154 · +0.7% YoY. Source: county tax records.
Cash-flow waterfall
monthlySold comps — $/sqft
last 12 mo · ≤1 miLoading sold comps…