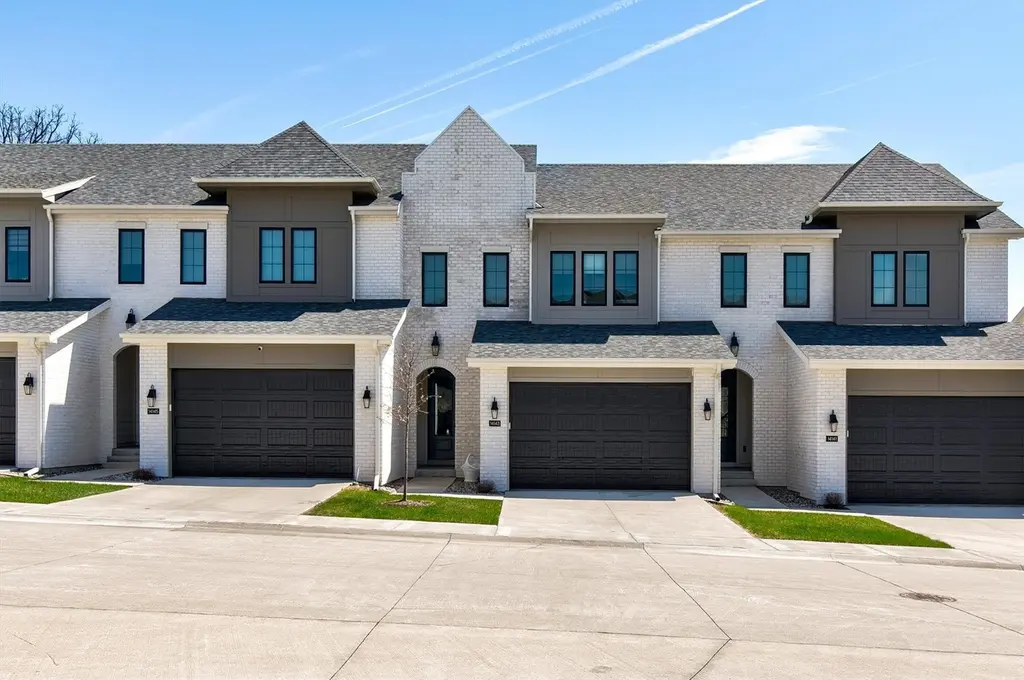
14143 Wilden Dr · Urbandale, IA
Flood risk 1/10 · Minimal
- FEMA flood zone
- X (unshaded)
- Chance of flooding over 30 yrs
- 0.0%
- Est. flood insurance / yr
- $473 – $860
Fire risk 2/10 · Minimal
- Est. fire insurance / yr
- $902 – $1,676
Heat risk 3/10 · Minor
- Hot days now (above 103°F)
- 7 days/yr
- Hot days in 30 yrs
- 15 days/yr
Wind risk 2/10 · Minimal
- Chance of severe wind over 30 yrs
- —
Air-quality risk 1/10 · Minimal
- Unhealthy air days now
- 0 days/yr
- Unhealthy air days in 30 yrs
- 0 days/yr
Risk factors via First Street. Map © Google.
Why this score? — see what drove the D- grade
The composite is a weighted blend of 9 inputs, each scored 0–100. Each bar is that input's sub-score; the figure is the points it added to the 100-point composite (weight × sub-score).
- ARV discount +15.0/15.0
- Appreciation +7.4/10.0
- Schools +6.1/10.0
- Livability +4.5/5.0
- Rent growth +2.5/5.0
- Condition / age +2.5/5.0
- Cash flow +1.6/30.0
- 1% rule +0.0/10.0
- DSCR +0.0/10.0
$445,000
🖨 Deal sheet (PDF) 📄 Offer letter ✓ Due diligence
Listing remarks MLS
Welcome to 14143 Wilden Dr in Urbandale. This home offers a clean, modern layout with 4 bedrooms, 4 bathrooms, and 2,694 finished square feet. The main level is bright, open and functional, with a spacious kitchen, large island, and additional built-in cabinetry that allows for maximum storage. Upstairs, the primary suite features a custom-designed closet that maximizes both style and function. The large secondary bedrooms have walk in closets and are perfect for a home office. Window coverings, including the living room drapes, stay with the home, making this perfectly move-in ready. Step out back to enjoy a covered deck overlooking a peaceful, tree-lined setting full of wildlife, ideal for relaxing evenings or entertaining. The garage has been upgraded with a professionally finished floor by Revival Concrete Coatings, adding both durability and a polished look. For added convenience and peace of mind, the home is equipped with an ADT security system, including a electronic front door lock, making it easy for the next owner to activate service. All information obtained from seller and public record.
Key facts
- Covered deck
- Adt security system
- 2 garage spots
Tags
Neighborhood map
What this means for you Summary
Snapshot
- This is a 3-bed/3.5-bath townhouse listed at $445k.
Deal economics
- At list price, monthly cash flow is $-2k ($-21k/yr) — negative.
- To cash-flow at today's rent, offer at most $195k (56.2% below list).
- To meet the 1% rule (rent ≥ 1% of price), the offer needs to be $199k (55.3% below list).
- Recommended offer: $195k (56.2% below list) — sets the bar for cash-flow.
- Cap rate 1.6% vs local median 2.4% in Urbandale — below-typical yield; the buyer is paying a premium for something (appreciation thesis, condition, location) that the cap rate doesn't capture.
Location & tenants
- Location reads 90/100 on livability (#4 in IA, #69 nationally) — a professional / high-income tenant draw. Strengths: crime A+, amenities A+, employment A+; Watch: commute F.
- Urbandale Community School District (suburban): math 67% / reading 72% proficiency, ranked #116 of 289 in IA (top 40%) — acceptable for families but not a draw, mixed tenant base, ~2y average lease.
- Zoned schools: Webster Elementary School (math 87% / reading 82%, grade A+, #31 of 616 statewide, top 6%, 510 students, 20% FRL); Urbandale Middle School (math 66% / reading 71%, grade A, #126 of 246 statewide, top 53%, 894 students, 41% FRL); Urbandale High School (math 66% / reading 77%, grade B+, #134 of 336 statewide, top 41%, 1,347 students, 36% FRL).
- Market conditions: 381 active listings in the ZIP; 5 comparable units currently listed for rent nearby; rentals at typical pace (median 16d on market — plan ~3-4 weeks tenant-placement turnaround); high-income renter base; 2,953 units permitted in Polk County in 2024 (540 in 5+ unit buildings).
- This rent is only 14% of the median local income ($176k/yr) — well below the 30% rent-burden line; pricing power to push rent on renewal without tenant pushback.
Forward outlook
- In year one you build about $24k of equity ($3k loan paydown + $21k appreciation (4.8% local appreciation)).
- Polk County population projected at +37% by 2050 — long-run rental-demand tailwind backs the buy-and-hold thesis.
- By year 2, paydown + projected appreciation supports a ~$39k cash-out refi (75% LTV) — recoverable capital for the next deal without selling this one.
Negotiation context
- It's been on market 33 days — a 3% lower offer ($432k) is reasonable based on typical stale-listing flexibility.
- 2 sale attempts since 4y ago with the ask held roughly flat each time — persistent listings suggest the price (not the market) is what's stuck; bring a comps-based counter.
Questions for the listing agent
- What do current leases actually rent for vs. the listed asking? Can we see a recent rent roll and the last 12 months of T-12 income?
- It's been on market 33 days. Have you received any prior offers? Is the seller open to a 56% concession, seller financing, or rate buy-down credit?
- What does the HOA fee cover, when was the last increase, and are there any pending special assessments or reserve-fund shortfalls?
- Is there a deadline driving the sale (1031 exchange, divorce, estate, relocation)? That informs how much negotiation room exists.
- Schools are A-rated — typically a magnet for longer-tenancy family renters. What's the average tenant stay here, and is there a school-zone premium baked into asking?
- The area grade is low — what's the realistic commute time and amenity access for the typical tenant pool here? Any planned neighborhood developments (good or bad) we should know about?
- What's the average days-on-market for RENTAL listings here right now (not sales)? A rising rental-DOM trend means longer vacancies and softer asking-rent achievability than the comps imply.
- What's the recent tenant-quality profile in this submarket — average credit score on applications, eviction rate, late-payment / NSF rate, and stable-employment percentage? A property-management company in the area should have these aggregated.
- How much new for-sale + rental construction is in the pipeline within 1–3 miles? Heavy new supply typically softens prices + rents 12–24 months out; constrained supply supports both.
Investment metrics
- 1% rule
- 0.45% ✗
- Cap rate
- 1.63%
- Cash-on-cash
- -16.66%
- DSCR
- 0.26
- GRM
- 18.7
CMA / ARV
- ARV (median comp)
- $549,500
- List price
- $445,000
- Delta
- -19.02%
- Verdict
- UNDERPRICED
- Comps
- 20 within 1.0 mi
Show comp detail 6 sales within ~0.75 mi
| Address | Dist | Beds/Ba | Sqft | Sold | Price | $/sf | Match |
|---|---|---|---|---|---|---|---|
| 14153 Wilden Dr | 0.03mi | 4/3.5 (+1) | 1,961 (0%) | 9mo | $437,000 | $223 | 86 |
| 14036 Ridgemont Dr | 0.26mi | 3/3.5 | 1,939 (-1%) | 2mo | $385,000 | $199 | 85 |
| 14116 Ridgemont Dr | 0.29mi | 3/3.5 | 1,919 (-2%) | 1mo | $343,400 | $179 | 82 |
| 14165 Wilden Dr | 0.06mi | 4/3.5 (+1) | 1,961 (0%) | 21mo | $410,000 | $209 | 75 |
| 14102 Ridgemont Dr | 0.26mi | 4/3.5 (+1) | 1,923 (-2%) | 9mo | $350,000 | $182 | 72 |
| 14101 Wilden Dr | 0.14mi | 3/3.0 | 2,112 (+8%) | 12mo | $747,000 | $354 | 68 |
Match score weights: distance 35% · size 25% · config 20% · recency 20%. Top-matched comps best support the ARV.
Projected returns pro-forma
4.81% appreciation · 3.0% rent growth · sell at horizon
- IRR
- -1.5%
- Equity multiple
- 0.90×
- Total profit
- $-12,313
- Equity at exit
- $246,986
- IRR
- 2.6%
- Equity multiple
- 1.49×
- Total profit
- $60,790
- Equity at exit
- $422,034
Cash invested: $124,600 (down + closing). Projections, not guarantees.
Landlord ↔ Tenant lean methodology
- Overall (STATE)
- 83 Strongly Landlord-Friendly
- State Iowa
- 83 Strongly Landlord-Friendly · R+6
- County
- — inherits STATE
- City
- — inherits STATE
ZIP-level market 50323
- Home prices YoY
- 2.5%
- Active inventory
- 381
- Price-to-rent
- 18.7×
Monthly cashflow live
- Estimated rent
- $1,988 high interval (Pro) →
- Mortgage (P&I)
- −$2,334
- Tax est. 1.5%
- −$556 /mo · $6,675/yr
- Insurance
- −$185
- HOA
- −$225
- Vacancy / Maint / Mgmt
- −$417
- Net cashflow
- $-1,730
Break-even live
Sensitivity live
| Price | -10% $-1,422 | -5% $-1,576 | +0% $-1,730 | +5% $-1,884 | +10% $-2,037 |
|---|---|---|---|---|---|
| Rent | -10% $-1,887 | -5% $-1,808 | +0% $-1,730 | +5% $-1,651 | +10% $-1,573 |
| Rate | -1.0pp $-1,506 | -0.5pp $-1,617 | base $-1,730 | +0.5pp $-1,845 | +1.0pp $-1,962 |
UW: 25.0% down · 7.5% · 30yr · 1.5% tax · 5.0% vac · 8.0% maint · 8.0% mgmt
Financing live
Cash to close
- Down payment
- $111,250
- Closing costs
- $13,350
- Reserves months
- —
- Total cash needed
- —
Loan-product check · same deal, 3 products live
Conventional
25% down · 7.5% · 30yr
- Down + closing
- —
- Monthly P&I
- —
- Monthly cashflow
- —
- DSCR
- —
- Eligible?
- —
Personal DTI + credit; lowest rate.
DSCR
20% down · 8.5% · 30yr
- Down + closing
- —
- Monthly P&I
- —
- Monthly cashflow
- —
- DSCR
- —
- Eligible?
- —
No personal income docs; deal must DSCR.
Hard money
10% down · 12.0% · 12mo
- Down + closing
- —
- Monthly P&I
- —
- Monthly cashflow
- —
- DSCR
- —
- Eligible?
- —
Short-term bridge; refi at stabilization.
Rent comps 5 comps
| Address | Beds | Baths | Sqft | Rent | $/sqft | DOM | Units | Dist |
|---|---|---|---|---|---|---|---|---|
| 14412 Holcomb Ave Urbandale, IA | 4.0 | 3.0 | 2565 | $2,900 | $1.13 | 16d | 1 | 0.97mi |
| 4454 142nd St Urbandale, IA | 1.0–3.0 | 1.0–2.0 | 949 | $1,384 | $1.46 | 16d | 6 | 1.01mi |
| 4015 154th St Urbandale, IA | 3.0 | 2.5 | 1428 | $2,295 | $1.61 | 21d | 1 | 1.27mi |
| 4315 152nd Ct Urbandale, IA | 2.0 | 2.5 | 1240 | $1,495 | $1.21 | 16d | 1 | 1.41mi |
| 4304 153rd Pl Urbandale, IA | 2.0 | 2.5 | 1240 | $1,450 | $1.17 | 23d | 1 | 1.45mi |
HOA detail
- Monthly dues
- $225 · $2,700/yr
- Likely covers
- security
Listing history 4 events
-
2026-04-16$445,000 Active 1117-char remark
Show marketing remark (1117 chars)
Welcome to 14143 Wilden Dr in Urbandale. This home offers a clean, modern layout with 4 bedrooms, 4 bathrooms, and 2,694 finished square feet. The main level is bright, open and functional, with a spacious kitchen, large island, and additional built-in cabinetry that allows for maximum storage. Upstairs, the primary suite features a custom-designed closet that maximizes both style and function. The large secondary bedrooms have walk in closets and are perfect for a home office. Window coverings, including the living room drapes, stay with the home, making this perfectly move-in ready. Step out back to enjoy a covered deck overlooking a peaceful, tree-lined setting full of wildlife, ideal for relaxing evenings or entertaining. The garage has been upgraded with a professionally finished floor by Revival Concrete Coatings, adding both durability and a polished look. For added convenience and peace of mind, the home is equipped with an ADT security system, including a electronic front door lock, making it easy for the next owner to activate service. All information obtained from seller and public record.
-
2022-11-14soldstatus $415,134 Closed
-
2022-03-24status Pending
-
2022-03-24$405,000 Active
ⓘ Source: listings_history table (triggers on properties + properties_extension) + one-shot
backfill from property_details.listing_events for pre-trigger history.
Climate risk First Street
- Flood 1/10 Low FEMA zone X (unshaded) · 0% chance over 30 yrs
- Wildfire 2/10 Low
- Heat 3/10 Moderate 7 d/yr ≥103°F today · 15 d/yr by 30 yrs out
- Wind 2/10 Low
- Air quality 1/10 Low 0 unhealthy d/yr today · 0 by 30 yrs out
Nearby sold comps map
Loading sold comps map…
Walkable amenities ~0.75 mi
Loading nearby amenities…
Taxation est. · year 1
- Rental income
- $23,856
- − Mortgage interest
- −$24,927
- − Property taxes
- −$6,675
- − Insurance
- −$2,225
- − Repairs & maintenance
- −$1,908
- − Management
- −$1,908
- − HOA
- −$2,700
- − Depreciation
- −$12,945
- Taxable loss
- −$29,433
- Est. tax savings @ 24.0%
- +$7,064
- After-tax cash flow
- $-13,693/yr
For passive investors: Depreciation is non-cash, so a rental often shows a tax loss while cash-flowing — sheltering income. Rental losses are passive: they offset passive income freely, and up to $25,000/yr can offset ordinary (W-2) income if you actively participate and your MAGI is under $100k (phasing out to $0 by $150k); unused losses carry forward. On sale, claimed depreciation is recaptured at up to 25%, and gains may owe capital-gains tax (a 1031 exchange can defer both). Figures are a year-1 estimate at your 24.0% rate — not tax advice; consult a CPA.
Schools (NCES district)
- District
- Urbandale Community School District
- NCES district ID
- 1928680
- Math proficiency
- 67% ▼ -10.00%
- Reading proficiency
- 72% ▼ -3.00%
- Median HH income
- $71,098
- Composite
- 60.95/100
- National rank
- #807
- State rank
- #116 of 289 in IA
Livability — Urbandale
- Score
- 90/100
- State rank
- #4
- US rank
- #69
Category grades
Schools grade is shown separately in the Schools card above.
Census & demographics
- Census place
- Urbandale, IA
- County
- Polk County · 453,298 people
- City population
- 49,196
- Metro
- Des Moines-West Des Moines, IA
- Population (ZIP)
- 17,265
- Household income
- $175,944
- Rent vs Own
- Severe rent burden
- 63.0
Population outlook (Polk County) Hauer SSP2
- Today (2025)
- 548,042 people
- By 2030
- 588,557 · +7.4%
- By 2040
- 670,629 · +22.4%
- By 2050
- 752,830 · +37.4%
- By 2075
- 955,069 · +74.3%
- By 2100
- 1,115,436 · +103.5%
Race, ethnicity, and origin ACS 2023
- Neighborhood character
- Predominantly White (86%)
- Race & ethnicity
- White 86% Asian 6% Two or more races 4% Hispanic / Latino 3% Black 2%
- Common ancestry
- Portuguese 6% Iranian 5% Lithuanian 2%
- Foreign-born
- 7% · Canada, China, Philippines
- Languages at home
- 92% English-only · Russian/Polish/Slavic 2% Chinese 1% Spanish 1%
Political lean MEDSL · Polk
- 2024 margin
- D (+10.9) · D 54.8% · R 43.9% · Other 1.3%
- 2008→2024 swing
- -3.7pp toward R · 2008: 14.6pp · 2024: 10.9pp
- All cycles
- 2024: D+10.9 2020: D+15.2 2016: D+11.5 2012: D+14.2 2008: D+14.6
Not yet ingested
- Civics
- —
Market trends
- HPI YoY
- ▲ 4.81%
- Current HPI
- 199.789
- Rent YoY
- —
- Metro
- Des Moines-West Des Moines, IA
- State GDP YoY
- ▲ 2.48%
- F500 in state
- 4
Industry mix (Fortune 500 HQ in IA)
| Industry | F500 HQs | Revenue |
|---|---|---|
| Financial Services | 1 | $16B |
|
||
| Retail / Convenience | 1 | $15B |
|
||
Price history
+9.9% since first listed4 events — show timeline
- 2026-04-16 Listed $445,000 DMMLS
- 2022-11-14 Sold (MLS) $415,134 DMMLS
- 2022-03-24 Pending — DMMLS
- 2022-03-24 Listed $405,000 DMMLS
Cash-flow waterfall
monthlySold comps — $/sqft
last 12 mo · ≤1 miLoading sold comps…