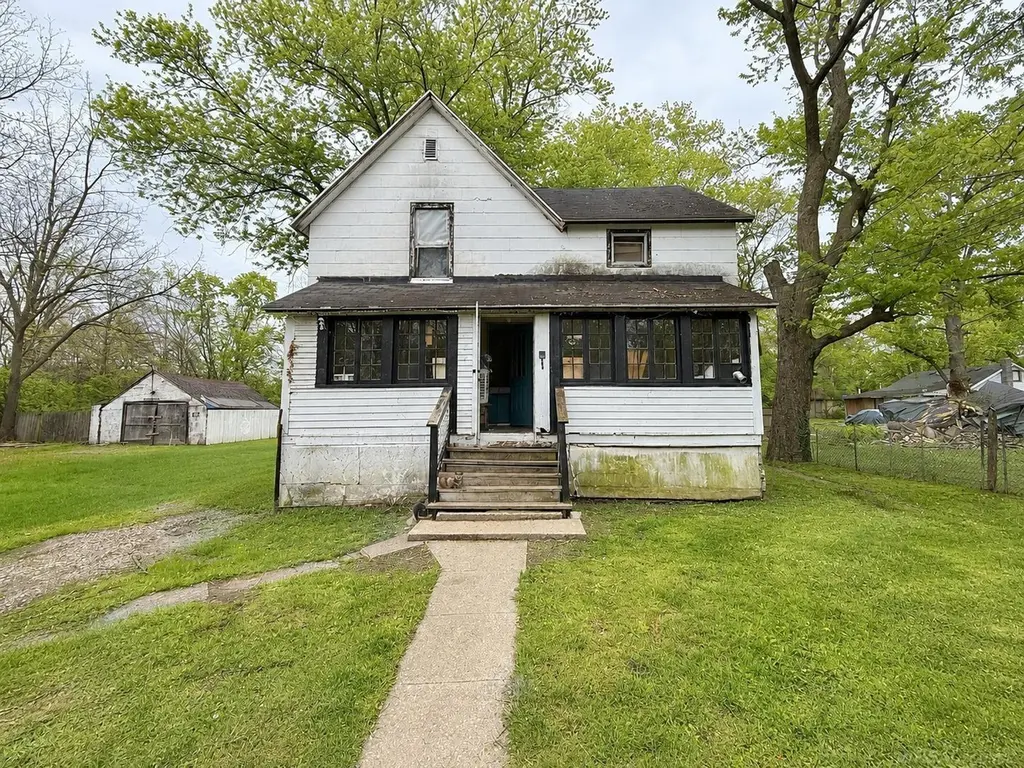
939 Field Ave · Kalamazoo, MI
Flood risk 9/10 · Severe
- FEMA flood zone
- AE
- Chance of flooding over 30 yrs
- 0.99%
- Est. flood insurance / yr
- $2,026 – $9,024
Fire risk 1/10 · Minimal
- Est. fire insurance / yr
- $784 – $1,456
Heat risk 2/10 · Minimal
- Hot days now (above 98°F)
- 7 days/yr
- Hot days in 30 yrs
- 15 days/yr
Wind risk 2/10 · Minimal
- Chance of severe wind over 30 yrs
- —
Air-quality risk 2/10 · Minimal
- Unhealthy air days now
- 1 days/yr
- Unhealthy air days in 30 yrs
- 2 days/yr
Risk factors via First Street. Map © Google.
Why this score? — see what drove the A- grade
The composite is a weighted blend of 9 inputs, each scored 0–100. Each bar is that input's sub-score; the figure is the points it added to the 100-point composite (weight × sub-score).
- Cash flow +30.0/30.0
- ARV discount +15.0/15.0
- 1% rule +10.0/10.0
- DSCR +10.0/10.0
- Schools +4.7/10.0
- Rent growth +4.5/5.0
- Livability +3.8/5.0
- Condition / age +2.5/5.0
- Appreciation +0.0/10.0
$67,000
🖨 Deal sheet (PDF) 📄 Offer letter ✓ Due diligence
Listing remarks MLS
Discover a package deal at 939 Field Ave, Kalamazoo, MI 49048 and Lot 97, Kalamazoo, MI 49048. This property offers 5 bedrooms and 1 bathroom across approx. 1,500 sq ft. Ideal for investors seeking value-add potential in a convenient location. Generous layout ready for updates and your vision. Great opportunity to maximize returns or create a dream home. Property sold AS-IS
Key facts
- 6,098 sq ft lot
- Garage
- Built 1949
Property features AI
Finance
- Other: Property listed by Joseph Walter Realty LLC
- HOA & community: Homeowners association present
Exterior
- Parking: Detached 1-car garage
- Utilities: Public water; Shared septic sewer
- Home design: Single-family residence; Two-story
- Construction: Wood siding; 1,500 above-grade finished area; Built with crawl space foundation
- Exterior features: Lot in FIELD ADD subdivision; Cross streets: Field Avenue and Dupon Avenue
Interior
- Bathrooms: 1 full bathroom
- Heating & cooling: Forced air heating (natural gas); No central cooling
- Interior features: Crawl space basement; 8 total rooms
Neighborhood map
What this means for you Summary
Snapshot
- This is a 3-bed/1.0-bath single-family listed at $67k.
Deal economics
- At list price, monthly cash flow is $96 ($1k/yr) — positive.
- The deal already cash-flows at list — no discount required.
- Meets the 1% rule at list price ($1k rent vs $67k).
- Recommended offer: $65k (3.0% below list) — sets the bar for market timing.
- Cap rate 16.3% vs local median 3.5% in Kalamazoo — top-decile yield for the area; either an underpriced asset or a hidden risk that comps aren't pricing in. Stress-test before assuming the spread holds.
Location & tenants
- Location reads 76/100 on livability (#141 in MI, #3,492 nationally) — a middle-class / working-renter tenant base. Strengths: commute A+, cost of living A+, housing A+; Watch: crime F, employment D-.
- Kalamazoo Public Schools (urban): math 43% / reading 72% proficiency, ranked #71 of 540 in MI (top 13%) — acceptable for families but not a draw, mixed tenant base, ~2y average lease; 66% free/reduced lunch — lower-income household profile, screen leases tightly.
- Market conditions: Rents rising fast (+7.9%/yr); 155 active listings in the ZIP; 4 comparable units currently listed for rent nearby; rentals at typical pace (median 22d on market — plan ~3-4 weeks tenant-placement turnaround); 339 units permitted in Kalamazoo County in 2024 (22 in 5+ unit buildings).
Forward outlook
- Local home prices are declining (-3.0%/yr); year-one equity from $463 of loan paydown is wiped out by about $2k of value loss. Plan a longer hold.
- Kalamazoo County population projected at +18% by 2050 — long-run rental-demand tailwind backs the buy-and-hold thesis.
- At projected returns (-3.0% appreciation + 7.9% rent growth), your $19k cash investment doubles in ~7 years — after that, you're playing with house money.
Negotiation context
- It's been on market 33 days — a 3% lower offer ($65k) is reasonable based on typical stale-listing flexibility.
- 2 sale attempts with the ask held roughly flat each time — persistent listings suggest the price (not the market) is what's stuck; bring a comps-based counter.
Risks & watch-outs
- Watch-outs: flood insurance adds $460/mo; built in 1949 — expect roof / HVAC / electrical / plumbing capex.
- Climate carrying-cost: in FEMA flood zone AE (mandatory federal flood insurance) — expect insurance premiums to compound above CPI over the hold.
Questions for the listing agent
- It's been on market 33 days. Have you received any prior offers? Is the seller open to a 3% concession, seller financing, or rate buy-down credit?
- Built in 1949 — when were the roof, HVAC, electrical panel, plumbing, and water heater last replaced?
- What's the actual annual flood-insurance premium (NFIP or private), and is the property in a SFHA with mandatory coverage?
- Is there a deadline driving the sale (1031 exchange, divorce, estate, relocation)? That informs how much negotiation room exists.
- Crime grade is F in this area — have there been break-ins, vandalism, or insurance claims at this property in the last 3 years? What carrier currently insures it and at what premium?
- What's the average days-on-market for RENTAL listings here right now (not sales)? A rising rental-DOM trend means longer vacancies and softer asking-rent achievability than the comps imply.
- What's the recent tenant-quality profile in this submarket — average credit score on applications, eviction rate, late-payment / NSF rate, and stable-employment percentage? A property-management company in the area should have these aggregated.
- How much new for-sale + rental construction is in the pipeline within 1–3 miles? Heavy new supply typically softens prices + rents 12–24 months out; constrained supply supports both.
Investment metrics
- 1% rule
- 1.94% ✓
- Cap rate
- 16.27%
- Cash-on-cash
- 35.62%
- DSCR
- 2.58
- GRM
- 4.3
CMA / ARV
- ARV (on-the-fly)
- $109,345
- Comps found
- 12
Show comp detail 12 sales within ~0.75 mi
| Address | Dist | Beds/Ba | Sqft | Sold | Price | $/sf | Match |
|---|---|---|---|---|---|---|---|
| 1116 Surprise Ave | 0.39mi | 3/1.5 | 1,200 (+4%) | 8mo | $165,000 | $138 | 66 |
| 1721 Egleston Ave | 0.53mi | 3/1.5 | 1,186 (+3%) | 2mo | $115,000 | $97 | 66 |
| 1519 E Stockbridge Ave | 0.60mi | 3/1.5 | 1,121 (-3%) | 4mo | $95,000 | $85 | 62 |
| 1310 Lake St | 0.68mi | 3/1.5 | 1,150 (-0%) | 11mo | $105,000 | $91 | 57 |
| 1908 E Stockbridge Ave | 0.40mi | 3/1.0 | 1,000 (-13%) | 3mo | $136,038 | $136 | 57 |
| 1715 Reed Ave | 0.65mi | 3/1.0 | 1,056 (-8%) | 10mo | $100,000 | $95 | 48 |
| 1312 March St | 0.69mi | 3/1.0 | 1,250 (+9%) | 7mo | $54,000 | $43 | 47 |
| 1612 Reed Ave | 0.72mi | 2/1.0 (-1) | 1,184 (+3%) | 12mo | $90,000 | $76 | 47 |
| 1612 E Stockbridge Ave | 0.57mi | 3/1.5 | 1,301 (+13%) | 4mo | $156,500 | $120 | 46 |
| 1718 Egleston Ave | 0.56mi | 3/1.0 | 1,288 (+12%) | 14mo | $84,000 | $65 | 42 |
| 1228 Wells Pl | 0.72mi | 3/1.0 | 1,036 (-10%) | 10mo | $83,000 | $80 | 42 |
| 817 Clarence St | 0.60mi | 4/2.0 (+1) | 1,312 (+14%) | 13mo | $138,000 | $105 | 29 |
Match score weights: distance 35% · size 25% · config 20% · recency 20%. Top-matched comps best support the ARV.
Projected returns pro-forma
-3.0% appreciation · 7.88% rent growth · sell at horizon
- IRR
- 2.9%
- Equity multiple
- 1.12×
- Total profit
- $2,297
- Equity at exit
- $9,990
- IRR
- 19.1%
- Equity multiple
- 3.22×
- Total profit
- $41,596
- Equity at exit
- $5,793
Cash invested: $18,760 (down + closing). Projections, not guarantees.
Landlord ↔ Tenant lean methodology
- Overall (STATE)
- 62 Landlord-Friendly
- State Michigan
- 62 Landlord-Friendly · EVEN
- County
- — inherits STATE
- City
- — inherits STATE
ZIP-level market 49048
- Rents YoY
- 7.9%
- Active inventory
- 155
- Price-to-rent
- 4.3×
Monthly cashflow live
- Estimated rent
- $1,301 medium interval (Pro) →
- Mortgage (P&I)
- −$351
- Tax from tax record
- −$92 /mo · $1,104/yr
- Insurance
- −$28
- Flood insurance flood zone
- −$460 /mo · $5,525/yr
- HOA
- −$0
- Vacancy / Maint / Mgmt
- −$273
- Net cashflow
- $96
Break-even live
Sensitivity live
| Price | -10% $134 | -5% $115 | +0% $96 | +5% $77 | +10% $59 |
|---|---|---|---|---|---|
| Rent | -10% $-6 | -5% $45 | +0% $96 | +5% $148 | +10% $199 |
| Rate | -1.0pp $130 | -0.5pp $113 | base $96 | +0.5pp $79 | +1.0pp $61 |
UW: 25.0% down · 7.5% · 30yr · 1.5% tax · 5.0% vac · 8.0% maint · 8.0% mgmt
Financing live
Cash to close
- Down payment
- $16,750
- Closing costs
- $2,010
- Reserves months
- —
- Total cash needed
- —
Loan-product check · same deal, 3 products live
Conventional
25% down · 7.5% · 30yr
- Down + closing
- —
- Monthly P&I
- —
- Monthly cashflow
- —
- DSCR
- —
- Eligible?
- —
Personal DTI + credit; lowest rate.
DSCR
20% down · 8.5% · 30yr
- Down + closing
- —
- Monthly P&I
- —
- Monthly cashflow
- —
- DSCR
- —
- Eligible?
- —
No personal income docs; deal must DSCR.
Hard money
10% down · 12.0% · 12mo
- Down + closing
- —
- Monthly P&I
- —
- Monthly cashflow
- —
- DSCR
- —
- Eligible?
- —
Short-term bridge; refi at stabilization.
Rent comps 4 comps
| Address | Beds | Baths | Sqft | Rent | $/sqft | DOM | Units | Dist |
|---|---|---|---|---|---|---|---|---|
| 1315 Race St Kalamazoo, MI | 2.0 | 1.0 | 826 | $950 | $1.15 | 14d | 1 | 0.92mi |
| 414 Trimble Ave Kalamazoo, MI | 2.0 | 1.0 | 764 | $1,300 | $1.70 | 14d | 1 | 1.05mi |
| 621 Washburn Ave Kalamazoo, MI | 2.0 | 1.0 | 720 | $1,300 | $1.81 | 22d | 1 | 1.20mi |
| 1403 Sherwood Ave Unit 2 Kalamazoo, MI | 2.0 | 1.0 | 900 | $1,000 | $1.11 | 22d | 1 | 1.30mi |
Listing history 19 events
-
2026-06-21days on market $67,000 Active 33 DOM
-
2026-06-18days on market $67,000 Active 30 DOM
-
2026-06-17days on market $67,000 Active 29 DOM
-
2026-06-16days on market $67,000 Active 28 DOM
-
2026-06-15days on market $67,000 Active 27 DOM
-
2026-06-14days on market $67,000 Active 25 DOM
-
2026-06-13days on market $67,000 Active 24 DOM
-
2026-06-10days on market $67,000 Active 22 DOM
-
2026-06-09days on market $67,000 Active 21 DOM
-
2026-06-08days on market $67,000 Active 20 DOM
-
2026-06-07days on market $67,000 Active 19 DOM
-
2026-06-05days on market $67,000 Active 16 DOM
-
2026-06-03days on market $67,000 Active 15 DOM
-
2026-06-02days on market $67,000 Active 14 DOM
-
2026-06-01days on market $67,000 Active 13 DOM
-
2026-05-31days on market $67,000 Active 12 DOM
-
2026-05-30pricedays on market $67,000 Active 11 DOM
-
2026-05-19$70,000 Active 376-char remark
Show marketing remark (376 chars)
Discover a package deal at 939 Field Ave, Kalamazoo, MI 49048 and Lot 97, Kalamazoo, MI 49048. This property offers 5 bedrooms and 1 bathroom across approx. 1,500 sq ft. Ideal for investors seeking value-add potential in a convenient location. Generous layout ready for updates and your vision. Great opportunity to maximize returns or create a dream home. Property sold AS-IS
-
2026-05-19$70,000 Active
Show marketing remark (376 chars)
Discover a package deal at 939 Field Ave, Kalamazoo, MI 49048 and Lot 97, Kalamazoo, MI 49048. This property offers 5 bedrooms and 1 bathroom across approx. 1,500 sq ft. Ideal for investors seeking value-add potential in a convenient location. Generous layout ready for updates and your vision. Great opportunity to maximize returns or create a dream home. Property sold AS-IS
ⓘ Source: listings_history table (triggers on properties + properties_extension) + one-shot
backfill from property_details.listing_events for pre-trigger history.
Tax reassessment forecast MI · Partial reset (capped growth)
- Current annual tax
- $1,104 · $92/mo
- Projected year-2 tax
- $1,104 · $92/mo
- Expected delta
- $0/yr ($0/mo · 0.0%)
ⓘ Screening estimate from a state-policy table — verify with the county assessor before closing.
Climate risk First Street
- Flood 9/10 Extreme FEMA zone AE · 99% chance over 30 yrs
- Wildfire 1/10 Low
- Heat 2/10 Low 7 d/yr ≥98°F today · 15 d/yr by 30 yrs out
- Wind 2/10 Low
- Air quality 2/10 Low 1 unhealthy d/yr today · 2 by 30 yrs out
Nearby sold comps map
Loading sold comps map…
Walkable amenities ~0.75 mi
Loading nearby amenities…
Taxation est. · year 1
- Rental income
- $15,617
- − Mortgage interest
- −$3,753
- − Property taxes
- −$1,104
- − Insurance
- −$5,860
- − Repairs & maintenance
- −$1,249
- − Management
- −$1,249
- − Depreciation
- −$1,949
- Taxable income
- $452
- Est. tax owed @ 24.0%
- −$109
- After-tax cash flow
- $1,049/yr
For passive investors: Depreciation is non-cash, so a rental often shows a tax loss while cash-flowing — sheltering income. Rental losses are passive: they offset passive income freely, and up to $25,000/yr can offset ordinary (W-2) income if you actively participate and your MAGI is under $100k (phasing out to $0 by $150k); unused losses carry forward. On sale, claimed depreciation is recaptured at up to 25%, and gains may owe capital-gains tax (a 1031 exchange can defer both). Figures are a year-1 estimate at your 24.0% rate — not tax advice; consult a CPA.
Schools (NCES district)
- District
- Kalamazoo Public Schools
- NCES district ID
- 2619950
- Math proficiency
- 43% ▲ 13.00%
- Reading proficiency
- 72% ▲ 33.00%
- Median HH income
- $35,291
- Composite
- 47.48/100
- National rank
- #2275
- State rank
- #71 of 540 in MI
Livability — Kalamazoo
- Score
- 76/100
- State rank
- #141
- US rank
- #3492
Category grades
Schools grade is shown separately in the Schools card above.
Census & demographics
- County
- Kalamazoo County · 224,317 people
- City population
- 121,397
- Metro
- Kalamazoo-Portage, MI
- Population (ZIP)
- 22,791
- Household income
- $60,454
- Rent vs Own
- Severe rent burden
- 835.0
Population outlook (Kalamazoo County) Hauer SSP2
- Today (2025)
- 280,982 people
- By 2030
- 292,068 · +3.9%
- By 2040
- 312,191 · +11.1%
- By 2050
- 331,196 · +17.9%
- By 2075
- 379,021 · +34.9%
- By 2100
- 396,579 · +41.1%
Race, ethnicity, and origin ACS 2023
- Neighborhood character
- Predominantly White (67%)
- Race & ethnicity
- White 67% Black 20% Hispanic / Latino 7% Two or more races 7% Asian 2%
- Hispanic origin (detail)
- Mexican 4%
- Common ancestry
- Iranian 6% Romanian 4% Lithuanian 2%
- Foreign-born
- 4% · Canada
- Languages at home
- 94% English-only · Spanish 3% Other Indo-European 1%
Political lean MEDSL · Kalamazoo
- 2024 margin
- D (+17.7) · D 58.0% · R 40.3% · Other 1.7%
- 2008→2024 swing
- -1.8pp toward R · 2008: 19.5pp · 2024: 17.7pp
- All cycles
- 2024: D+17.7 2020: D+18.7 2016: D+12.8 2012: D+13.3 2008: D+19.5
Not yet ingested
- Civics
- —
Market trends
- HPI YoY
- ▼ -205.26%
- Current HPI
- 180.4766
- Rent YoY
- ▲ 7.88%
- Metro
- Kalamazoo-Portage, MI
- State GDP YoY
- ▲ 1.37%
- F500 in state
- 28
Industry mix (Fortune 500 HQ in MI)
| Industry | F500 HQs | Revenue |
|---|---|---|
| Automotive Parts | 3 | $48B |
|
||
| Automotive | 2 | $372B |
|
||
| Chemicals | 1 | $45B |
|
||
| Automotive Retail | 1 | $29B |
|
||
| Healthcare / Medical Devices | 1 | $23B |
|
||
| Automotive Technology | 1 | $20B |
|
||
Price history
+0.0% since first listed2 events — show timeline
- 2026-05-19 Listed $70,000 REALCOMP
- 2026-05-19 Listed $70,000 MiRealSource-MiMLS
Property tax history
+8.9%/yrLatest (2025): $1,104 · +34.4% YoY. Source: county tax records.
Cash-flow waterfall
monthlySold comps — $/sqft
last 12 mo · ≤1 miLoading sold comps…