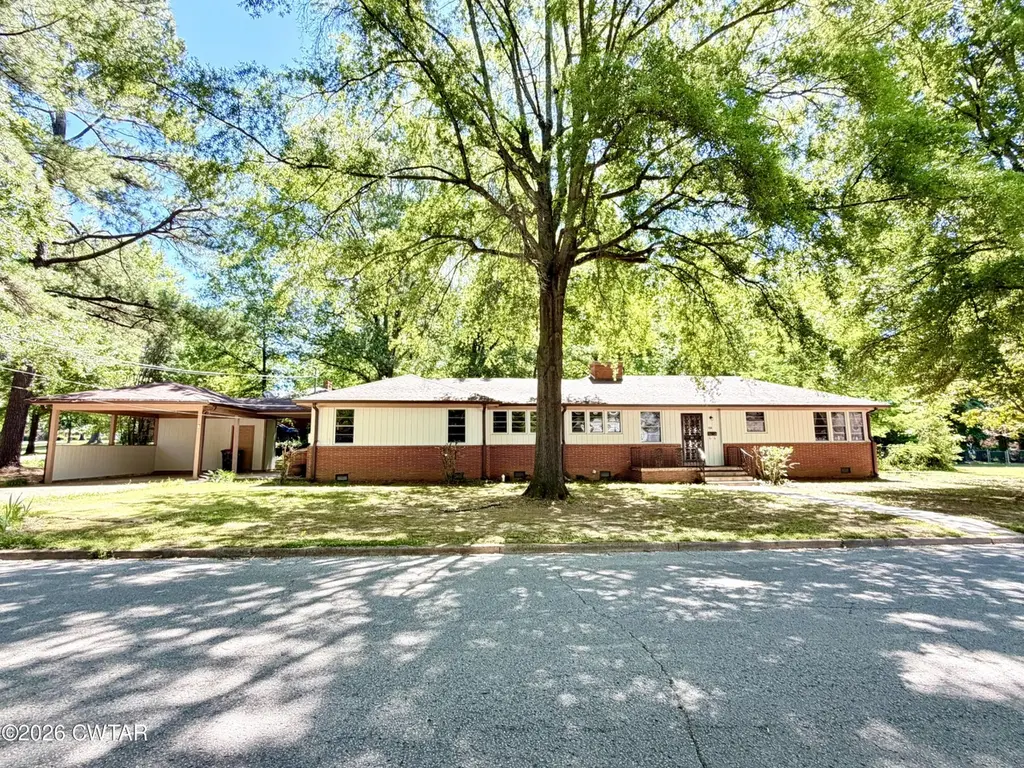
150 Woodland Dr · Humboldt, TN
Flood risk 1/10 · Minimal
- FEMA flood zone
- X (unshaded)
- Chance of flooding over 30 yrs
- 0.0%
- Est. flood insurance / yr
- $507 – $1,088
Fire risk 1/10 · Minimal
- Est. fire insurance / yr
- $949 – $1,763
Heat risk 6/10 · Moderate
- Hot days now (above 109°F)
- 7 days/yr
- Hot days in 30 yrs
- 20 days/yr
Wind risk 4/10 · Minor
- Chance of severe wind over 30 yrs
- 12.0%
Air-quality risk 1/10 · Minimal
- Unhealthy air days now
- 0 days/yr
- Unhealthy air days in 30 yrs
- 0 days/yr
Risk factors via First Street. Map © Google.
Why this score? — see what drove the D grade
The composite is a weighted blend of 9 inputs, each scored 0–100. Each bar is that input's sub-score; the figure is the points it added to the 100-point composite (weight × sub-score).
- Cash flow +16.6/30.0
- ARV discount +7.5/15.0
- DSCR +5.1/10.0
- 1% rule +4.5/10.0
- Livability +3.0/5.0
- Rent growth +2.5/5.0
- Condition / age +2.5/5.0
- Schools +0.5/10.0
- Appreciation +0.0/10.0
$184,000
🖨 Deal sheet (PDF) 📄 Offer letter ✓ Due diligence
Listing remarks MLS
If you are looking for a home with character, this home is for you! This 3 bedroom, 1 1/2 bath home features a large living space with fireplace, many built in cabinets, and lots of natural light. Fenced in backyard with a large patio perfect for entertaining. Freshly painted, new light fixtures and new HVAC are just a few of the recent updates. Call today for a private viewing.
Key facts
- 0.4 acre lot
- 3 parking spots
- Built 1954
Property features AI
Exterior
- Parking: Three total parking spaces; One covered carport space; Two open parking spaces; Open parking features
- Utilities: Public water; Public sewer; Electricity connected; Natural gas available and connected; Cable available
- Home design: Single-family residence; One story; Level lot; City street frontage
- Construction: Brick and other exterior materials; Shingle roof; One-story construction
- Exterior features: Rain gutters; Front porch; Patio; Back yard chain-link fence; Storage structure
Interior
- Kitchen: Dishwasher; Electric range
- Bedrooms: Two main-level bedrooms
- Flooring: Concrete; Hardwood; Linoleum
- Bathrooms: Two full bathrooms on the main level
- Heating & cooling: Central heating; Central air; Ceiling fans
- Interior features: Bookcases; Ceiling fans; Entrance foyer; Gas log fireplace
- Laundry & utility: Main-level laundry room; Electric dryer hookup; Electric water heater
Neighborhood map
What this means for you Summary
Snapshot
- This is a 2-bed/2.0-bath single-family listed at $184k.
Deal economics
- At list price, monthly cash flow is $111 ($1k/yr) — positive.
- The deal already cash-flows at list — no discount required.
- To meet the 1% rule (rent ≥ 1% of price), the offer needs to be $175k (4.9% below list).
- Recommended offer: $175k (4.9% below list) — sets the bar for 1% rule.
Location & tenants
- Location reads 59/100 on livability (#289 in TN) — a working-class tenant base; expect higher turnover. Strengths: cost of living A+, housing A+; Watch: health & safety C-, crime F, amenities F.
- Humboldt City Schools (town): math 4% / reading 9% proficiency, ranked #138 of 139 in TN (top 99%) — low school quality limits family demand, transient renter base, plan for 1-2y turnover; 86% free/reduced lunch — lower-income household profile, screen leases tightly.
- Zoned schools: East Elementary School (math 4% / reading 8%, grade F, #884 of 952 statewide, top 93%, 440 students, 0% FRL); Humboldt Junior/Senior High School (math 3% / reading 11%, grade F, #302 of 332 statewide, top 91%, 424 students, 0% FRL) — zoned schools average 0% FRL vs 86% district-wide (86 pts lower); this property's tenant base skews higher-income than the district average.
- Market conditions: 153 active listings in the ZIP; 1 comparable units currently listed for rent nearby; 155 units permitted in Gibson County in 2024 (0 in 5+ unit buildings).
Forward outlook
- Local home prices are declining (-3.0%/yr); year-one equity from $1k of loan paydown is wiped out by about $6k of value loss. Plan a longer hold.
- Gibson County population projected to shrink 8% by 2050 — rents likely to lag national; underwrite the cash flow, not the appreciation.
Negotiation context
- Only 8 days on market — expect competitive offers; lowballing is unlikely to land.
- 3 sale attempts since 10y ago with the ask held roughly flat each time — persistent listings suggest the price (not the market) is what's stuck; bring a comps-based counter.
- Current owner paid $152k; 21% above their basis — modest negotiation headroom, anchor on the comps not their cost.
Risks & watch-outs
- Watch-outs: built in 1954 — expect roof / HVAC / electrical / plumbing capex.
- Climate carrying-cost: extreme-heat days projected 7→20/yr by 2055 (HVAC capex compounding) — expect insurance premiums to compound above CPI over the hold.
Questions for the listing agent
- Built in 1954 — when were the roof, HVAC, electrical panel, plumbing, and water heater last replaced?
- Is there a deadline driving the sale (1031 exchange, divorce, estate, relocation)? That informs how much negotiation room exists.
- Schools are F-rated, which usually means shorter tenancies and higher turnover. Who's the typical renter profile here, and what's been the actual vacancy rate?
- Crime grade is F in this area — have there been break-ins, vandalism, or insurance claims at this property in the last 3 years? What carrier currently insures it and at what premium?
- The area grade is low — what's the realistic commute time and amenity access for the typical tenant pool here? Any planned neighborhood developments (good or bad) we should know about?
- What's the average days-on-market for RENTAL listings here right now (not sales)? A rising rental-DOM trend means longer vacancies and softer asking-rent achievability than the comps imply.
- What's the recent tenant-quality profile in this submarket — average credit score on applications, eviction rate, late-payment / NSF rate, and stable-employment percentage? A property-management company in the area should have these aggregated.
- How much new for-sale + rental construction is in the pipeline within 1–3 miles? Heavy new supply typically softens prices + rents 12–24 months out; constrained supply supports both.
Investment metrics
- 1% rule
- 0.95% ✗
- Cap rate
- 7.02%
- Cash-on-cash
- 2.58%
- DSCR
- 1.11
- GRM
- 8.8
CMA / ARV
No comps found within radius.
Projected returns pro-forma
-3.0% appreciation · 3.0% rent growth · sell at horizon
- IRR
- -12.2%
- Equity multiple
- 0.56×
- Total profit
- $-22,725
- Equity at exit
- $27,435
- IRR
- -3.1%
- Equity multiple
- 0.79×
- Total profit
- $-10,585
- Equity at exit
- $15,909
Cash invested: $51,520 (down + closing). Projections, not guarantees.
Landlord ↔ Tenant lean methodology
- Overall (STATE)
- 87 Strongly Landlord-Friendly
- State Tennessee
- 87 Strongly Landlord-Friendly · R+13
- County
- — inherits STATE
- City
- — inherits STATE
ZIP-level market 38343
- Home prices YoY
- -18.1%
- Active inventory
- 153
- Price-to-rent
- 8.8×
Monthly cashflow live
- Estimated rent
- $1,750 medium interval (Pro) →
- Mortgage (P&I)
- −$965
- Tax est. 1.5%
- −$230 /mo · $2,760/yr
- Insurance
- −$77
- HOA
- −$0
- Vacancy / Maint / Mgmt
- −$368
- Net cashflow
- $111
Break-even live
Sensitivity live
| Price | -10% $238 | -5% $174 | +0% $111 | +5% $47 | +10% $-16 |
|---|---|---|---|---|---|
| Rent | -10% $-27 | -5% $42 | +0% $111 | +5% $180 | +10% $249 |
| Rate | -1.0pp $204 | -0.5pp $158 | base $111 | +0.5pp $63 | +1.0pp $15 |
UW: 25.0% down · 7.5% · 30yr · 1.5% tax · 5.0% vac · 8.0% maint · 8.0% mgmt
Financing live
Cash to close
- Down payment
- $46,000
- Closing costs
- $5,520
- Reserves months
- —
- Total cash needed
- —
Loan-product check · same deal, 3 products live
Conventional
25% down · 7.5% · 30yr
- Down + closing
- —
- Monthly P&I
- —
- Monthly cashflow
- —
- DSCR
- —
- Eligible?
- —
Personal DTI + credit; lowest rate.
DSCR
20% down · 8.5% · 30yr
- Down + closing
- —
- Monthly P&I
- —
- Monthly cashflow
- —
- DSCR
- —
- Eligible?
- —
No personal income docs; deal must DSCR.
Hard money
10% down · 12.0% · 12mo
- Down + closing
- —
- Monthly P&I
- —
- Monthly cashflow
- —
- DSCR
- —
- Eligible?
- —
Short-term bridge; refi at stabilization.
Rent comps 1 comps
| Address | Beds | Baths | Sqft | Rent | $/sqft | DOM | Units | Dist |
|---|---|---|---|---|---|---|---|---|
| 3107 Redwood St Humboldt, TN | 3.0 | 2.0 | 2008 | $1,750 | $0.87 | 45d | 1 | 0.62mi |
Listing history 7 events
-
2026-05-15$184,000 Active
-
2022-08-25soldstatus $152,500
-
2022-08-23soldstatus $152,500 381-char remark
Show marketing remark (381 chars)
If you are looking for a home with character, this home is for you! This 3 bedroom, 1 1/2 bath home features a large living space with fireplace, many built in cabinets, and lots of natural light. Fenced in backyard with a large patio perfect for entertaining. Freshly painted, new light fixtures and new HVAC are just a few of the recent updates. Call today for a private viewing.
-
2022-05-17$159,900 381-char remark
Show marketing remark (381 chars)
If you are looking for a home with character, this home is for you! This 3 bedroom, 1 1/2 bath home features a large living space with fireplace, many built in cabinets, and lots of natural light. Fenced in backyard with a large patio perfect for entertaining. Freshly painted, new light fixtures and new HVAC are just a few of the recent updates. Call today for a private viewing.
-
2016-03-04soldstatus $100,000
-
2016-03-01soldstatus $40,000
-
2016-03-01$40,000
ⓘ Source: listings_history table (triggers on properties + properties_extension) + one-shot
backfill from property_details.listing_events for pre-trigger history.
Climate risk First Street
- Flood 1/10 Low FEMA zone X (unshaded) · 0% chance over 30 yrs
- Wildfire 1/10 Low
- Heat 6/10 Major 7 d/yr ≥109°F today · 20 d/yr by 30 yrs out
- Wind 4/10 Moderate 12% chance of damaging wind over 30 yrs
- Air quality 1/10 Low 0 unhealthy d/yr today · 0 by 30 yrs out
Nearby sold comps map
Loading sold comps map…
Walkable amenities ~0.75 mi
Loading nearby amenities…
Taxation est. · year 1
- Rental income
- $21,000
- − Mortgage interest
- −$10,307
- − Property taxes
- −$2,760
- − Insurance
- −$920
- − Repairs & maintenance
- −$1,680
- − Management
- −$1,680
- − Depreciation
- −$5,353
- Taxable loss
- −$1,700
- Est. tax savings @ 24.0%
- +$408
- After-tax cash flow
- $1,739/yr
For passive investors: Depreciation is non-cash, so a rental often shows a tax loss while cash-flowing — sheltering income. Rental losses are passive: they offset passive income freely, and up to $25,000/yr can offset ordinary (W-2) income if you actively participate and your MAGI is under $100k (phasing out to $0 by $150k); unused losses carry forward. On sale, claimed depreciation is recaptured at up to 25%, and gains may owe capital-gains tax (a 1031 exchange can defer both). Figures are a year-1 estimate at your 24.0% rate — not tax advice; consult a CPA.
Schools (NCES district)
- District
- Humboldt City Schools
- NCES district ID
- 4701950
- Math proficiency
- 4% ▼ -11.00%
- Reading proficiency
- 9% ▼ -6.00%
- Median HH income
- $30,717
- Composite
- 4.86/100
- National rank
- #10042
- State rank
- #138 of 139 in TN
Livability — Humboldt
- Score
- 59/100
- State rank
- #289
- US rank
- #20318
Category grades
Schools grade is shown separately in the Schools card above.
Census & demographics
- Census place
- Humboldt, TN
- City population
- 15,672
- Population (ZIP)
- 15,672
Population outlook (Gibson County) Hauer SSP2
- Today (2025)
- 48,793 people
- By 2030
- 48,221 · -1.2%
- By 2040
- 46,793 · -4.1%
- By 2050
- 44,909 · -8.0%
- By 2075
- 40,191 · -17.6%
- By 2100
- 33,574 · -31.2%
Race, ethnicity, and origin ACS 2023
- Neighborhood character
- Predominantly White (65%)
- Race & ethnicity
- White 65% Black 23% Two or more races 6% Hispanic / Latino 5% Native American 1%
- Hispanic origin (detail)
- Mexican 5%
- Common ancestry
- Serbian 2% Italian 1% Lithuanian 1%
- Foreign-born
- 3% · Canada
- Languages at home
- 94% English-only · Spanish 5% Other Indo-European 1%
Political lean MEDSL · Gibson
- 2024 margin
- Solid R (+52.0) · D 23.6% · R 75.5%
- 2008→2024 swing
- -23.2pp toward R · 2008: -28.8pp · 2024: -52.0pp
- All cycles
- 2024: R+52.0 2020: R+47.0 2016: R+43.8 2012: R+32.1 2008: R+28.8
Not yet ingested
- Civics
- —
Market trends
- HPI YoY
- ▼ -45.61%
- Current HPI
- 206.7365
- Rent YoY
- —
- Metro
- —
- State GDP YoY
- ▲ 2.78%
- F500 in state
- 22
Industry mix (Fortune 500 HQ in TN)
| Industry | F500 HQs | Revenue |
|---|---|---|
| Healthcare | 3 | $91B |
|
||
| Retail | 3 | $72B |
|
||
| Transportation / Logistics | 1 | $88B |
|
||
| Paper / Packaging | 1 | $19B |
|
||
| Insurance | 1 | $13B |
|
||
| Energy | 1 | $12B |
|
||
Price history
+360.0% since first listed7 events — show timeline
- 2026-05-15 Listed $184,000 CWTAR
- 2022-08-25 Sold (Public Records) $152,500 Public Records
- 2022-08-23 Sold (MLS) $152,500 CWTAR
- 2022-05-17 Listed $159,900 CWTAR
- 2016-03-04 Sold (Public Records) $100,000 Public Records
- 2016-03-01 Listed $40,000 CWTAR
- 2016-03-01 Sold (MLS) $40,000 CWTAR
Property tax history
-8.7%/yrLatest (2025): $353 · +0.0% YoY. Source: county tax records.
Cash-flow waterfall
monthlySold comps — $/sqft
last 12 mo · ≤1 miLoading sold comps…