 Duplex
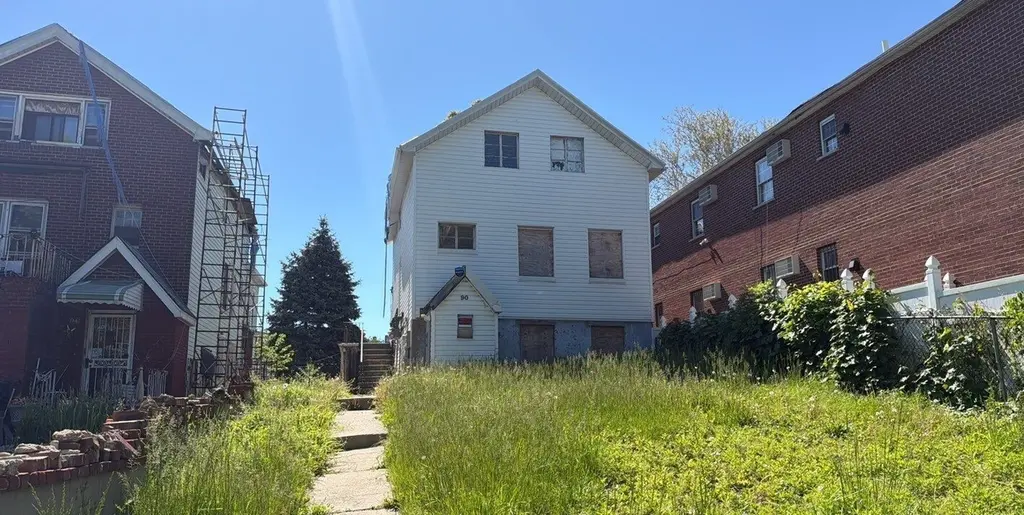
90 Jackie Robinson Pkwy · New York, NY
Flood risk 1/10 · Minimal
- FEMA flood zone
- X (unshaded)
- Chance of flooding over 30 yrs
- 0.0%
- Est. flood insurance / yr
- $507 – $1,088
Fire risk 2/10 · Minimal
- Est. fire insurance / yr
- $691 – $1,283
Heat risk 6/10 · Moderate
- Hot days now (above 99°F)
- 7 days/yr
- Hot days in 30 yrs
- 15 days/yr
Wind risk 6/10 · Moderate
- Chance of severe wind over 30 yrs
- 39.0%
Air-quality risk 5/10 · Moderate
- Unhealthy air days now
- 6 days/yr
- Unhealthy air days in 30 yrs
- 8 days/yr
Risk factors via First Street. Map © Google.
Why this score? — see what drove the B+ grade
The composite is a weighted blend of 9 inputs, each scored 0–100. Each bar is that input's sub-score; the figure is the points it added to the 100-point composite (weight × sub-score).
- Cash flow +27.8/30.0
- ARV discount +15.0/15.0
- DSCR +9.8/10.0
- 1% rule +7.6/10.0
- Schools +5.0/10.0
- Rent growth +3.8/5.0
- Livability +3.8/5.0
- Condition / age +2.5/5.0
- Appreciation +0.0/10.0
$519,900
🖨 Deal sheet 📄 Offer letter ✓ Due diligence
Multi-family units
County records classify this as Multi-Family (2-4 Unit). Listing-text estimate: 2 units. confirmed
Listing remarks MLS
Free-standing 2-unit dwelling on an oversized parcel with off-street parking in a 1 car, detached garage, and exceptional potential. Location provides close proximity to many area amenities, including parks, transportation, stores, eateries, and more.
Key facts
- Transportation
- Parks
- Off-street parking
Tags
Property features AI
Exterior
- Parking: Detached carport; 1-car garage
- Utilities: Sewer: Other; Utilities: See remarks
- Home design: Duplex; Fixer condition
- Construction: Frame construction
- Exterior features: Back yard; Front yard; Near public transit; Near schools; Near shops; Not waterfront
Interior
- Bedrooms: Two 2-bedroom units
- Flooring: Tile flooring
- Bathrooms: Three full bathrooms
- Heating & cooling: Natural gas heating; Steam heating; No central cooling
- Interior features: First-floor bedroom; First-floor full bathroom; Full basement; Deck
Neighborhood map
What this means for you Summary
Snapshot
- This is a 2 × 2-bed/1.5-bath units multifamily listed at $520k.
Deal economics
- At list price, monthly cash flow is $2k ($19k/yr) — positive. Per door: $794/mo.
- The deal already cash-flows at list — no discount required.
- Meets the 1% rule at list price ($7k rent vs $520k).
- Recommended offer: $504k (3.0% below list) — sets the bar for market timing.
- Cap rate 10.0% vs local median 2.6% in New York — top-decile yield for the area; either an underpriced asset or a hidden risk that comps aren't pricing in. Stress-test before assuming the spread holds.
Location & tenants
- Location reads 75/100 on livability (#268 in NY, #4,188 nationally) — a middle-class / working-renter tenant base. Strengths: amenities A+, commute A+, health & safety A; Watch: crime F, cost of living F.
- Market conditions: Rents rising fast (+5.3%/yr); 251 active listings in the ZIP; 2 comparable units currently listed for rent nearby; 10,063 units permitted in Kings County in 2024 (9,789 in 5+ unit buildings).
- At $6,559/mo this rent would consume 139% of the median local household income ($57k/yr) (locally 7510% of renters already pay >50% of income on rent) — very limited rent-growth headroom before tenants either downsize or default.
Forward outlook
- Local home prices are declining (-3.0%/yr); year-one equity from $4k of loan paydown is wiped out by about $16k of value loss. Plan a longer hold.
- Kings County population projected at +13% by 2050 — modest demand growth; plan on rents tracking national, not racing it.
- At projected returns (-3.0% appreciation + 5.3% rent growth), your $146k cash investment doubles in ~8 years — after that, you're playing with house money.
Negotiation context
- It's been on market 34 days — a 3% lower offer ($504k) is reasonable based on typical stale-listing flexibility.
- 9 sale attempts since 9y ago with the ask held roughly flat each time — persistent listings suggest the price (not the market) is what's stuck; bring a comps-based counter.
Risks & watch-outs
- Watch-outs: built in 1925 — expect roof / HVAC / electrical / plumbing capex.
- Climate carrying-cost: major wind risk, 39% chance of damaging wind over 30y; extreme-heat days projected 7→15/yr by 2055 (HVAC capex compounding) — expect insurance premiums to compound above CPI over the hold.
Questions for the listing agent
- It's been on market 34 days. Have you received any prior offers? Is the seller open to a 3% concession, seller financing, or rate buy-down credit?
- Can we see the unit-by-unit rent roll, current vacancy, and any below-market leases? What's the average tenancy length?
- What capital expenditures (roof, boiler, parking lot, exteriors) have been made in the last 5 years, and what's planned in the next 2?
- Built in 1925 — when were the roof, HVAC, electrical panel, plumbing, and water heater last replaced?
- Is there a deadline driving the sale (1031 exchange, divorce, estate, relocation)? That informs how much negotiation room exists.
- Schools are B-rated — typically a magnet for longer-tenancy family renters. What's the average tenant stay here, and is there a school-zone premium baked into asking?
- Crime grade is F in this area — have there been break-ins, vandalism, or insurance claims at this property in the last 3 years? What carrier currently insures it and at what premium?
- What's the average days-on-market for RENTAL listings here right now (not sales)? A rising rental-DOM trend means longer vacancies and softer asking-rent achievability than the comps imply.
- What's the recent tenant-quality profile in this submarket — average credit score on applications, eviction rate, late-payment / NSF rate, and stable-employment percentage? A property-management company in the area should have these aggregated.
- How much new apartment / multifamily construction is in the pipeline within 1–3 miles? Heavy new supply (>2% of stock underway) typically softens rents 12–24 months out; light construction supports rent growth.
Investment metrics
- 1% rule
- 1.26% ✓
- Cap rate
- 9.96%
- Cash-on-cash
- 13.10%
- DSCR
- 1.58
- GRM
- 6.6
CMA / ARV
- ARV (on-the-fly)
- $868,956
- Comps found
- 9
Show comp detail 9 sales within ~0.75 mi
| Address | Dist | Beds/Ba | Sqft | Sold | Price | $/sf | Match |
|---|---|---|---|---|---|---|---|
| 215 Warwick St | 0.53mi | 5/3.0 (+1) | 1,964 (+3%) | 10mo | $975,000 | $496 | 58 |
| 432 Jamaica Ave | 0.46mi | 5/2.0 (+1) | 2,040 (+7%) | 3mo | $875,000 | $429 | 56 |
| 210 Barbey St | 0.48mi | 5/2.0 (+1) | 1,920 (+0%) | 22mo | $640,000 | $333 | 50 |
| 168 Hull St | 0.74mi | 5/— (+1) | 1,942 (+2%) | 14mo | $1,375,000 | $708 | 46 |
| 115 Cleveland St | 0.50mi | 4/3.5 | 2,168 (+13%) | 8mo | $838,000 | $387 | 46 |
| 148 Somers St | 0.60mi | 5/4.0 (+1) | 1,708 (-11%) | 3mo | $900,000 | $527 | 43 |
| 702 Chauncey St | 0.66mi | 5/3.0 (+1) | 1,800 (-6%) | 15mo | $1,050,000 | $583 | 42 |
| 120 Shepherd Ave | 0.68mi | 5/2.0 (+1) | 2,048 (+7%) | 12mo | $930,000 | $454 | 38 |
| 551 Liberty Ave | 0.58mi | 5/2.0 (+1) | 1,676 (-12%) | 12mo | $672,001 | $401 | 33 |
Match score weights: distance 35% · size 25% · config 20% · recency 20%. Top-matched comps best support the ARV.
Projected returns pro-forma
-3.0% appreciation · 5.29% rent growth · sell at horizon
- IRR
- 5.6%
- Equity multiple
- 1.22×
- Total profit
- $32,495
- Equity at exit
- $77,519
- IRR
- 17.0%
- Equity multiple
- 2.55×
- Total profit
- $225,467
- Equity at exit
- $44,951
Cash invested: $145,572 (down + closing). Projections, not guarantees.
Landlord ↔ Tenant lean methodology
- Overall (CITY)
- 0 Strongly Tenant-Friendly
- State New York
- 15 Strongly Tenant-Friendly · D+10
- County
- — inherits STATE
- City New York
- 0 Strongly Tenant-Friendly · D+34
ZIP-level market 11207
- Home prices YoY
- -26.3%
- Rents YoY
- 5.3%
- Active inventory
- 251
- Price-to-rent
- 13.2×
Monthly cashflow live
- Estimated rent
- $6,559 high interval (Pro) →
- Mortgage (P&I)
- −$2,726
- Tax est. 1.5%
- −$650 /mo · $7,798/yr
- Insurance
- −$217
- HOA
- −$0
- Vacancy / Maint / Mgmt
- −$1,377
- Net cashflow
- $1,589
Break-even live
2-unit breakdown (identical units grouped — click to expand)
| Units | Beds | Baths | Est. rent |
|---|---|---|---|
| 2× units | 2 | 1.5 | $6,558 |
| #1 | 2 | 1.5 | $3,279 |
| #2 | 2 | 1.5 | $3,279 |
| Total (2 units) | $6,559 | ||
UW: 25.0% down · 7.5% · 30yr · 1.5% tax · 5.0% vac · 8.0% maint · 8.0% mgmt
Financing live
Cash to close
- Down payment
- $129,975
- Closing costs
- $15,597
- Reserves months
- —
- Total cash needed
- —
Loan-product check · same deal, 3 products live
Conventional
25% down · 7.5% · 30yr
- Down + closing
- —
- Monthly P&I
- —
- Monthly cashflow
- —
- DSCR
- —
- Eligible?
- —
Personal DTI + credit; lowest rate.
DSCR
20% down · 8.5% · 30yr
- Down + closing
- —
- Monthly P&I
- —
- Monthly cashflow
- —
- DSCR
- —
- Eligible?
- —
No personal income docs; deal must DSCR.
Hard money
10% down · 12.0% · 12mo
- Down + closing
- —
- Monthly P&I
- —
- Monthly cashflow
- —
- DSCR
- —
- Eligible?
- —
Short-term bridge; refi at stabilization.
Rent comps 2 comps
| Address | Beds | Baths | Sqft | Rent | $/sqft | DOM | Units | Dist |
|---|---|---|---|---|---|---|---|---|
| 60-08 78th Ave Unit 2 Glendale, NY | 3.0 | 1.0 | 2200 | $3,099 | $1.41 | 5d | 1 | 0.90mi |
| 358 Irving Ave Brooklyn, NY | 5.0 | 4.0 | 844 | $1,500 | $1.78 | 20d | 1 | 1.33mi |
Listing history 36 events
-
2026-06-18days on market $519,900 Active 34 DOM
-
2026-06-17days on market $519,900 Active 33 DOM
-
2026-06-16days on market $519,900 Active 32 DOM
-
2026-06-15days on market $519,900 Active 31 DOM
-
2026-06-13days on market $519,900 Active 29 DOM
-
2026-06-10days on market $519,900 Active 25 DOM
-
2026-06-08days on market $519,900 Active 24 DOM
-
2026-06-08days on market $519,900 Active 23 DOM
-
2026-06-04days on market $519,900 Active 20 DOM
-
2026-06-03days on market $519,900 Active 19 DOM
-
2026-06-02days on market $519,900 Active 18 DOM
-
2026-06-01days on market $519,900 Active 17 DOM
-
2026-05-31days on market $519,900 Active 16 DOM
-
2026-05-15$519,900 Active 251-char remark
Show marketing remark (251 chars)
Free-standing 2-unit dwelling on an oversized parcel with off-street parking in a 1 car, detached garage, and exceptional potential. Location provides close proximity to many area amenities, including parks, transportation, stores, eateries, and more.
-
2026-05-14$519,900 Active
-
2026-04-23historical
-
2026-04-17status Active
-
2025-12-23status Pending
-
2025-09-02status Active
-
2025-09-02historical
-
2025-08-22price $539,900
-
2025-08-13price $539,900
-
2025-07-17price $559,900
-
2025-07-17price $559,900
-
2025-05-08price $574,900
-
2025-05-08price $574,900
-
2025-03-31status Active
-
2025-03-29historical
-
2025-03-13price $589,900
-
2025-02-19status Active
-
2024-10-25status Pending
-
2024-09-16price $599,900
-
2024-08-09$629,900 Active
-
2021-08-26$600,000 Active
-
2017-11-22historical
-
2017-05-22$250,000 New
ⓘ Source: listings_history table (triggers on properties + properties_extension) + one-shot
backfill from property_details.listing_events for pre-trigger history.
Climate risk First Street
- Flood 1/10 Low FEMA zone X (unshaded) · 0% chance over 30 yrs
- Wildfire 2/10 Low
- Heat 6/10 Major 7 d/yr ≥99°F today · 15 d/yr by 30 yrs out
- Wind 6/10 Major 39% chance of damaging wind over 30 yrs
- Air quality 5/10 Major 6 unhealthy d/yr today · 8 by 30 yrs out
Nearby sold comps map
Loading sold comps map…
Walkable amenities ~0.75 mi
Loading nearby amenities…
Taxation est. · year 1
- Rental income
- $78,708
- − Mortgage interest
- −$29,122
- − Property taxes
- −$7,798
- − Insurance
- −$2,600
- − Repairs & maintenance
- −$6,297
- − Management
- −$6,297
- − Depreciation
- −$15,124
- Taxable income
- $11,470
- Est. tax owed @ 24.0%
- −$2,753
- After-tax cash flow
- $16,312/yr
For passive investors: Depreciation is non-cash, so a rental often shows a tax loss while cash-flowing — sheltering income. Rental losses are passive: they offset passive income freely, and up to $25,000/yr can offset ordinary (W-2) income if you actively participate and your MAGI is under $100k (phasing out to $0 by $150k); unused losses carry forward. On sale, claimed depreciation is recaptured at up to 25%, and gains may owe capital-gains tax (a 1031 exchange can defer both). Figures are a year-1 estimate at your 24.0% rate — not tax advice; consult a CPA.
Schools (NCES district)
No district data.
Livability — New York
- Score
- 75/100
- State rank
- #268
- US rank
- #4188
Category grades
Schools grade is shown separately in the Schools card above.
Census & demographics
- Census place
- New York, NY
- County
- Kings County · 2,614,986 people
- City population
- 7,731,280
- Metro
- New York-Newark-Jersey City, NY-NJ-PA
- Population (ZIP)
- 93,198
- Household income
- $56,523
- Rent vs Own
- Severe rent burden
- 7510.0
Population outlook (Kings County) Hauer SSP2
- Today (2025)
- 2,847,441 people
- By 2030
- 2,937,006 · +3.1%
- By 2040
- 3,095,491 · +8.7%
- By 2050
- 3,228,968 · +13.4%
- By 2075
- 3,321,723 · +16.7%
- By 2100
- 3,111,387 · +9.3%
Race, ethnicity, and origin ACS 2023
- Neighborhood character
- Diverse neighborhood (Simpson 0.59)
- Race & ethnicity
- Black 54% Hispanic / Latino 33% Two or more races 10% White 5% Asian 2%
- Hispanic origin (detail)
- Mexican 3% Puerto Rican 11% Dominican 11%
- Common ancestry
- Hispanic 1% Swiss 1%
- Foreign-born
- 31% · Canada, Mexico, Jamaica
- Languages at home
- 67% English-only · Spanish 27% French/Haitian/Cajun 2% Other Indo-European 1%
Political lean MEDSL · Kings
- 2024 margin
- Solid D (+44.0) · D 72.0% · R 28.0%
- 2008→2024 swing
- -15.5pp toward R · 2008: 59.4pp · 2024: 44.0pp
- All cycles
- 2024: D+44.0 2020: D+54.8 2016: D+61.8 2012: D+63.9 2008: D+59.4
Not yet ingested
- Civics
- —
Market trends
- HPI YoY
- ▼ -138.76%
- Current HPI
- 388.434
- Rent YoY
- ▲ 5.29%
- Metro
- New York-Newark-Jersey City, NY-NJ-PA
- State GDP YoY
- ▲ 2.60%
- F500 in state
- 92
Industry mix (Fortune 500 HQ in NY)
| Industry | F500 HQs | Revenue |
|---|---|---|
| Financial Services | 10 | $950B |
|
||
| Consumer Goods | 9 | $162B |
|
||
| Insurance | 4 | $225B |
|
||
| Telecommunications | 2 | $144B |
|
||
| Pharmaceuticals | 2 | $112B |
|
||
| Media / Entertainment | 2 | $69B |
|
||
Price history
+108.0% since first listed23 events — show timeline
- 2026-05-15 Listed $519,900 RLS at REBNY
- 2026-05-14 Listed $519,900 OneKey® MLS as Distributed by MLS Grid
- 2026-04-23 Listing Removed — OneKey® MLS as Distributed by MLS Grid
- 2026-04-17 Relisted — OneKey® MLS as Distributed by MLS Grid
- 2025-12-23 Pending — OneKey® MLS as Distributed by MLS Grid
- 2025-09-02 Relisted — OneKey® MLS as Distributed by MLS Grid
- 2025-09-02 Listing Removed — OneKey® MLS as Distributed by MLS Grid
- 2025-08-22 Price Changed $539,900 BNYMLS
- 2025-08-13 Price Changed $539,900 OneKey® MLS as Distributed by MLS Grid
- 2025-07-17 Price Changed $559,900 BNYMLS
- 2025-07-17 Price Changed $559,900 OneKey® MLS as Distributed by MLS Grid
- 2025-05-08 Price Changed $574,900 BNYMLS
- 2025-05-08 Price Changed $574,900 OneKey® MLS as Distributed by MLS Grid
- 2025-03-31 Relisted — OneKey® MLS as Distributed by MLS Grid
- 2025-03-29 Listing Removed — OneKey® MLS as Distributed by MLS Grid
- 2025-03-13 Price Changed $589,900 OneKey® MLS as Distributed by MLS Grid
- 2025-02-19 Relisted — OneKey® MLS as Distributed by MLS Grid
- 2024-10-25 Pending — OneKey® MLS as Distributed by MLS Grid
- 2024-09-16 Price Changed $599,900 OneKey® MLS as Distributed by MLS Grid
- 2024-08-09 Listed $629,900 OneKey® MLS as Distributed by MLS Grid
- 2021-08-26 Listed $600,000 RLS at REBNY
- 2017-11-22 Listing Removed — OneKey® MLS as Distributed by MLS Grid
- 2017-05-22 Listed $250,000 OneKey® MLS as Distributed by MLS Grid
Cash-flow waterfall
monthlySold comps — $/sqft
last 12 mo · ≤1 miLoading sold comps…