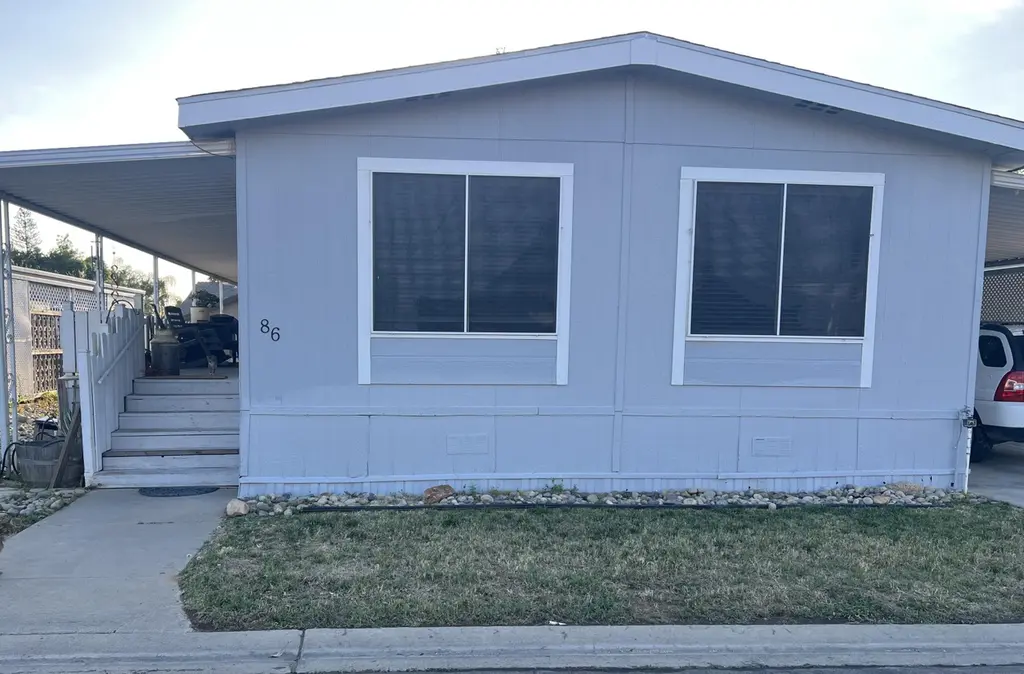
314 N Albert Ave #86 · Exeter, CA
Flood risk 3/10 · Minor
- FEMA flood zone
- X (shaded)
- Chance of flooding over 30 yrs
- 0.16%
- Est. flood insurance / yr
- $507 – $1,088
Fire risk 8/10 · Major
- Est. fire insurance / yr
- $659 – $1,223
Heat risk 8/10 · Major
- Hot days now (above 106°F)
- 7 days/yr
- Hot days in 30 yrs
- 17 days/yr
Wind risk 1/10 · Minimal
- Chance of severe wind over 30 yrs
- —
Air-quality risk 10/10 · Severe
- Unhealthy air days now
- 50 days/yr
- Unhealthy air days in 30 yrs
- 53 days/yr
Risk factors via First Street. Map © Google.
Why this score? — see what drove the B grade
The composite is a weighted blend of 9 inputs, each scored 0–100. Each bar is that input's sub-score; the figure is the points it added to the 100-point composite (weight × sub-score).
- Cash flow +30.0/30.0
- ARV discount +11.0/15.0
- 1% rule +10.0/10.0
- DSCR +10.0/10.0
- Schools +3.4/10.0
- Livability +2.8/5.0
- Rent growth +2.5/5.0
- Condition / age +2.5/5.0
- Appreciation +0.0/10.0
$69,000
🖨 Deal sheet 📄 Offer letter ✓ Due diligence
Listing remarks
Welcome to this well-maintained 2-bedroom, 2-bath manufactured home located in a desirable senior community in Exeter. Offering approximately 1,440 sq ft of comfortable living space, this home features a spacious layout with a large indoor laundry room for added convenience. Enjoy peaceful mornings in the living room, where expansive windows frame beautiful views of the Sequoia Mountains—perfect for sipping your coffee and taking in the scenery. The exterior has been recently painted, giving the home a fresh, updated look. Refrigerator, washer, and dryer are all included, making this home move-in ready. Don't miss this opportunity to enjoy low-maintenance living in a welcoming communi
Key facts
- Move-in ready
- Expansive windows
- Built 1978
Tags
Property features AI
Finance
- HOA & community: Located in a senior community
Exterior
- Parking: Carport
- Utilities: Public water; Public sewer; Electricity connected; Natural gas connected / available; Cable connected
- Home design: Manufactured home (double wide) located in a park; Faces east
- Construction: Composition/shingle roof; Aluminum skirting; Mobile home dimensions approximately 12' x 60'; Model HJ
- Exterior features: Covered patio/deck and front porch; Awnings; Exterior storage; Sprinklers in front; Has a view
Interior
- Kitchen: Gas oven; Gas range; Free-standing gas range; Microwave; Refrigerator; Free-standing refrigerator; Dishwasher (disposal listed separately)
- Bathrooms: 2 full bathrooms
- Heating & cooling: Central heating; Hot water heating; Central air conditioning; Ceiling fans for cooling
- Interior features: Ceiling fans; Exhaust/vented fans; Disposal; Range hood; Water heater
- Laundry & utility: Washer and dryer (inside laundry)
Neighborhood map
What this means for you Summary
Snapshot
- This is a 2-bed/2.0-bath land listed at $69k.
Deal economics
- At list price, monthly cash flow is $878 ($11k/yr) — positive.
- The deal already cash-flows at list — no discount required.
- Meets the 1% rule at list price ($2k rent vs $69k).
- Recommended offer: $67k (3.0% below list) — sets the bar for market timing.
- Cap rate 21.6% vs local median 3.0% in Exeter — top-decile yield for the area; either an underpriced asset or a hidden risk that comps aren't pricing in. Stress-test before assuming the spread holds.
Location & tenants
- Location reads 55/100 on livability (#845 in CA) — a working-class tenant base; expect higher turnover. Strengths: housing A; Watch: crime C-, schools D, amenities F.
- Exeter Unified (suburban): math 30% / reading 44% proficiency, ranked #832 of 1,400 in CA (top 59%) — families likely to look elsewhere, expect single-tenant / working-renter base with shorter leases.
- Market conditions: 97 active listings in the ZIP; 7 comparable units currently listed for rent nearby; rentals at typical pace (median 21d on market — plan ~3-4 weeks tenant-placement turnaround); 43% of comp listings sitting > 30 days — soft ceiling on asking rent; 1,447 units permitted in Tulare County in 2024 (307 in 5+ unit buildings).
Forward outlook
- Local home prices are declining (-3.0%/yr); year-one equity from $477 of loan paydown is wiped out by about $2k of value loss. Plan a longer hold.
- Tulare County population projected at +10% by 2050 — modest demand growth; plan on rents tracking national, not racing it.
- At projected returns (-3.0% appreciation + 3.0% rent growth), your $19k cash investment doubles in ~3 years — after that, you're playing with house money.
Negotiation context
- It's been on market 34 days — a 3% lower offer ($67k) is reasonable based on typical stale-listing flexibility.
- 2 sale attempts with the ask held roughly flat each time — persistent listings suggest the price (not the market) is what's stuck; bring a comps-based counter.
Risks & watch-outs
- Climate carrying-cost: severe wildfire risk; extreme-heat days projected 7→17/yr by 2055 (HVAC capex compounding) — expect insurance premiums to compound above CPI over the hold.
Questions for the listing agent
- It's been on market 34 days. Have you received any prior offers? Is the seller open to a 3% concession, seller financing, or rate buy-down credit?
- Built in 1978 — when were the roof, HVAC, electrical panel, plumbing, and water heater last replaced?
- Is there a deadline driving the sale (1031 exchange, divorce, estate, relocation)? That informs how much negotiation room exists.
- Schools are D-rated, which usually means shorter tenancies and higher turnover. Who's the typical renter profile here, and what's been the actual vacancy rate?
- What's the average days-on-market for RENTAL listings here right now (not sales)? A rising rental-DOM trend means longer vacancies and softer asking-rent achievability than the comps imply.
- What's the recent tenant-quality profile in this submarket — average credit score on applications, eviction rate, late-payment / NSF rate, and stable-employment percentage? A property-management company in the area should have these aggregated.
- How much new for-sale + rental construction is in the pipeline within 1–3 miles? Heavy new supply typically softens prices + rents 12–24 months out; constrained supply supports both.
Investment metrics
- 1% rule
- 2.49% ✓
- Cap rate
- 21.57%
- Cash-on-cash
- 54.55%
- DSCR
- 3.43
- GRM
- 3.4
CMA / ARV
- ARV (median comp)
- $74,800
- List price
- $69,000
- Delta
- -7.75%
- Verdict
- FAIR
- Comps
- 8 within 1.0 mi
Projected returns pro-forma
-3.0% appreciation · 3.0% rent growth · sell at horizon
- IRR
- 52.8%
- Equity multiple
- 3.32×
- Total profit
- $44,783
- Equity at exit
- $10,288
- IRR
- 58.0%
- Equity multiple
- 6.75×
- Total profit
- $111,131
- Equity at exit
- $5,966
Cash invested: $19,320 (down + closing). Projections, not guarantees.
Landlord ↔ Tenant lean methodology
- Overall (STATE)
- 18 Strongly Tenant-Friendly
- State California
- 18 Strongly Tenant-Friendly · D+13
- County
- — inherits STATE
- City
- — inherits STATE
ZIP-level market 93221
- Active inventory
- 97
- Price-to-rent
- 3.4×
Monthly cashflow live
- Estimated rent
- $1,715 high interval (Pro) →
- Mortgage (P&I)
- −$362
- Tax est. 1.5%
- −$86 /mo · $1,035/yr
- Insurance
- −$29
- HOA
- −$0
- Vacancy / Maint / Mgmt
- −$360
- Net cashflow
- $878
Break-even live
UW: 25.0% down · 7.5% · 30yr · 1.5% tax · 5.0% vac · 8.0% maint · 8.0% mgmt
Financing live
Cash to close
- Down payment
- $17,250
- Closing costs
- $2,070
- Reserves months
- —
- Total cash needed
- —
Loan-product check · same deal, 3 products live
Conventional
25% down · 7.5% · 30yr
- Down + closing
- —
- Monthly P&I
- —
- Monthly cashflow
- —
- DSCR
- —
- Eligible?
- —
Personal DTI + credit; lowest rate.
DSCR
20% down · 8.5% · 30yr
- Down + closing
- —
- Monthly P&I
- —
- Monthly cashflow
- —
- DSCR
- —
- Eligible?
- —
No personal income docs; deal must DSCR.
Hard money
10% down · 12.0% · 12mo
- Down + closing
- —
- Monthly P&I
- —
- Monthly cashflow
- —
- DSCR
- —
- Eligible?
- —
Short-term bridge; refi at stabilization.
Rent comps 7 comps
| Address | Beds | Baths | Sqft | Rent | $/sqft | DOM | Units | Dist |
|---|---|---|---|---|---|---|---|---|
| 821 Woodland Ave Exeter, CA | 3.0 | 2.0 | 1539 | $2,000 | $1.30 | 21d | 1 | 0.14mi |
| 310 N Orange Ave Unit 4 Exeter, CA | 2.0 | 1.0 | 900 | $1,175 | $1.31 | 43d | 1 | 0.26mi |
| 310 N Orange Ave Unit 12 Exeter, CA | 2.0 | 1.0 | 900 | $1,175 | $1.31 | 13d | 1 | 0.26mi |
| 1303 Vine St Exeter, CA | 3.0 | 2.0 | 1362 | $1,895 | $1.39 | 43d | 1 | 0.31mi |
| 1339 Vine St Exeter, CA | 3.0 | 2.0 | 1552 | $1,895 | $1.22 | 21d | 1 | 0.32mi |
| 351 N D St Exeter, CA | 3.0 | 1.0 | 961 | $1,395 | $1.45 | 43d | 1 | 0.60mi |
| 261 C St Unit 263C Exeter, CA | 2.0 | 1.0 | 987 | $1,650 | $1.67 | 13d | 1 | 0.91mi |
Listing history 18 events
-
2026-06-18days on market $69,000 Active 34 DOM
-
2026-06-17days on market $69,000 Active 33 DOM
-
2026-06-16days on market $69,000 Active 32 DOM
-
2026-06-15days on market $69,000 Active 31 DOM
-
2026-06-14days on market $69,000 Active 29 DOM
-
2026-06-13days on market $69,000 Active 28 DOM
-
2026-06-10days on market $69,000 Active 26 DOM
-
2026-06-09days on market $69,000 Active 25 DOM
-
2026-06-08days on market $69,000 Active 24 DOM
-
2026-06-07days on market $69,000 Active 23 DOM
-
2026-06-05days on market $69,000 Active 20 DOM
-
2026-06-03days on market $69,000 Active 19 DOM
-
2026-06-02days on market $69,000 Active 18 DOM
-
2026-06-01days on market $69,000 Active 17 DOM
-
2026-05-31days on market $69,000 Active 16 DOM
-
2026-05-30days on market $69,000 Active 15 DOM
-
2026-05-15status Pending 702-char remark
-
2026-04-30$69,000 Active 702-char remark
ⓘ Source: listings_history table (triggers on properties + properties_extension) + one-shot
backfill from property_details.listing_events for pre-trigger history.
Climate risk First Street
- Flood 3/10 Moderate FEMA zone X (shaded) · 16% chance over 30 yrs
- Wildfire 8/10 Severe
- Heat 8/10 Severe 7 d/yr ≥106°F today · 17 d/yr by 30 yrs out
- Wind 1/10 Low
- Air quality 10/10 Extreme 50 unhealthy d/yr today · 53 by 30 yrs out
Nearby sold comps map
Loading sold comps map…
Walkable amenities ~0.75 mi
Loading nearby amenities…
Taxation est. · year 1
- Rental income
- $20,584
- − Mortgage interest
- −$3,865
- − Property taxes
- −$1,035
- − Insurance
- −$345
- − Repairs & maintenance
- −$1,647
- − Management
- −$1,647
- − Depreciation
- −$2,007
- Taxable income
- $10,038
- Est. tax owed @ 24.0%
- −$2,409
- After-tax cash flow
- $8,130/yr
For passive investors: Depreciation is non-cash, so a rental often shows a tax loss while cash-flowing — sheltering income. Rental losses are passive: they offset passive income freely, and up to $25,000/yr can offset ordinary (W-2) income if you actively participate and your MAGI is under $100k (phasing out to $0 by $150k); unused losses carry forward. On sale, claimed depreciation is recaptured at up to 25%, and gains may owe capital-gains tax (a 1031 exchange can defer both). Figures are a year-1 estimate at your 24.0% rate — not tax advice; consult a CPA.
Schools (NCES district)
- District
- Exeter Unified
- NCES district ID
- 0601423
- Math proficiency
- 30% ▼ -2.00%
- Reading proficiency
- 44% ▼ -1.00%
- Median HH income
- $46,404
- Composite
- 34.19/100
- National rank
- #10261
- State rank
- #832 of 1400 in CA
Livability — Exeter
- Score
- 55/100
- State rank
- #845
- US rank
- #23297
Category grades
Schools grade is shown separately in the Schools card above.
Census & demographics
- Census place
- Exeter, CA
- Population (ZIP)
- 14,399
Population outlook (Tulare County) Hauer SSP2
- Today (2025)
- 484,681 people
- By 2030
- 496,241 · +2.4%
- By 2040
- 518,507 · +7.0%
- By 2050
- 534,920 · +10.4%
- By 2075
- 548,417 · +13.2%
- By 2100
- 513,085 · +5.9%
Race, ethnicity, and origin ACS 2023
- Neighborhood character
- Majority Hispanic (53%)
- Race & ethnicity
- Hispanic / Latino 53% White 42% Two or more races 16% Asian 2%
- Hispanic origin (detail)
- Mexican 50% Puerto Rican 1%
- Common ancestry
- Slovak 1% Portuguese 1% Russian 1%
- Foreign-born
- 11% · Canada
- Languages at home
- 69% English-only · Spanish 28% Tagalog/Filipino 1% Other Indo-European 1%
Political lean MEDSL · Tulare
- 2024 margin
- Strong R (+20.7) · D 38.5% · R 59.2% · Other 2.3%
- 2008→2024 swing
- -5.4pp toward R · 2008: -15.3pp · 2024: -20.7pp
- All cycles
- 2024: R+20.7 2020: R+7.8 2016: R+12.1 2012: R+17.8 2008: R+15.3
Not yet ingested
- Civics
- —
Market trends
- HPI YoY
- ▼ -187.00%
- Current HPI
- 345.1725
- Rent YoY
- —
- Metro
- —
- State GDP YoY
- ▲ 3.21%
- F500 in state
- 116
Industry mix (Fortune 500 HQ in CA)
| Industry | F500 HQs | Revenue |
|---|---|---|
| Technology | 27 | $1,492B |
|
||
| Financial Services | 3 | $174B |
|
||
| Retail | 3 | $44B |
|
||
| Insurance | 3 | $26B |
|
||
| Media / Entertainment | 2 | $115B |
|
||
| Pharmaceuticals / Biotech | 2 | $62B |
|
||
Price history
3 events — show timeline
- 2026-05-29 Relisted — TCMLS
- 2026-05-15 Pending — TCMLS
- 2026-04-30 Listed $69,000 TCMLS
Property tax history
-1.9%/yrLatest (2021): $113 · -2.3% YoY. Source: county tax records.
Cash-flow waterfall
monthlySold comps — $/sqft
last 12 mo · ≤1 miLoading sold comps…