 Duplex
3728 N 18th St Unit 3728A · Milwaukee, WI
Flood risk 6/10 · Moderate
- FEMA flood zone
- X (unshaded)
- Chance of flooding over 30 yrs
- 0.68%
- Est. flood insurance / yr
- $473 – $860
Fire risk 1/10 · Minimal
- Est. fire insurance / yr
- $636 – $1,182
Heat risk 2/10 · Minimal
- Hot days now (above 98°F)
- 7 days/yr
- Hot days in 30 yrs
- 13 days/yr
Wind risk 2/10 · Minimal
- Chance of severe wind over 30 yrs
- —
Air-quality risk 3/10 · Minor
- Unhealthy air days now
- 3 days/yr
- Unhealthy air days in 30 yrs
- 4 days/yr
Risk factors via First Street. Map © Google.
Why this score? — see what drove the A grade
The composite is a weighted blend of 9 inputs, each scored 0–100. Each bar is that input's sub-score; the figure is the points it added to the 100-point composite (weight × sub-score).
- Cash flow +30.0/30.0
- ARV discount +15.0/15.0
- 1% rule +10.0/10.0
- DSCR +10.0/10.0
- Appreciation +10.0/10.0
- Rent growth +4.6/5.0
- Livability +4.0/5.0
- Schools +1.2/10.0
- Condition / age +1.0/5.0
$70,000
🖨 Deal sheet 📄 Offer letter ✓ Due diligence
Multi-family units
County records classify this as Multi-Family (2-4 Unit). Listing-text estimate: 2 units. confirmed
Listing remarks MLS
Attention investors: here's your next value-add project! This duplex property is being sold as-is and is ideal for experienced buyers ready to bring vision and capital. Whether you're using cash or hard money, this one is priced for the potential. Located in a high-demand rental area, this blank slate offers strong upside for those ready to renovate.
Key facts
- 4,356 sq ft lot
- Garage
- Built 1921
Neighborhood map
What this means for you Summary
Snapshot
- This is a 2 × 3-bed/2.0-bath units multifamily listed at $70k. Condition is rated poor.
Deal economics
- At list price, monthly cash flow is $1k ($15k/yr) — positive. Per door: $621/mo.
- The deal already cash-flows at list — no discount required.
- Meets the 1% rule at list price ($2k rent vs $70k).
- Recommended offer: $66k (6.0% below list) — sets the bar for market timing.
- Cap rate 27.6% vs local median 5.1% in Milwaukee — top-decile yield for the area; either an underpriced asset or a hidden risk that comps aren't pricing in. Stress-test before assuming the spread holds.
Location & tenants
- Location reads 81/100 on livability (#55 in WI, #1,534 nationally) — a professional / high-income tenant draw. Strengths: amenities A+, commute A+, cost of living A+; Watch: employment D+, schools F, crime F.
- Milwaukee School District (urban): math 10% / reading 18% proficiency, ranked #337 of 342 in WI (top 98%) — low school quality limits family demand, transient renter base, plan for 1-2y turnover; 77% free/reduced lunch — lower-income household profile, screen leases tightly.
- Market conditions: Rents rising fast (+8.3%/yr); 150 active listings in the ZIP; 2 comparable units currently listed for rent nearby; lower-income renter base — watch delinquency; 1,017 units permitted in Milwaukee County in 2024 (803 in 5+ unit buildings).
- At $2,185/mo this rent would consume 89% of the median local household income ($29k/yr) (locally 2061% of renters already pay >50% of income on rent) — very limited rent-growth headroom before tenants either downsize or default.
Forward outlook
- In year one you build about $7k of equity ($484 loan paydown + $7k appreciation (10.0% local appreciation)).
- Milwaukee County population projected at +4% by 2050 — modest demand growth; plan on rents tracking national, not racing it.
- At projected returns (10.0% appreciation + 8.0% rent growth), your $20k cash investment doubles in ~1 year — after that, you're playing with house money.
- By year 5, paydown + projected appreciation supports a ~$35k cash-out refi (75% LTV) — recoverable capital for the next deal without selling this one.
Negotiation context
- It's been on market 62 days — a 6% lower offer ($66k) is reasonable based on typical stale-listing flexibility.
- 3 sale attempts; this cycle's ask has dropped $10k (12%) from the opening price — seller is motivated, your offer sets the floor, not the list.
Risks & watch-outs
- Watch-outs: built in 1921 — expect roof / HVAC / electrical / plumbing capex.
- Climate carrying-cost: major flood risk — expect insurance premiums to compound above CPI over the hold.
Questions for the listing agent
- It's been on market 62 days. Have you received any prior offers? Is the seller open to a 6% concession, seller financing, or rate buy-down credit?
- Can we see the unit-by-unit rent roll, current vacancy, and any below-market leases? What's the average tenancy length?
- What capital expenditures (roof, boiler, parking lot, exteriors) have been made in the last 5 years, and what's planned in the next 2?
- Have any recent inspections been done? Can we get a copy of the seller's disclosures and any deferred-maintenance estimates?
- Built in 1921 — when were the roof, HVAC, electrical panel, plumbing, and water heater last replaced?
- Why hasn't it sold? Are there any deal-killer items the seller is aware of (foundation, flood, title, zoning, code violations)?
- Is there a deadline driving the sale (1031 exchange, divorce, estate, relocation)? That informs how much negotiation room exists.
- Schools are F-rated, which usually means shorter tenancies and higher turnover. Who's the typical renter profile here, and what's been the actual vacancy rate?
- Crime grade is F in this area — have there been break-ins, vandalism, or insurance claims at this property in the last 3 years? What carrier currently insures it and at what premium?
- What's the average days-on-market for RENTAL listings here right now (not sales)? A rising rental-DOM trend means longer vacancies and softer asking-rent achievability than the comps imply.
- What's the recent tenant-quality profile in this submarket — average credit score on applications, eviction rate, late-payment / NSF rate, and stable-employment percentage? A property-management company in the area should have these aggregated.
- How much new apartment / multifamily construction is in the pipeline within 1–3 miles? Heavy new supply (>2% of stock underway) typically softens rents 12–24 months out; light construction supports rent growth.
Investment metrics
- 1% rule
- 3.12% ✓
- Cap rate
- 27.59%
- Cash-on-cash
- 76.07%
- DSCR
- 4.38
- GRM
- 2.7
CMA / ARV
- ARV (median comp)
- $103,436
- List price
- $70,000
- Delta
- -32.33%
- Verdict
- UNDERPRICED
- Comps
- 20 within 1.0 mi
Show comp detail 12 sales within ~0.75 mi
| Address | Dist | Beds/Ba | Sqft | Sold | Price | $/sf | Match |
|---|---|---|---|---|---|---|---|
| 3607 N 19th St #3609 | 0.14mi | 5/2.0 (-1) | 2,270 (+10%) | 6mo | $213,000 | $94 | 59 |
| 1518 W Ring St | 0.52mi | 6/2.0 | 2,016 (-2%) | 10mo | $33,000 | $16 | 56 |
| 3221 N 20th St Unit 3221A | 0.60mi | 6/2.0 | 2,101 (+2%) | 8mo | $139,000 | $66 | 54 |
| 3611 N 12th St | 0.36mi | 5/2.0 (-1) | 1,933 (-6%) | 9mo | $105,000 | $54 | 52 |
| 3730 N 11th St #3732 | 0.44mi | 5/2.0 (-1) | 2,210 (+7%) | 6mo | $149,000 | $67 | 50 |
| 3407 N 22nd St | 0.45mi | 6/2.0 | 1,842 (-11%) | 10mo | $85,000 | $46 | 45 |
| 3379 N 25th St #3381 | 0.68mi | 6/2.0 | 2,152 (+4%) | 11mo | $60,000 | $28 | 44 |
| 1304 W Ring St Unit 1304A | 0.58mi | 5/2.0 (-1) | 1,851 (-10%) | 1mo | $70,000 | $38 | 42 |
| 1013 W Keefe Ave | 0.53mi | 6/2.0 | 1,800 (-13%) | 10mo | $75,000 | $42 | 38 |
| 3461 N 9th St | 0.59mi | 6/2.0 | 1,829 (-11%) | 9mo | $70,300 | $38 | 37 |
| 3252 N Dr Lester Carter Dr Unit 3252A | 0.68mi | 5/2.0 (-1) | 2,202 (+7%) | 9mo | $135,000 | $61 | 37 |
| 3381 N 26th St #3383 | 0.74mi | 6/2.0 | 2,335 (+13%) | 11mo | $153,500 | $66 | 26 |
Match score weights: distance 35% · size 25% · config 20% · recency 20%. Top-matched comps best support the ARV.
Projected returns pro-forma
10.0% appreciation · 8.0% rent growth · sell at horizon
- IRR
- 90.9%
- Equity multiple
- 7.57×
- Total profit
- $128,833
- Equity at exit
- $63,062
- IRR
- 87.2%
- Equity multiple
- 18.64×
- Total profit
- $345,837
- Equity at exit
- $135,995
Cash invested: $19,600 (down + closing). Projections, not guarantees.
Landlord ↔ Tenant lean methodology
- Overall (STATE)
- 73 Landlord-Friendly
- State Wisconsin
- 73 Landlord-Friendly · R+2
- County
- — inherits STATE
- City
- — inherits STATE
ZIP-level market 53206
- Rents YoY
- 8.3%
- Active inventory
- 150
- Price-to-rent
- 5.3×
Monthly cashflow live
- Estimated rent
- $2,185 high interval (Pro) →
- Mortgage (P&I)
- −$367
- Tax est. 1.5%
- −$88 /mo · $1,050/yr
- Insurance
- −$29
- HOA
- −$0
- Vacancy / Maint / Mgmt
- −$459
- Net cashflow
- $1,242
Break-even live
2-unit breakdown (identical units grouped — click to expand)
| Units | Beds | Baths | Est. rent |
|---|---|---|---|
| 2× units | 3 | 2 | $2,186 |
| #1 | 3 | 2 | $1,093 |
| #2 | 3 | 2 | $1,093 |
| Total (2 units) | $2,185 | ||
UW: 25.0% down · 7.5% · 30yr · 1.5% tax · 5.0% vac · 8.0% maint · 8.0% mgmt
Financing live
Cash to close
- Down payment
- $17,500
- Closing costs
- $2,100
- Reserves months
- —
- Total cash needed
- —
Loan-product check · same deal, 3 products live
Conventional
25% down · 7.5% · 30yr
- Down + closing
- —
- Monthly P&I
- —
- Monthly cashflow
- —
- DSCR
- —
- Eligible?
- —
Personal DTI + credit; lowest rate.
DSCR
20% down · 8.5% · 30yr
- Down + closing
- —
- Monthly P&I
- —
- Monthly cashflow
- —
- DSCR
- —
- Eligible?
- —
No personal income docs; deal must DSCR.
Hard money
10% down · 12.0% · 12mo
- Down + closing
- —
- Monthly P&I
- —
- Monthly cashflow
- —
- DSCR
- —
- Eligible?
- —
Short-term bridge; refi at stabilization.
Rent comps 2 comps
| Address | Beds | Baths | Sqft | Rent | $/sqft | DOM | Units | Dist |
|---|---|---|---|---|---|---|---|---|
| 806 W Keefe Ave Milwaukee, WI | 7.0 | 2.0 | 2900 | $700 | $0.24 | 43d | 1 | 0.62mi |
| 2704 W Concordia Ave Unit Na Milwaukee, WI | 5.0 | 2.0 | 1856 | $2,500 | $1.35 | 23d | 1 | 0.83mi |
Listing history 15 events
-
2026-06-18days on market $70,000 Active 62 DOM
-
2026-06-17days on market $70,000 Active 61 DOM
-
2026-06-16days on market $70,000 Active 60 DOM
-
2026-06-15days on market $70,000 Active 59 DOM
-
2026-06-13days on market $70,000 Active 57 DOM
-
2026-06-13days on market $70,000 Active 56 DOM
-
2026-06-09days on market $70,000 Active 53 DOM
-
2026-06-08days on market $70,000 Active 52 DOM
-
2026-06-07days on market $70,000 Active 51 DOM
-
2026-06-05pricestatusdays on market $70,000 Active 48 DOM
-
2026-04-16$80,000 Active 352-char remark
Show marketing remark (352 chars)
Attention investors: here's your next value-add project! This duplex property is being sold as-is and is ideal for experienced buyers ready to bring vision and capital. Whether you're using cash or hard money, this one is priced for the potential. Located in a high-demand rental area, this blank slate offers strong upside for those ready to renovate.
-
2026-01-18historical 352-char remark
Show marketing remark (352 chars)
Attention investors: here's your next value-add project! This duplex property is being sold as-is and is ideal for experienced buyers ready to bring vision and capital. Whether you're using cash or hard money, this one is priced for the potential. Located in a high-demand rental area, this blank slate offers strong upside for those ready to renovate.
-
2025-10-30status Active 352-char remark
Show marketing remark (352 chars)
Attention investors: here's your next value-add project! This duplex property is being sold as-is and is ideal for experienced buyers ready to bring vision and capital. Whether you're using cash or hard money, this one is priced for the potential. Located in a high-demand rental area, this blank slate offers strong upside for those ready to renovate.
-
2025-10-30historical 352-char remark
Show marketing remark (352 chars)
Attention investors: here's your next value-add project! This duplex property is being sold as-is and is ideal for experienced buyers ready to bring vision and capital. Whether you're using cash or hard money, this one is priced for the potential. Located in a high-demand rental area, this blank slate offers strong upside for those ready to renovate.
-
2025-10-17$85,000 Active 352-char remark
Show marketing remark (352 chars)
Attention investors: here's your next value-add project! This duplex property is being sold as-is and is ideal for experienced buyers ready to bring vision and capital. Whether you're using cash or hard money, this one is priced for the potential. Located in a high-demand rental area, this blank slate offers strong upside for those ready to renovate.
ⓘ Source: listings_history table (triggers on properties + properties_extension) + one-shot
backfill from property_details.listing_events for pre-trigger history.
Climate risk First Street
- Flood 6/10 Major FEMA zone X (unshaded) · 68% chance over 30 yrs
- Wildfire 1/10 Low
- Heat 2/10 Low 7 d/yr ≥98°F today · 13 d/yr by 30 yrs out
- Wind 2/10 Low
- Air quality 3/10 Moderate 3 unhealthy d/yr today · 4 by 30 yrs out
Nearby sold comps map
Loading sold comps map…
Walkable amenities ~0.75 mi
Loading nearby amenities…
Taxation est. · year 1
- Rental income
- $26,220
- − Mortgage interest
- −$3,921
- − Property taxes
- −$1,050
- − Insurance
- −$350
- − Repairs & maintenance
- −$2,098
- − Management
- −$2,098
- − Depreciation
- −$2,036
- Taxable income
- $14,667
- Est. tax owed @ 24.0%
- −$3,520
- After-tax cash flow
- $11,389/yr
For passive investors: Depreciation is non-cash, so a rental often shows a tax loss while cash-flowing — sheltering income. Rental losses are passive: they offset passive income freely, and up to $25,000/yr can offset ordinary (W-2) income if you actively participate and your MAGI is under $100k (phasing out to $0 by $150k); unused losses carry forward. On sale, claimed depreciation is recaptured at up to 25%, and gains may owe capital-gains tax (a 1031 exchange can defer both). Figures are a year-1 estimate at your 24.0% rate — not tax advice; consult a CPA.
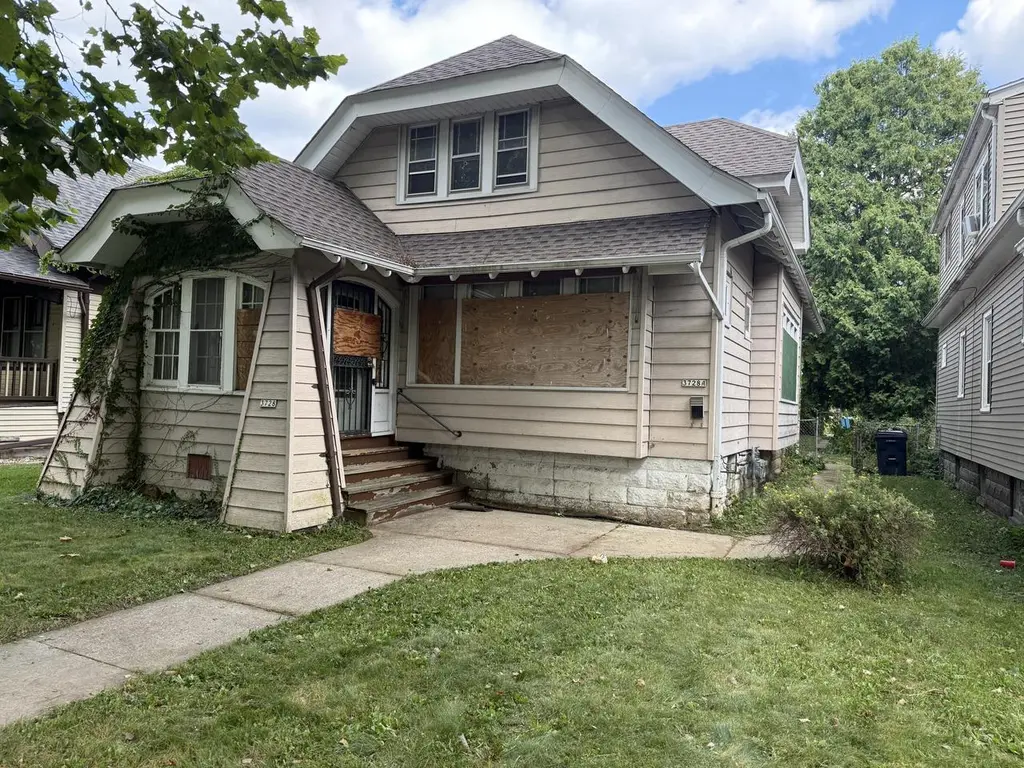
Condition & rehab AI · 4 photos
This property requires extensive repairs and improvements to become move-in ready. Immediate focus should be on structural repairs and landscaping to enhance its value.
Repairs flagged
- Major Boarded-up windows — Structural damage or safety hazard
- Major Overgrown vegetation — Safety hazard and poor curb appeal
- Major Structural issues — Boarded-up windows suggest structural problems
Value-add opportunities
- Both Landscaping and curb appeal improvements — Enhances curb appeal and property value
- Both Boarded-up windows repair — Safeguards against further damage and improves property value
- Both Structural repairs — Ensures safety and property value
Renovation cost estimate screening
| Repair item | Severity | Est. cost |
|---|---|---|
| Boarded-up windows · Structural damage or safety hazard | Major | $15,000–50,000 |
| Overgrown vegetation · Safety hazard and poor curb appeal | Major | $15,000–50,000 |
| Structural issues · Boarded-up windows suggest structural problems | Major | $15,000–50,000 |
| Total estimated repair cost · 3 items | $45,000–150,000 |
Value-add ROI direction
- Both Landscaping and curb appeal improvements — Enhances curb appeal and property value ↑
- Both Boarded-up windows repair — Safeguards against further damage and improves property value ↑
- Both Structural repairs — Ensures safety and property value ↑
ⓘ Cost ranges are severity-bucket heuristics (US national rule-of-thumb). Get contractor quotes + a written scope before underwriting a rehab budget.
Schools (NCES district)
- District
- Milwaukee School District
- NCES district ID
- 5509600
- Math proficiency
- 10% ▼ -5.00%
- Reading proficiency
- 18% ▬ 0.00%
- Median HH income
- $36,339
- Composite
- 11.61/100
- National rank
- #9696
- State rank
- #337 of 342 in WI
Livability — Milwaukee
- Score
- 81/100
- State rank
- #55
- US rank
- #1534
Category grades
Schools grade is shown separately in the Schools card above.
Census & demographics
- Census place
- Milwaukee, WI
- County
- Milwaukee County · 926,379 people
- City population
- 573,768
- Metro
- Milwaukee-Waukesha, WI
- Population (ZIP)
- 19,887
- Household income
- $29,336
- Rent vs Own
- Severe rent burden
- 2061.0
Population outlook (Milwaukee County) Hauer SSP2
- Today (2025)
- 995,758 people
- By 2030
- 1,009,124 · +1.3%
- By 2040
- 1,028,128 · +3.3%
- By 2050
- 1,040,066 · +4.4%
- By 2075
- 1,057,849 · +6.2%
- By 2100
- 1,039,774 · +4.4%
Race, ethnicity, and origin ACS 2023
- Neighborhood character
- Predominantly Black (91%)
- Race & ethnicity
- Black 91% Two or more races 3% White 3% Hispanic / Latino 3%
- Common ancestry
- Norwegian 1%
- Foreign-born
- 1% · Canada
- Languages at home
- 97% English-only · Spanish 2%
Political lean MEDSL · Milwaukee
- 2024 margin
- Solid D (+38.5) · D 68.3% · R 29.8% · Other 1.8%
- 2008→2024 swing
- +2.7pp toward D · 2008: 35.9pp · 2024: 38.5pp
- All cycles
- 2024: D+38.5 2020: D+39.9 2016: D+37.5 2012: D+34.6 2008: D+35.9
Not yet ingested
- Civics
- —
Market trends
- HPI YoY
- ▲ 133.03%
- Current HPI
- 397.7151
- Rent YoY
- ▲ 8.28%
- Metro
- Milwaukee-Waukesha, WI
- State GDP YoY
- ▲ 2.10%
- F500 in state
- 20
Industry mix (Fortune 500 HQ in WI)
| Industry | F500 HQs | Revenue |
|---|---|---|
| Industrial Machinery | 4 | $23B |
|
||
| Industrial Technology | 2 | $36B |
|
||
| Insurance | 1 | $36B |
|
||
| Professional Services | 1 | $19B |
|
||
| Utilities | 1 | $9B |
|
||
| Consumer Goods | 1 | $3B |
|
||
Price history
-5.9% since first listed5 events — show timeline
- 2026-04-16 Listed $80,000 METROMLS
- 2026-01-18 Listing Removed — METROMLS
- 2025-10-30 Relisted — METROMLS
- 2025-10-30 Listing Removed — METROMLS
- 2025-10-17 Listed $85,000 METROMLS
Cash-flow waterfall
monthlySold comps — $/sqft
last 12 mo · ≤1 miLoading sold comps…