4748 W 40th St · Clearlake, CA
Flood risk 1/10 · Minimal
- FEMA flood zone
- X (unshaded)
- Chance of flooding over 30 yrs
- 0.0%
- Est. flood insurance / yr
- $507 – $1,088
Fire risk 10/10 · Severe
- Est. fire insurance / yr
- $659 – $1,223
Heat risk 6/10 · Moderate
- Hot days now (above 100°F)
- 7 days/yr
- Hot days in 30 yrs
- 14 days/yr
Wind risk 1/10 · Minimal
- Chance of severe wind over 30 yrs
- —
Air-quality risk 10/10 · Severe
- Unhealthy air days now
- 31 days/yr
- Unhealthy air days in 30 yrs
- 33 days/yr
Risk factors via First Street. Map © Google.
Why this score? — see what drove the B grade
The composite is a weighted blend of 9 inputs, each scored 0–100. Each bar is that input's sub-score; the figure is the points it added to the 100-point composite (weight × sub-score).
- Cash flow +30.0/30.0
- ARV discount +15.0/15.0
- DSCR +10.0/10.0
- 1% rule +9.0/10.0
- Livability +3.1/5.0
- Rent growth +2.5/5.0
- Condition / age +2.5/5.0
- Schools +1.2/10.0
- Appreciation +0.0/10.0
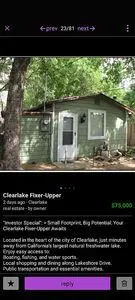
$75,000
🖨 Deal sheet (PDF) 📄 Offer letter ✓ Due diligence
Listing remarks
?& quot; Investor Special& quot; : & gt; Small Footprint, Big Potential: Your Clearlake Fixer-Upper Awaits Located in the heart of the city of Clearlake, just minutes away from California & acirc; & euro; & trade; s largest natural freshwater lake. Enjoy easy access to: ?Boating, fishing, and water sports. ?Local shopping and dining along Lakeshore Drive. ?Public transportation and essential amenities. The over 6,000 sq. ft. lot offers plenty of room for gardening, outdoor entertaining, or the potential for future expansion. Upgraded 200 amp electric service. Whether you& apos; re looking for an affordable entry into homeownership or your next & quot; fixer&
Key facts
- Built 1952
Neighborhood map
What this means for you Summary
Snapshot
- This is a 1-bed/1.5-bath single-family listed at $75k.
Deal economics
- At list price, monthly cash flow is $379 ($5k/yr) — positive.
- The deal already cash-flows at list — no discount required.
- Meets the 1% rule at list price ($1k rent vs $75k).
- Cap rate 12.4% vs local median 3.8% in Clearlake — top-decile yield for the area; either an underpriced asset or a hidden risk that comps aren't pricing in. Stress-test before assuming the spread holds.
Location & tenants
- Location reads 61/100 on livability (#549 in CA) — a middle-class / working-renter tenant base. Strengths: housing A+, health & safety A+; Watch: crime F, amenities F, commute F.
- Konocti Unified (town): math 9% / reading 21% proficiency, ranked #494 of 517 in CA (top 96%) — low school quality limits family demand, transient renter base, plan for 1-2y turnover; 77% free/reduced lunch — lower-income household profile, screen leases tightly.
- Zoned schools: Burns Valley (math 12% / reading 26%, grade F, #1,304 of 1,571 statewide, top 84%, 544 students, 89% FRL); Highlands Academy (reading 24%, 12 students, 92% FRL); Lower Lake High (math 4% / reading 28%, grade F, #1,034 of 1,170 statewide, top 88%, 1,057 students, 79% FRL).
- Market conditions: 292 active listings in the ZIP; 107 units permitted in Lake County in 2024 (40 in 5+ unit buildings).
Forward outlook
- Local home prices are declining (-3.0%/yr); year-one equity from $519 of loan paydown is wiped out by about $2k of value loss. Plan a longer hold.
- Lake County population projected at -15% by 2050 — secular population decline; favor cash flow + early exit over multi-decade hold.
- At projected returns (-3.0% appreciation + 3.0% rent growth), your $21k cash investment doubles in ~6 years — after that, you're playing with house money.
Negotiation context
- Only 0 days on market — expect competitive offers; lowballing is unlikely to land.
- Current owner paid $30k; list at $75k implies a 150% gain — meaningful room to come down on a strong offer.
Risks & watch-outs
- Watch-outs: built in 1952 — expect roof / HVAC / electrical / plumbing capex.
- Climate carrying-cost: severe wildfire risk; extreme-heat days projected 7→14/yr by 2055 (HVAC capex compounding) — expect insurance premiums to compound above CPI over the hold.
Questions for the listing agent
- Built in 1952 — when were the roof, HVAC, electrical panel, plumbing, and water heater last replaced?
- Is there a deadline driving the sale (1031 exchange, divorce, estate, relocation)? That informs how much negotiation room exists.
- Schools are F-rated, which usually means shorter tenancies and higher turnover. Who's the typical renter profile here, and what's been the actual vacancy rate?
- Crime grade is F in this area — have there been break-ins, vandalism, or insurance claims at this property in the last 3 years? What carrier currently insures it and at what premium?
- What's the average days-on-market for RENTAL listings here right now (not sales)? A rising rental-DOM trend means longer vacancies and softer asking-rent achievability than the comps imply.
- What's the recent tenant-quality profile in this submarket — average credit score on applications, eviction rate, late-payment / NSF rate, and stable-employment percentage? A property-management company in the area should have these aggregated.
- How much new for-sale + rental construction is in the pipeline within 1–3 miles? Heavy new supply typically softens prices + rents 12–24 months out; constrained supply supports both.
Investment metrics
- 1% rule
- 1.40% ✓
- Cap rate
- 12.36%
- Cash-on-cash
- 21.66%
- DSCR
- 1.96
- GRM
- 5.9
CMA / ARV
- ARV (on-the-fly)
- $90,508
- Comps found
- 1
Show comp detail 1 sale within ~0.75 mi
| Address | Dist | Beds/Ba | Sqft | Sold | Price | $/sf | Match |
|---|---|---|---|---|---|---|---|
| 14638 Palmer Ave | 0.33mi | 1/1.0 | 412 (-15%) | 20mo | $77,000 | $187 | 41 |
Match score weights: distance 35% · size 25% · config 20% · recency 20%. Top-matched comps best support the ARV.
Projected returns pro-forma
-3.0% appreciation · 3.0% rent growth · sell at horizon
- IRR
- 14.2%
- Equity multiple
- 1.57×
- Total profit
- $11,960
- Equity at exit
- $11,183
- IRR
- 23.0%
- Equity multiple
- 2.97×
- Total profit
- $41,397
- Equity at exit
- $6,485
Cash invested: $21,000 (down + closing). Projections, not guarantees.
Landlord ↔ Tenant lean methodology
- Overall (STATE)
- 18 Strongly Tenant-Friendly
- State California
- 18 Strongly Tenant-Friendly · D+13
- County
- — inherits STATE
- City
- — inherits STATE
ZIP-level market 95422
- Home prices YoY
- -33.4%
- Active inventory
- 292
- Price-to-rent
- 5.9×
Monthly cashflow live
- Estimated rent
- $1,053 medium interval (Pro) →
- Mortgage (P&I)
- −$393
- Tax from tax record
- −$29 /mo · $344/yr
- Insurance
- −$31
- HOA
- −$0
- Vacancy / Maint / Mgmt
- −$221
- Net cashflow
- $379
Break-even live
Sensitivity live
| Price | -10% $421 | -5% $400 | +0% $379 | +5% $358 | +10% $337 |
|---|---|---|---|---|---|
| Rent | -10% $296 | -5% $337 | +0% $379 | +5% $421 | +10% $462 |
| Rate | -1.0pp $417 | -0.5pp $398 | base $379 | +0.5pp $360 | +1.0pp $340 |
UW: 25.0% down · 7.5% · 30yr · 1.5% tax · 5.0% vac · 8.0% maint · 8.0% mgmt
Financing live
Cash to close
- Down payment
- $18,750
- Closing costs
- $2,250
- Reserves months
- —
- Total cash needed
- —
Loan-product check · same deal, 3 products live
Conventional
25% down · 7.5% · 30yr
- Down + closing
- —
- Monthly P&I
- —
- Monthly cashflow
- —
- DSCR
- —
- Eligible?
- —
Personal DTI + credit; lowest rate.
DSCR
20% down · 8.5% · 30yr
- Down + closing
- —
- Monthly P&I
- —
- Monthly cashflow
- —
- DSCR
- —
- Eligible?
- —
No personal income docs; deal must DSCR.
Hard money
10% down · 12.0% · 12mo
- Down + closing
- —
- Monthly P&I
- —
- Monthly cashflow
- —
- DSCR
- —
- Eligible?
- —
Short-term bridge; refi at stabilization.
Listing history 2 events
-
2026-06-10remarks 667-char remark
-
2026-06-10$75,000 Under Contract
ⓘ Source: listings_history table (triggers on properties + properties_extension) + one-shot
backfill from property_details.listing_events for pre-trigger history.
Tax reassessment forecast CA · Resets to sale price
- Current annual tax
- $344 · $29/mo
- Projected year-2 tax
- $570 · $48/mo
- Expected delta
- +$226/yr (+$19/mo · 65.5%)
ⓘ Screening estimate from a state-policy table — verify with the county assessor before closing.
Climate risk First Street
- Flood 1/10 Low FEMA zone X (unshaded) · 0% chance over 30 yrs
- Wildfire 10/10 Extreme
- Heat 6/10 Major 7 d/yr ≥100°F today · 14 d/yr by 30 yrs out
- Wind 1/10 Low
- Air quality 10/10 Extreme 31 unhealthy d/yr today · 33 by 30 yrs out
Nearby sold comps map
Loading sold comps map…
Walkable amenities ~0.75 mi
Loading nearby amenities…
Taxation est. · year 1
- Rental income
- $12,642
- − Mortgage interest
- −$4,201
- − Property taxes
- −$344
- − Insurance
- −$375
- − Repairs & maintenance
- −$1,011
- − Management
- −$1,011
- − Depreciation
- −$2,182
- Taxable income
- $3,517
- Est. tax owed @ 24.0%
- −$844
- After-tax cash flow
- $3,704/yr
For passive investors: Depreciation is non-cash, so a rental often shows a tax loss while cash-flowing — sheltering income. Rental losses are passive: they offset passive income freely, and up to $25,000/yr can offset ordinary (W-2) income if you actively participate and your MAGI is under $100k (phasing out to $0 by $150k); unused losses carry forward. On sale, claimed depreciation is recaptured at up to 25%, and gains may owe capital-gains tax (a 1031 exchange can defer both). Figures are a year-1 estimate at your 24.0% rate — not tax advice; consult a CPA.
Schools (NCES district)
- District
- Konocti Unified
- NCES district ID
- 0620070
- Math proficiency
- 9% ▼ -5.00%
- Reading proficiency
- 21% ▼ -6.00%
- Median HH income
- $30,026
- Composite
- 11.81/100
- National rank
- #9677
- State rank
- #494 of 517 in CA
Livability — Clearlake
- Score
- 61/100
- State rank
- #549
- US rank
- #18284
Category grades
Schools grade is shown separately in the Schools card above.
Census & demographics
- Census place
- Clearlake, CA
- Population (ZIP)
- 17,101
Population outlook (Lake County) Hauer SSP2
- Today (2025)
- 62,396 people
- By 2030
- 60,626 · -2.8%
- By 2040
- 56,453 · -9.5%
- By 2050
- 53,054 · -15.0%
- By 2075
- 47,663 · -23.6%
- By 2100
- 41,804 · -33.0%
Race, ethnicity, and origin ACS 2023
- Neighborhood character
- Diverse neighborhood (Simpson 0.59)
- Race & ethnicity
- White 56% Hispanic / Latino 30% Two or more races 15% Black 4% Native American 3% Asian 1%
- Hispanic origin (detail)
- Mexican 26%
- Common ancestry
- Lithuanian 3% Italian 1% Russian 1%
- Foreign-born
- 10% · Canada
- Languages at home
- 77% English-only · Spanish 22% Other Indo-European 1%
Political lean MEDSL · Lake
- 2024 margin
- Toss-up / Even · D 47.8% · R 49.2% · Other 3.0%
- 2008→2024 swing
- -20.6pp toward R · 2008: 19.3pp · 2024: -1.4pp
- All cycles
- 2024: R+1.4 2020: D+6.3 2016: D+3.7 2012: D+16.5 2008: D+19.3
Not yet ingested
- Civics
- —
Market trends
- HPI YoY
- ▼ -124.47%
- Current HPI
- 248.654
- Rent YoY
- —
- Metro
- —
- State GDP YoY
- ▲ 3.21%
- F500 in state
- 116
Industry mix (Fortune 500 HQ in CA)
| Industry | F500 HQs | Revenue |
|---|---|---|
| Technology | 27 | $1,492B |
|
||
| Financial Services | 3 | $174B |
|
||
| Retail | 3 | $44B |
|
||
| Insurance | 3 | $26B |
|
||
| Media / Entertainment | 2 | $115B |
|
||
| Pharmaceuticals / Biotech | 2 | $62B |
|
||
Price history
+200.0% since first listed3 events — show timeline
- 2026-06-09 Listed $75,000 FSBO.com
- 2007-02-16 Sold (Public Records) $30,000 Public Records
- 1991-04-01 Sold (Public Records) $25,000 Public Records
Property tax history
+4.5%/yrLatest (2025): $344 · +2.3% YoY. Source: county tax records.
Cash-flow waterfall
monthlySold comps — $/sqft
last 12 mo · ≤1 miLoading sold comps…